


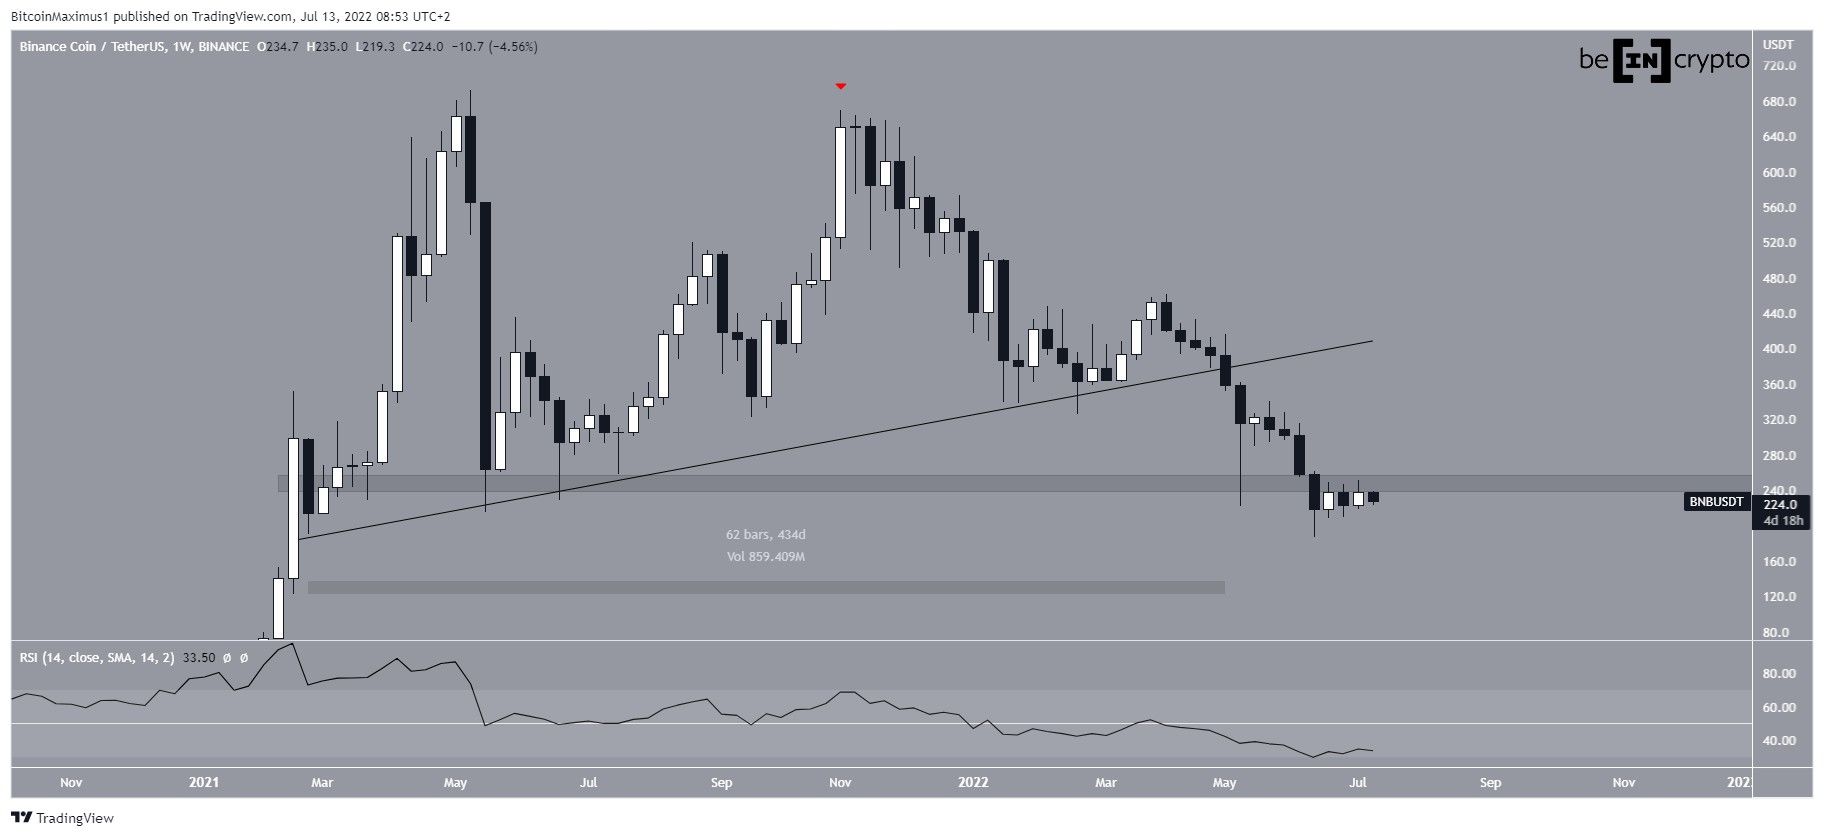
Binance Coin (BNB) is at the middle of a parallel channel that has been in place since Nov 2021. Whether it reclaims the midline or gets rejected by it could determine the direction of the future trend.
BNB has been falling since making its first lower high in Nov (red icon). At the beginning of May, the downward movement caused a breakdown from an ascending support line, which had previously been in place for 434 days. Breakdowns from such long-term structures area usually a sign of a trend reversal.
Afterward, the price fell below the $250 horizontal area, which had been acting as support since the beginning of the year.
So, BNB has broken down from both a horizontal and diagonal long-term support level.
The weekly RSI is at 30, very close to an all-time low and the upper limit of its oversold region. But there is no bullish divergence that would be a sign of a potential bullish trend reversal.
So, unless the price manages to reclaim the $250 resistance area, the trend cannot be considered bullish.
Current pattern
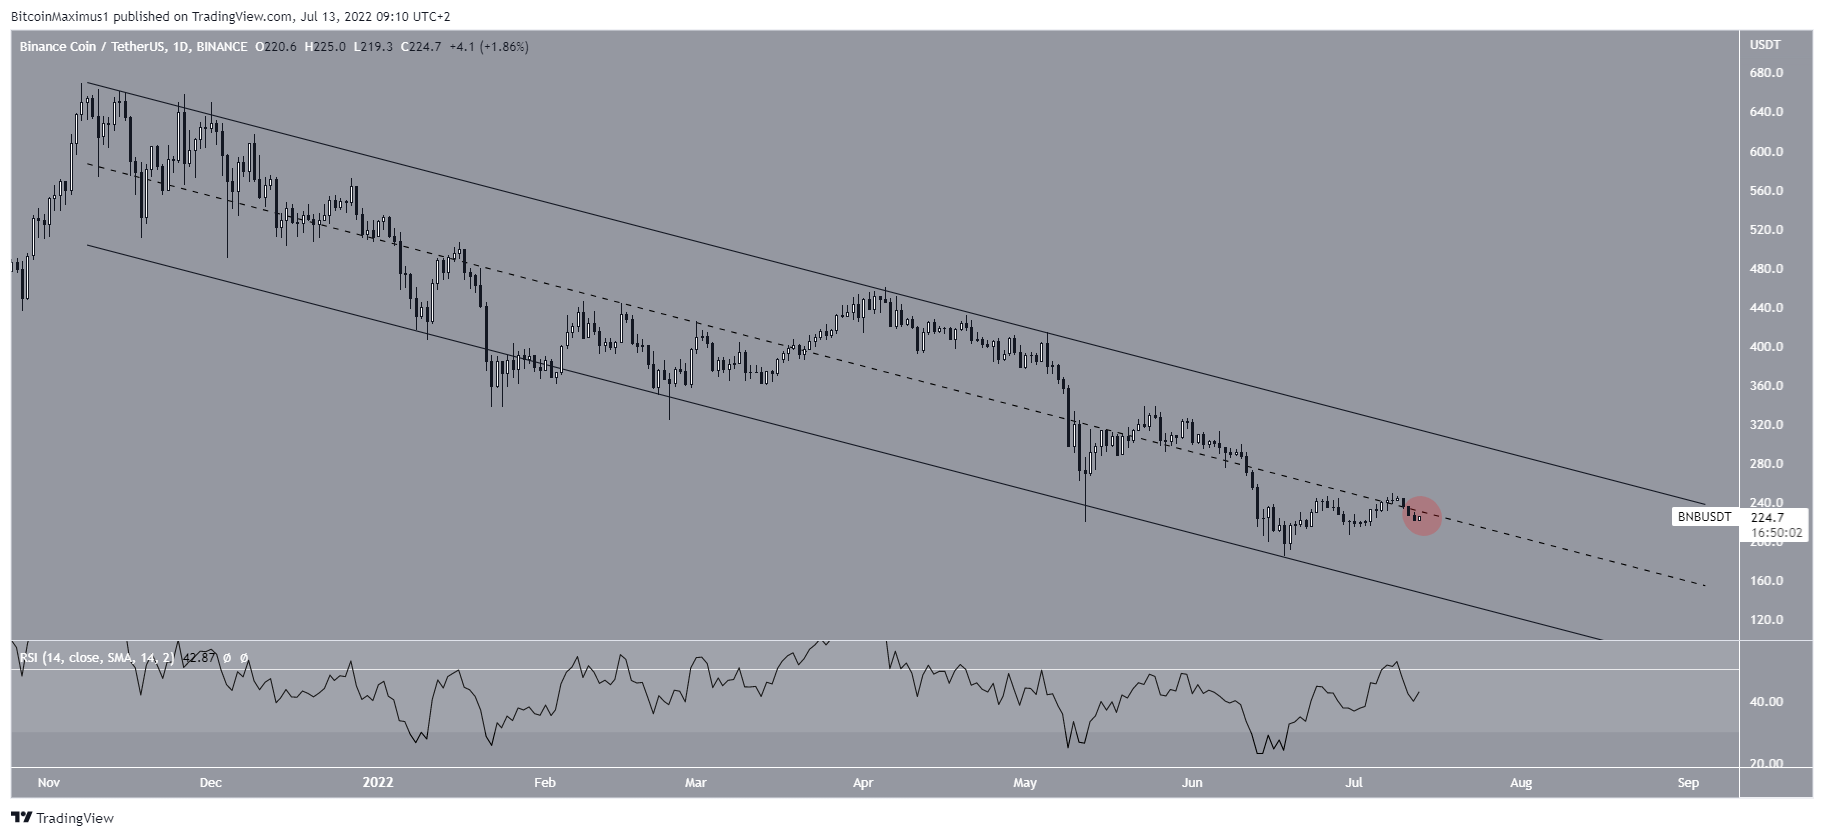
The daily chart shows that BNB has been decreasing inside a descending parallel channel since Nov. More recently, it bounced at the support line of the channel on June 18. It has been increasing since and is currently at the middle of the pattern (red circle), which is providing resistance.
At the same time, the daily RSI was rejected by the 50 line and has been falling. While it previously bounced outside its oversold territory, it has not generated any sort of bullish divergence.
So, whether the price and RSI break out from their respective resistances or get rejected could go a long way in determining the direction of the future movement.
Future BNB movement
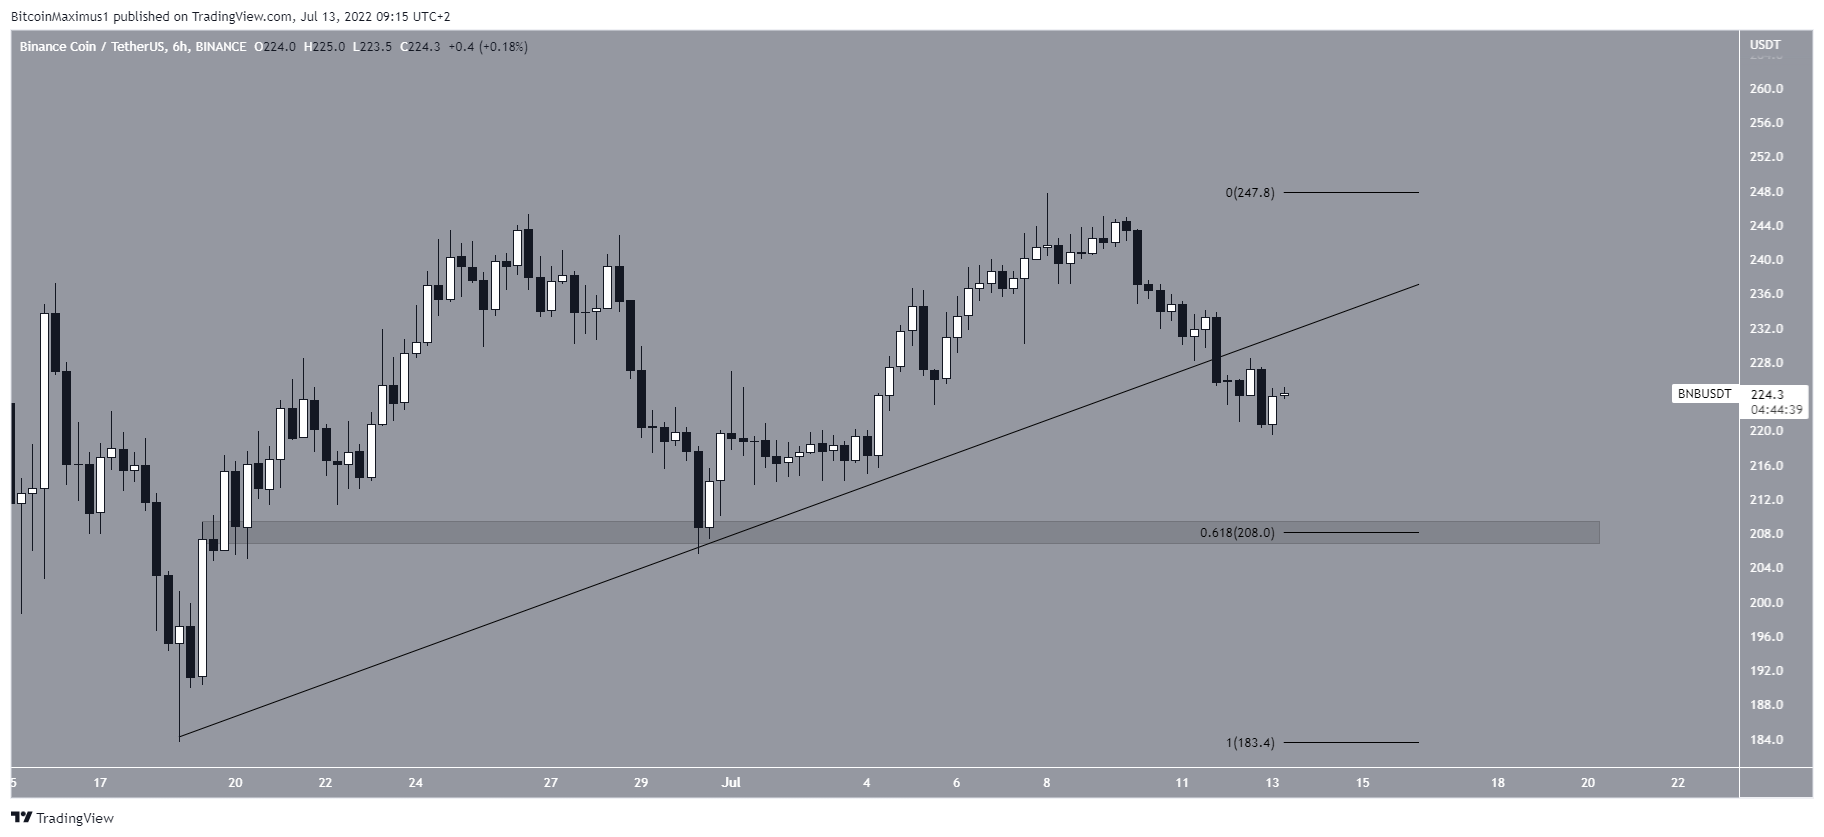
Finally, the six-hour chart shows that while the price has created two higher lows, it has also broken down from an ascending support line that had been in place since June 18. This could mean that the upward movement that began at the same time has now ended.
While there is support at $208, created by the 0.618 Fib retracement support level and a horizontal support area, a potential breakdown below this area would likely lead to new yearly lows.
For Be[in]Crypto’s previous bitcoin (BTC) analysis, click here.


