


The Bella Protocol (BEL) price has broken out from a descending resistance line and reclaimed an important resistance area.
BEL is currently retesting this support level, and if successful, it should continue moving higher, possibly towards $3.10.
Breakout and Pump
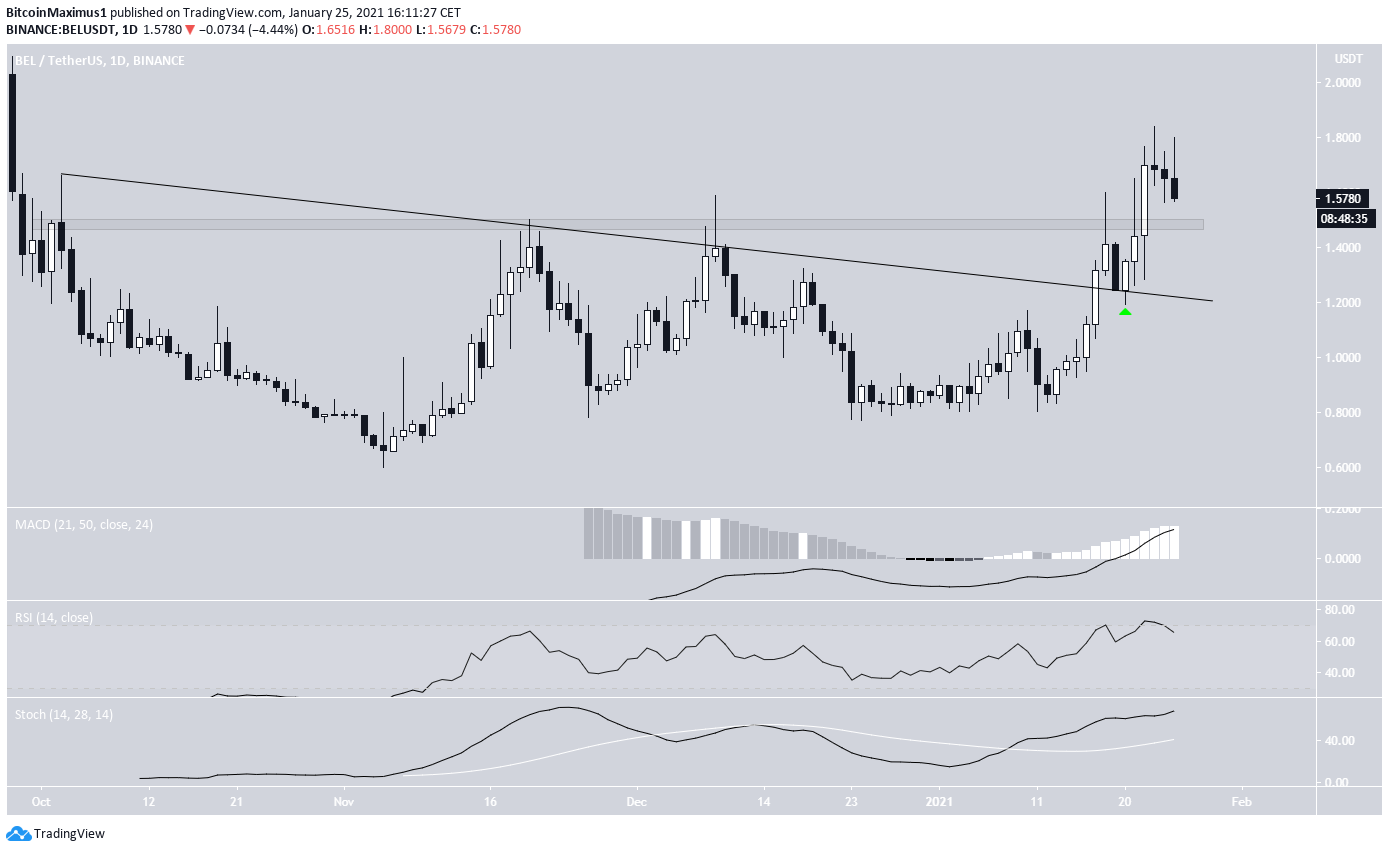
BEL had been following a descending resistance line since Oct. 3, 2020. It made three unsuccessful attempts to move above it before finally breaking out on Jan. 17, 2021.
Afterward, it validated the line as support (shown with the green arrow) before moving upwards and reclaiming the $1.49 resistance area. Currently, it’s in the process of validating this line as support.
Technical indicators are bullish, supporting the continuation of the upward move.
Cryptocurrency trader @Crypto_Off outlined a BEL chart that shows a breakout and retest above a descending resistance line. He expects the price to continue moving higher.
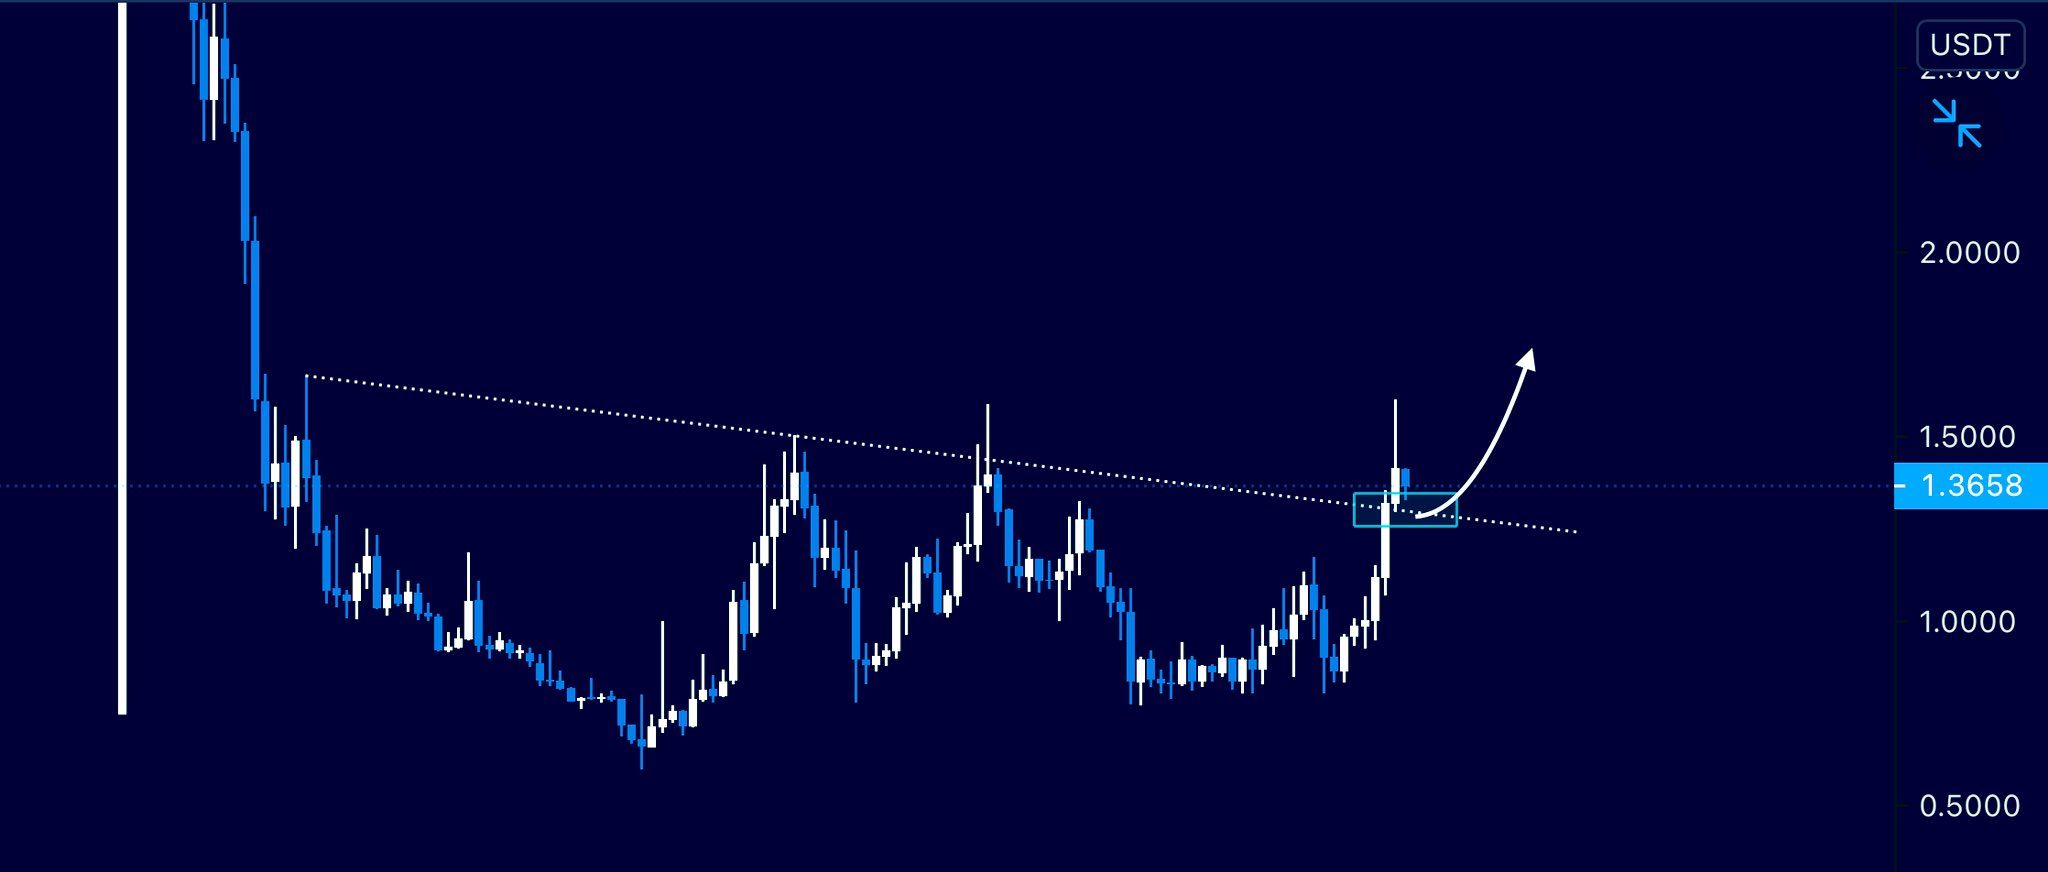
Since the tweet, BEL has validated the support line and reclaimed the next horizontal resistance. As outlined above, it’s currently in the process of retesting the previous resistance at $1.49 and validating it as support.
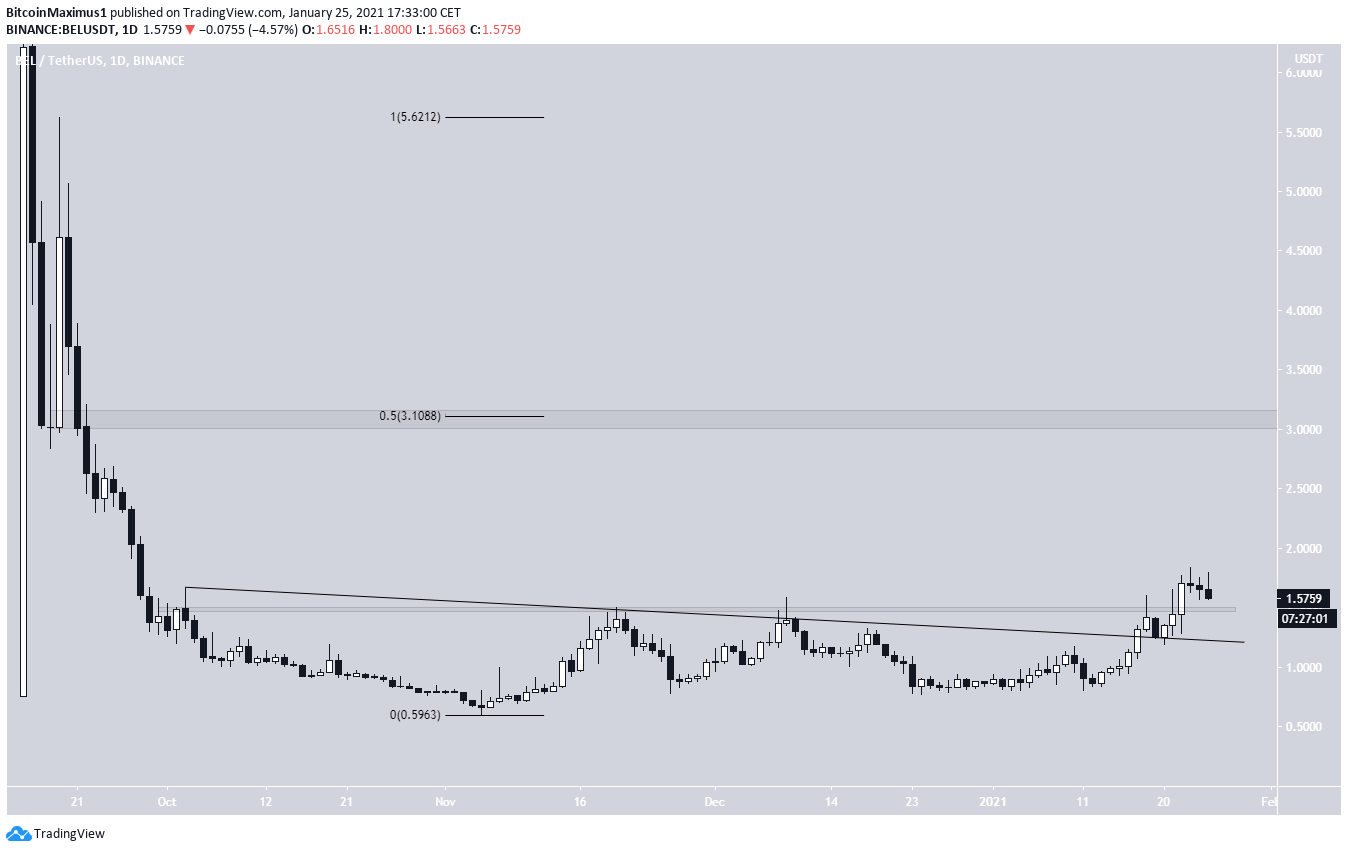
If BEL continues to move upwards, the next closest resistance area would be at $3.10, the 0.5 Fib retracement level of the entire downward move.
Short-Term Movement
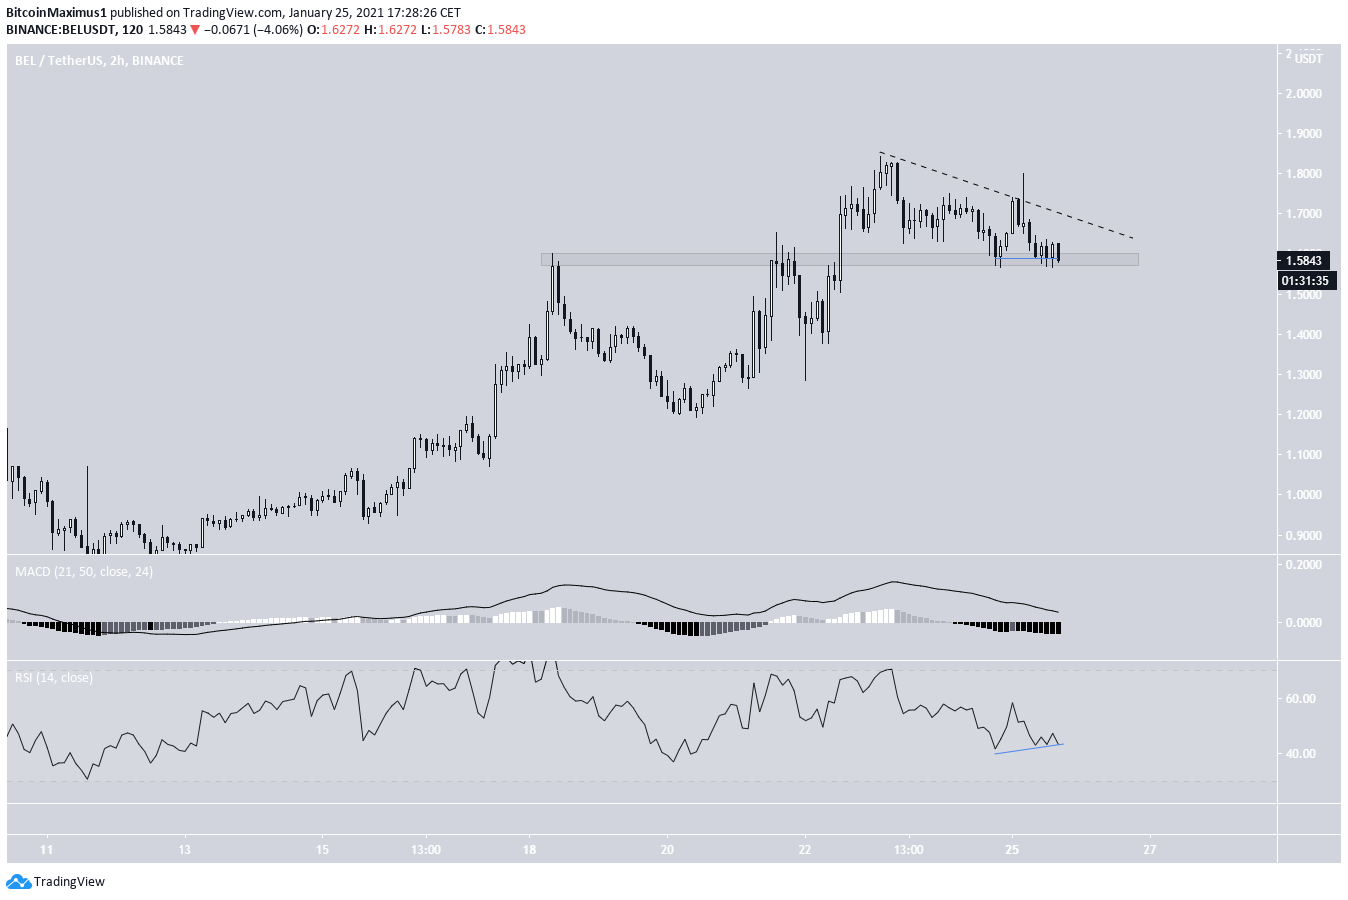
The shorter-term chart shows that BEL is trading just above the $1.57 area, which has now likely turned to support.
Furthermore, there is some bullish divergence in the RSI, indicating a possible bullish trend reversal.
If BEL were to break out above the current descending resistance line, it would confirm that the short-term trend has turned bullish once more and will likely move towards the $3.10 target.
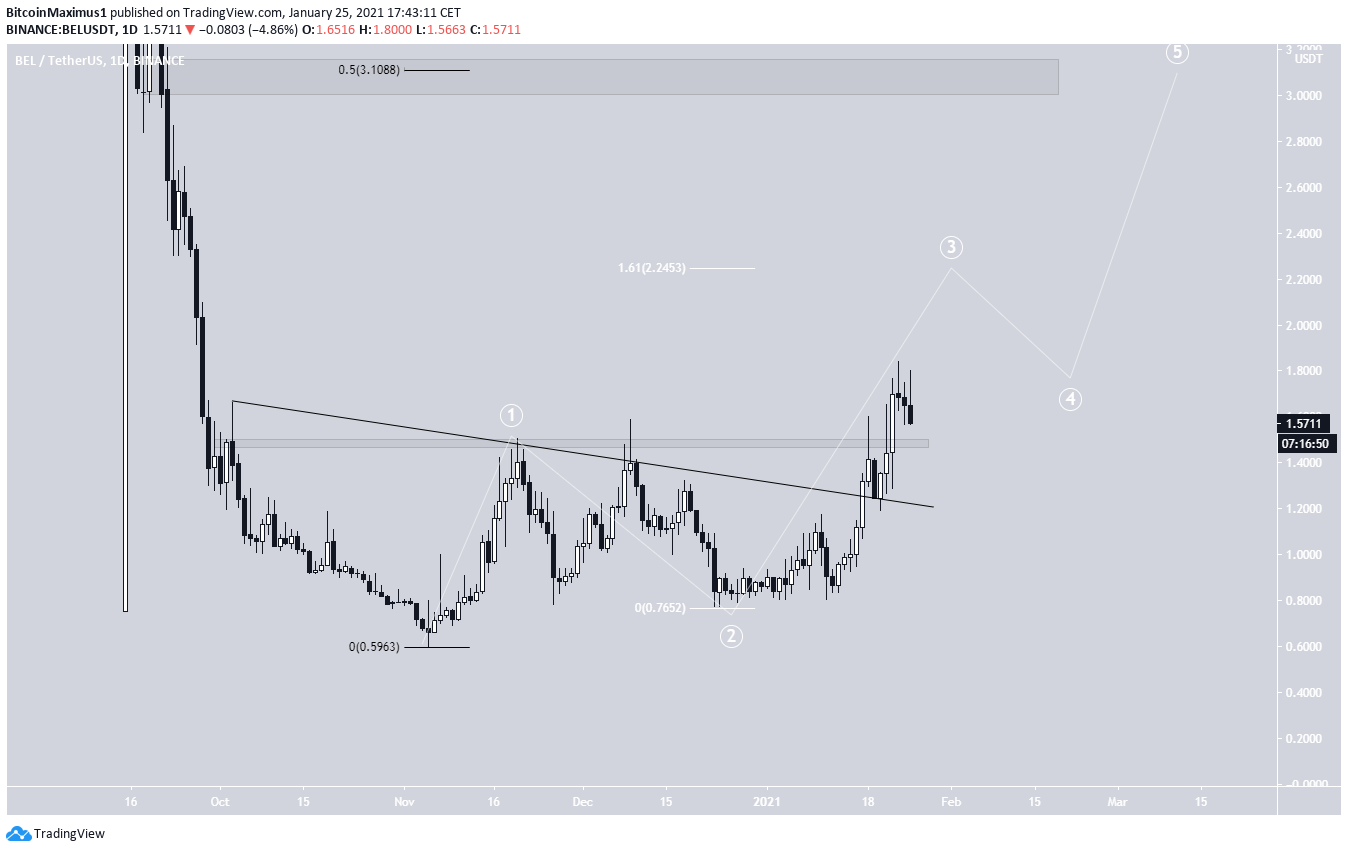
BEL’s Wave Count
The wave count suggests that BEL is in wave 3 of a bullish impulse, which began on Nov. 2019 (white). A likely target for the top of this wave is at $2.25, which would give waves 1 to 3 a 1:1.61 ratio.
Afterward, the entire bullish impulse could end near the previous $3.10 resistance area.
Conclusion
To conclude, BEL seems to be retesting the previous breakout level, and if it successfully validates it as support, it’s likely to continue increasing towards $2.25 and possibly $3.10.
For BeInCrypto’s latest Bitcoin (BTC) analysis, click here!


