See More

When Will the Bear Market End for Bitcoin Cash? (BCH/USD & EUR Price Analysis: April 24)

3 mins
Updated by Valdrin Tahiri
Join our Trading Community on Telegram
At BeInCrypto, we offer regular price analyses and predictions of the most popular and relevant cryptoassets. In our April 22 analysis of Bitcoin Cash (BCH), we predicted short-term decreases. Our prediction was validated on Apr 24, when the price reached the support area we defined. To learn more, read our latest BCH/USD($) and BCH/EUR(€) analysis below:

On Apr 15, the price reached a high of $335 and €296. It has been gradually decreasing since, reaching lows of $280 and €253 on Apr 21. After a slight increase, the price began to decrease sharply.
 
BCH Market Outlook
BCH/USD & BCH/EUR Prices: Apr 16 – Apr 24
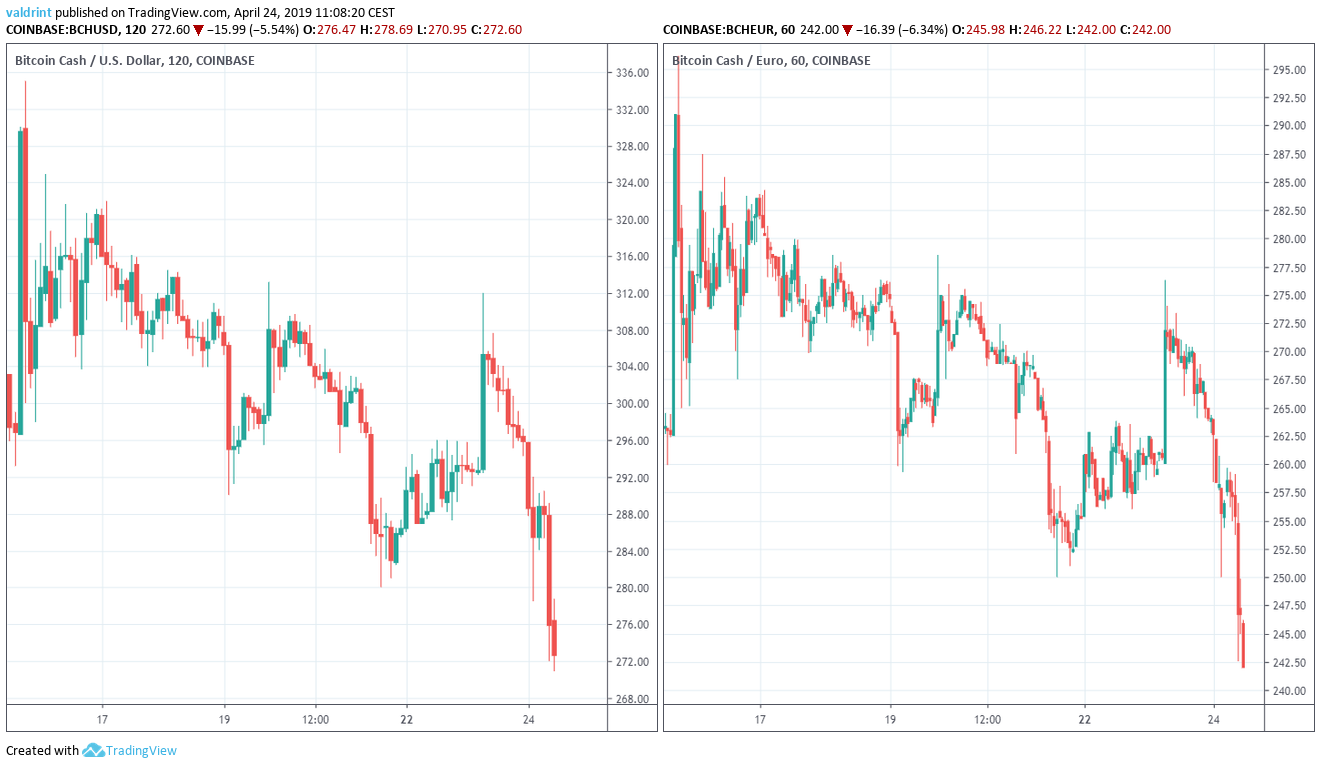
At the time of writing, it was trading below the levels reached on Apr 21. Will the price of Bitcoin Cash continue falling or is reversal coming soon? Let’s find out:

Bitcoin Cash (BCH): Trends For April 24, 2019

  • BCH/USD and BCH/EUR reached a high on Apr 15.
  • Bitcoin Cash is trading inside a descending channel.
  • The moving averages have made a bearish cross.
  • There is support near $260 and €235.

Descending Channel

The price of BCH/USD on Coinbase is analyzed at two-hour intervals from Apr 15 to Apr 24. This is done in order to trace the current trading pattern. In order to avoid confusion, we will not be using images of the BCH/EUR pair until we address future possible price levels. There, the relevant resistance and support areas will be shown in dollars and euros.
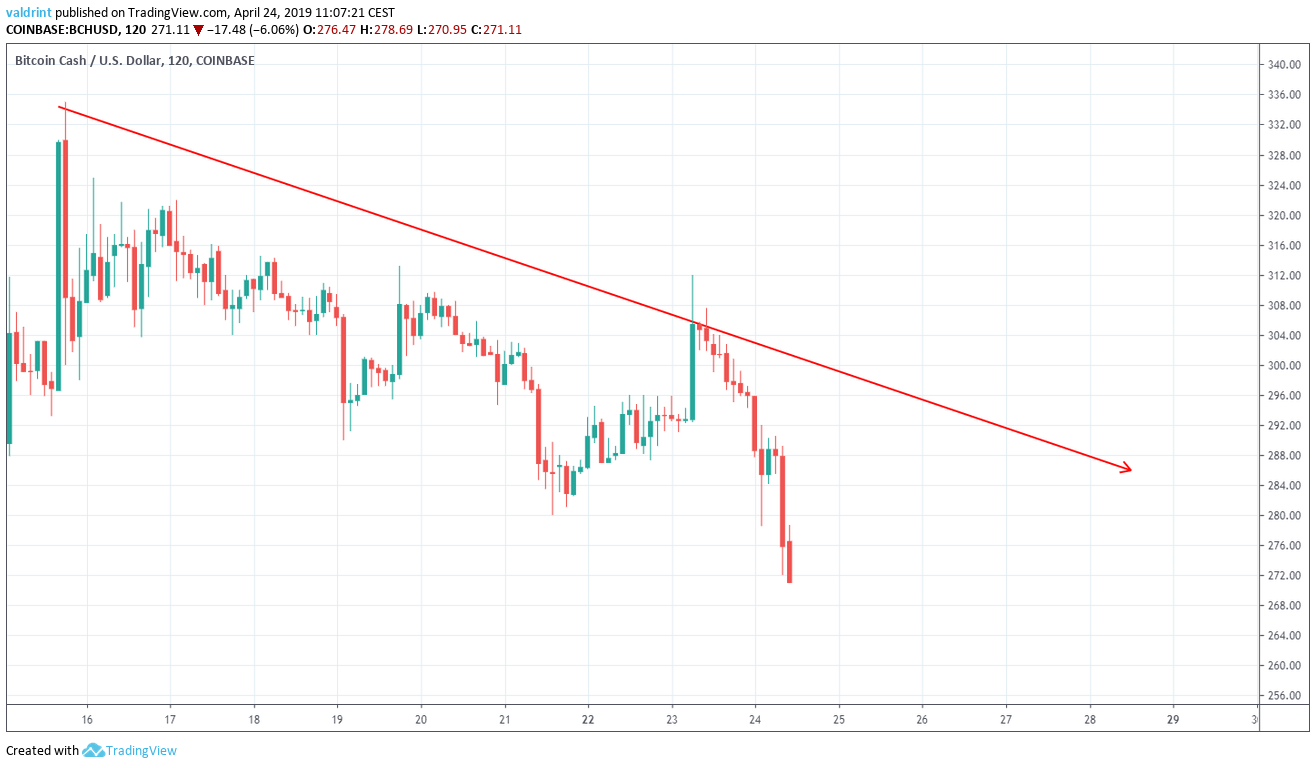
On Apr 16, Bitcoin Cash reached a high of $324.9 Several market cycles have been completed, and the price has created lower highs. Tracing these highs gives us a descending resistance line: Descending Resistance
On Apr 15, the price reached a low of $298. A gradual increase was followed by a decrease. The price has made several lower lows. Tracing these lows gives us a descending support line. Together, the resistance and support lines combine to create a descending channel: Descending Channel 
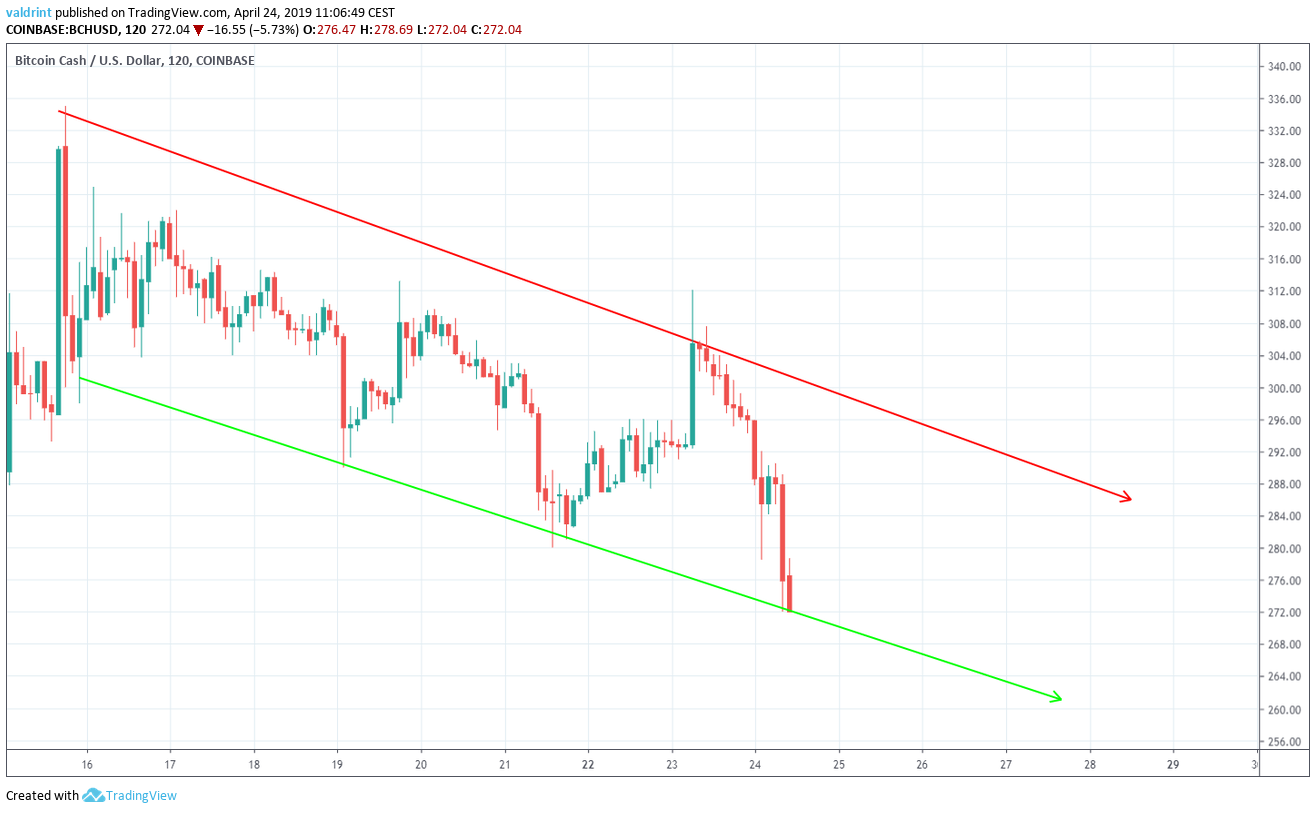
It is likely that the price will keep decreasing at the rate predicted by the channel until a decisive move occurs. In order to predict the direction of this move, a look at technical indicators is required.

Technical Indicators

The price of BCH on Coinbase is analyzed at two-hour intervals from Apr 15 to Apr 24 alongside the MACD and the 50- and 200-period moving averages (MA).
The moving average convergence divergence (MACD) is a trend indicator that shows the relationship between two moving averages (long and short-term) and the price. It is used to measure the strength of a move.
Moving averages are tools used in technical analysis to smooth out price action. It is a lagging indicator since it is based on past prices. The relationship between short and long-term moving averages can help in identifying the beginning and end of a trend.
These are shown in the graph below:
Moving Averages
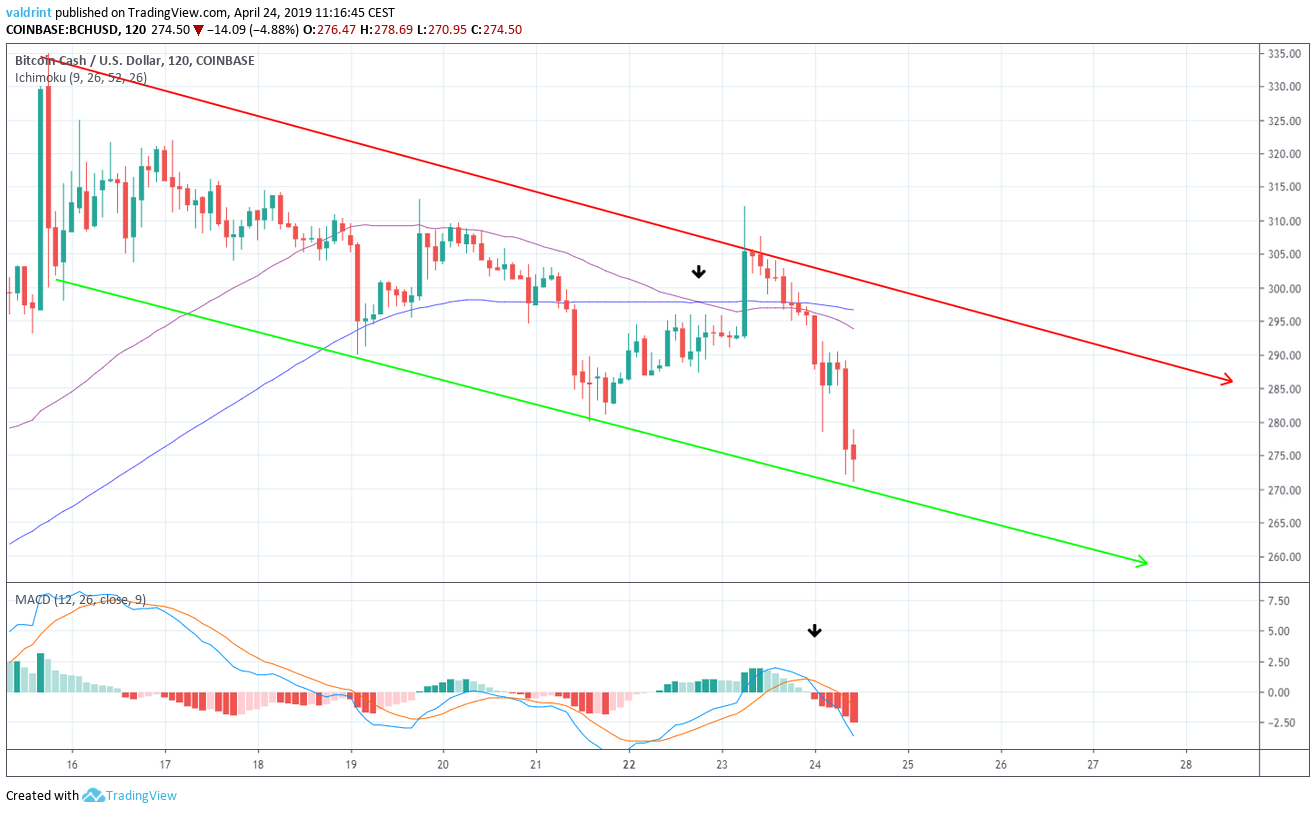
On Apr 22, the 50-period MA crossed below the 200-period one. This may indicate that a downtrend is about to begin. Furthermore, the MACD line crossed below 0 the next day. This supports the hypothesis that a downtrend is about to begin. The use of these indicators suggests that the price will decrease at the rate predicted by the channel. It is not sufficient in predicting a breakdown. 

Future Movement

To determine future price levels, we will look at possible support areas.
Support areas are created when the price revisits the same level several times. They can provide reversal areas in case a breakout/breakdown occurs.
One support area is shown for BCH/USD and BCH/EUR in the graphs below:
Support Areas
BCH/USD
Support Areas
BCH/EUR
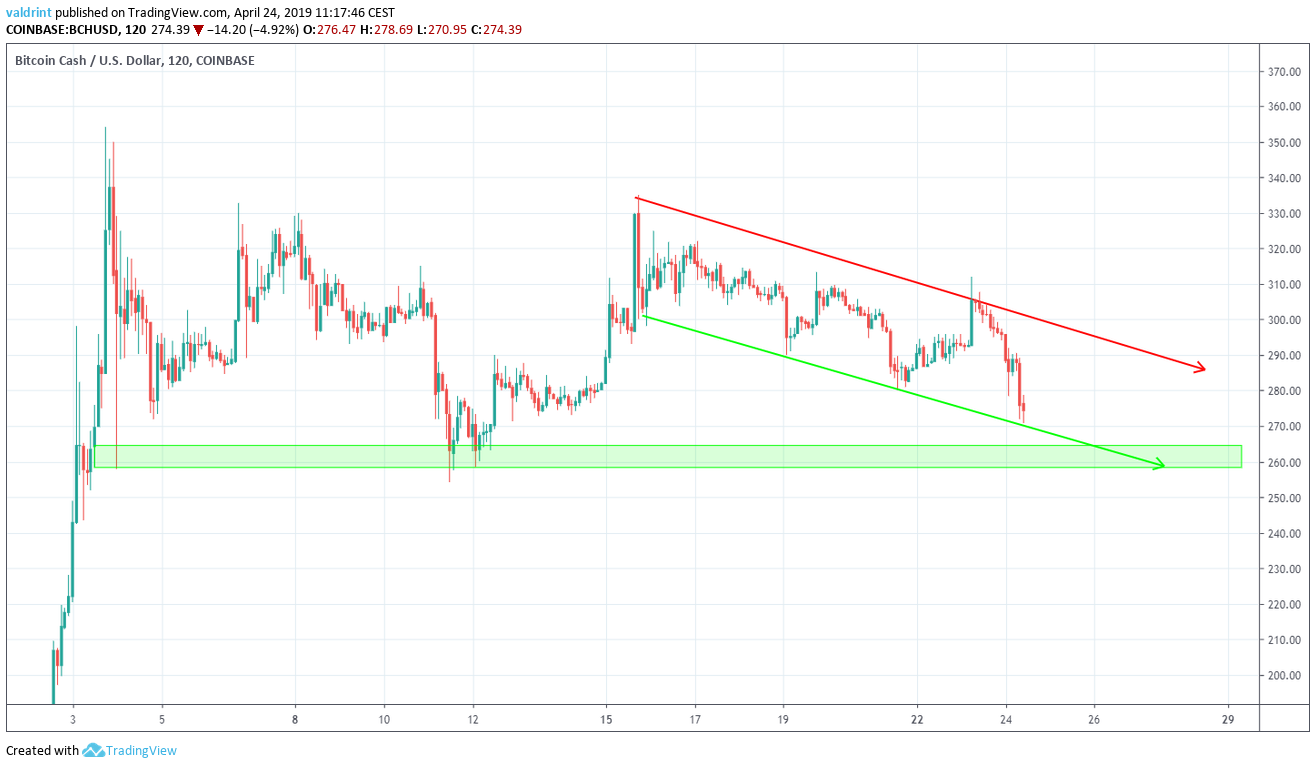
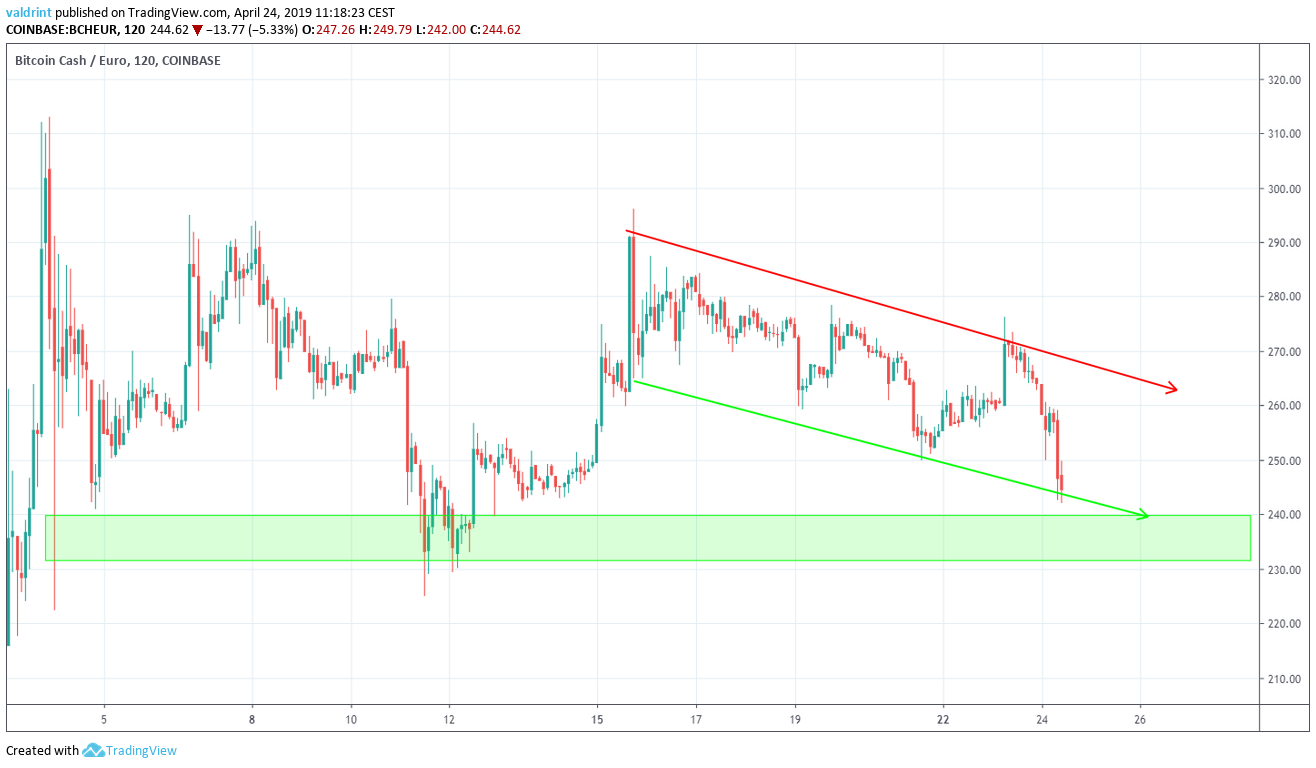
The closest support area is found near $260 and €235. If the price keeps decreasing at the rate predicted by the channel, it is likely to reach these areas.

Summary of Analysis

The price of BCH is likely to keep decreasing at the rate predicted by the descending channel. We believe that it will eventually reach the support area outlined above. Low around $260/€235 may be reached in the short-term. Do you think Bitcoin Cash will break down from the channel? Let us know your thoughts in the comments below. To read our 2019 and 2020 price predictions for Bitcoin Cash, click on the green button below: Disclaimer: This article is not trading advice and should not be construed as such. Always consult a trained financial professional before investing in cryptocurrencies, as the market is particularly volatile.
Top crypto projects in the US | April 2024

Trusted

Disclaimer

In line with the Trust Project guidelines, this price analysis article is for informational purposes only and should not be considered financial or investment advice. BeInCrypto is committed to accurate, unbiased reporting, but market conditions are subject to change without notice. Always conduct your own research and consult with a professional before making any financial decisions. Please note that our Terms and ConditionsPrivacy Policy, and Disclaimers have been updated.

Valdrin-Tahiri.jpg
Valdrin Tahiri
Valdrin discovered cryptocurrencies while he was getting his MSc in Financial Markets from the Barcelona School of Economics. Shortly after graduating, he began writing for several different cryptocurrency related websites as a freelancer before eventually taking on the role of BeInCrypto's Senior Analyst. (I do not have a discord and will not contact you first there. Beware of scammers)
READ FULL BIO
Sponsored
Sponsored