


The Dogecoin price (DOGE) and Basic Attention Token price (BAT) have experienced significant decreases throughout the month of May.
Dogecoin began an upward move at the end of the month. Will this continue in June? Meanwhile, BAT has yet to begin another move. When will it do so?
In order to answer these questions, we analyze the current short and medium-term movements of DOGE/BTC and BAT/BTC alongside an assessment of their technical indicators. In conclusion, we summarize our findings and compare both cryptocurrencies to see which has more potential for higher prices in the future.
Triangle for Dogecoin Price (DOGE)
On May 6, the DOGE price reached a high of 45 satoshis. A rapid decrease began, which ended on May 13 with a low of 35 satoshis.
Since then, the price has been trading inside the symmetrical triangle outlined below:
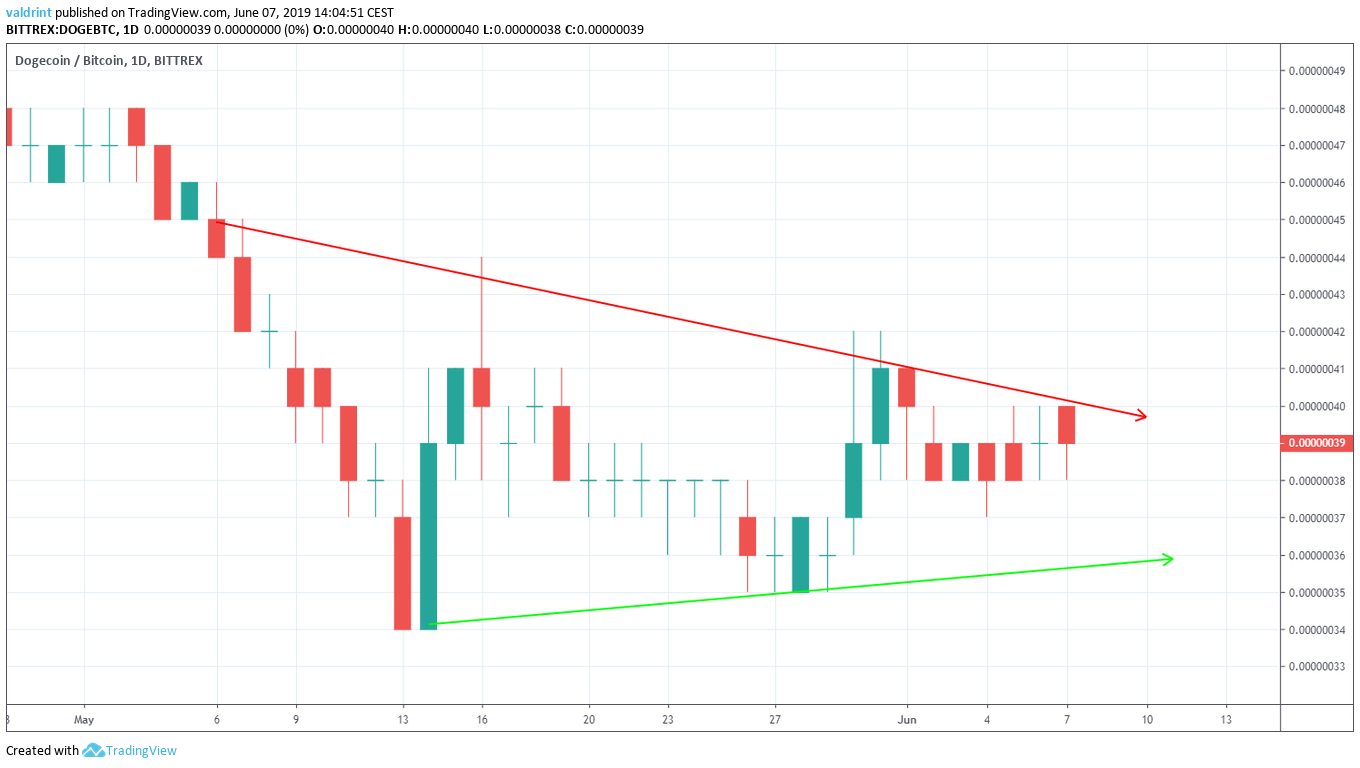
At the time of writing, it was trading very close to the resistance line of the channel, after touching it for the fourth time.
Will the price break out from this triangle?
In order to answer that, we will analyze the price alongside the MACD and the 10- and 20-day moving averages (MA) below:
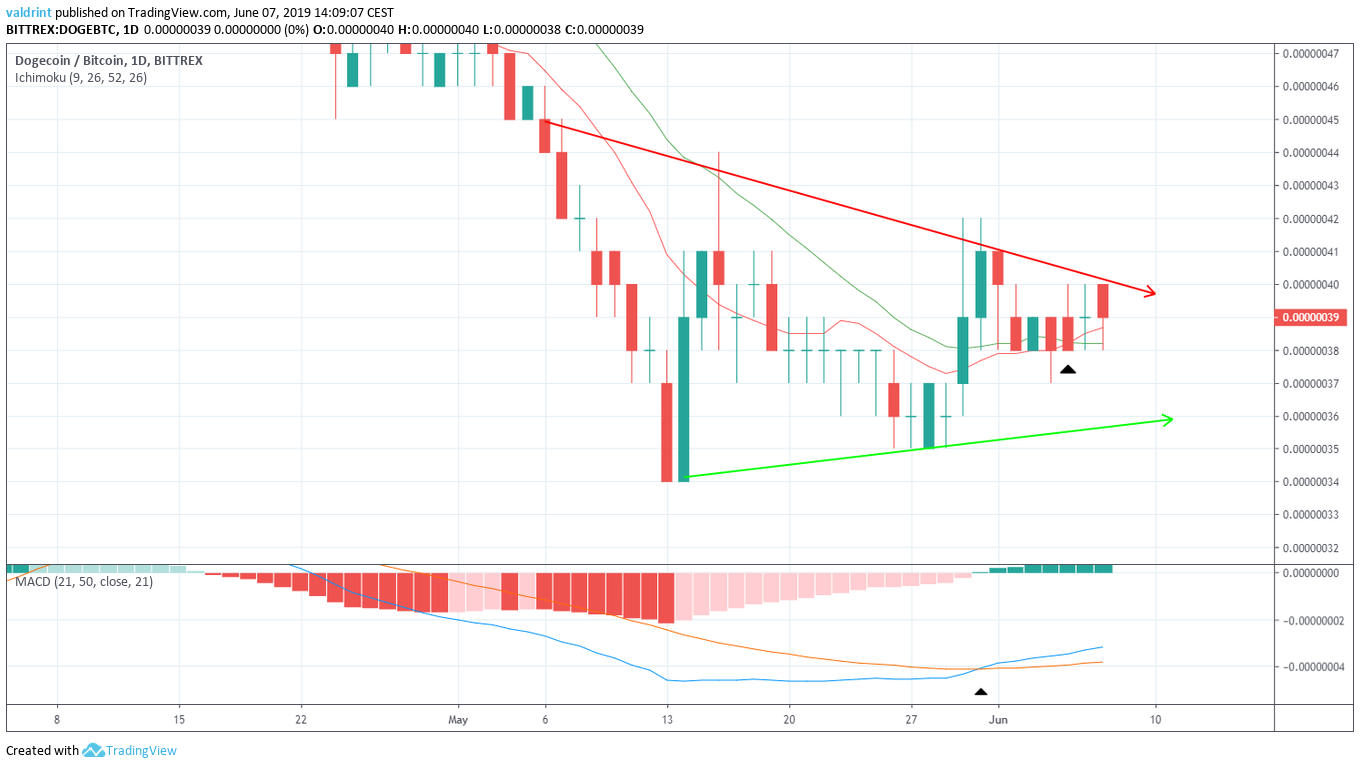
The price is trading above the 10- and 20-day MAs. Furthermore, a bullish cross between them occurred on June 4. This often indicates that an uptrend has begun.
Additionally, the MACD made a bullish cross on May 30.
The use of these indicators suggests that it is likely that the Dogecoin price (DOGE) will break out from the triangle.
If that occurs, where will the price find resistance?
Dogecoin Reversal Areas
In the case of a breakout, resistance areas can provide a reversal.
One resistance area is traced for DOGE below:
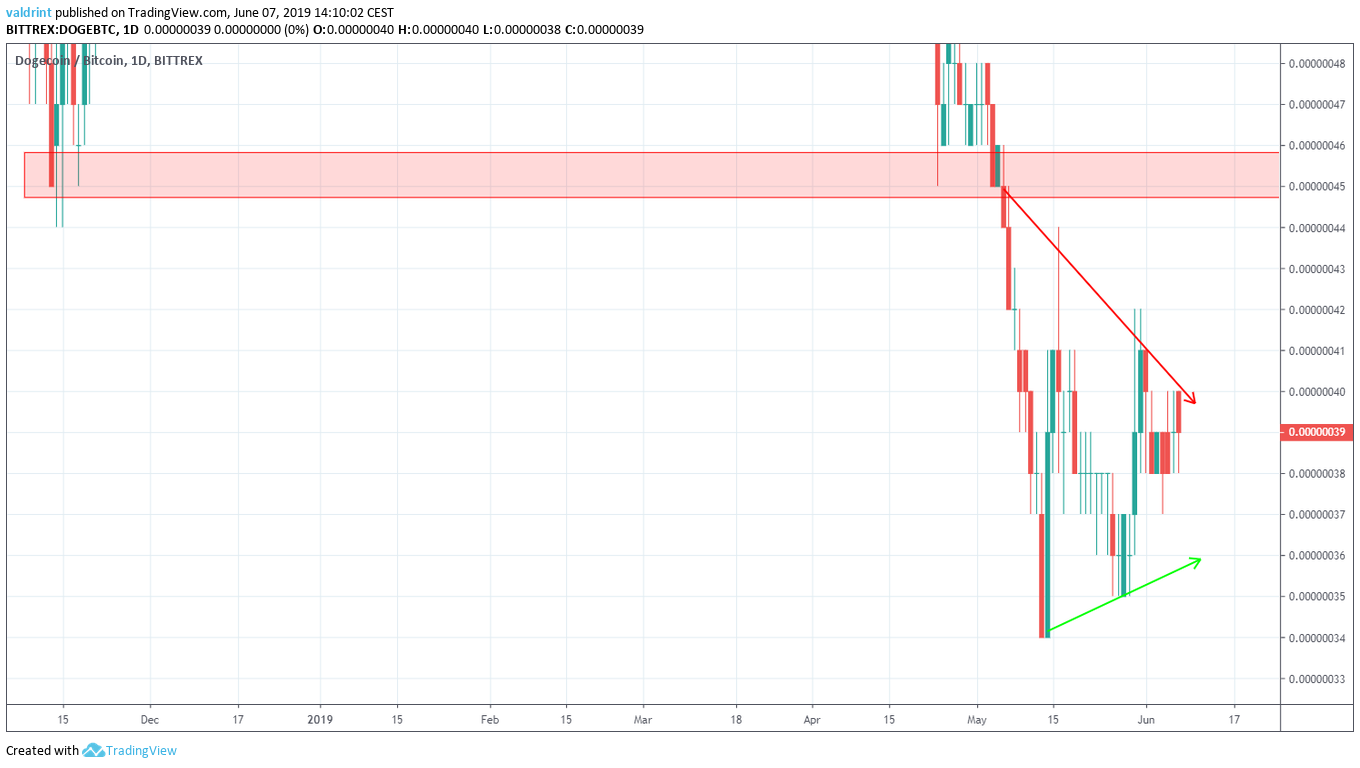
The closest resistance area is found near 46 satoshis. If the price breaks out from the triangle, it is likely to provide a reversal. We believe this to be likely.
However, the price has been trading inside the triangle for more than a month. Furthermore, its increases and decrease have been slow.
Therefore, it is possible that it will take some time for the Dogecoin price (DOGE) to reach this area.
BAT Price Inside a Descending Wedge
On May 10, the price of BAT reached a low of 4438 satoshis. A rapid upward move began and the BAT price reached a high of 6010 satoshis the next day.
It has been decreasing since, trading inside the descending wedge outlined below:
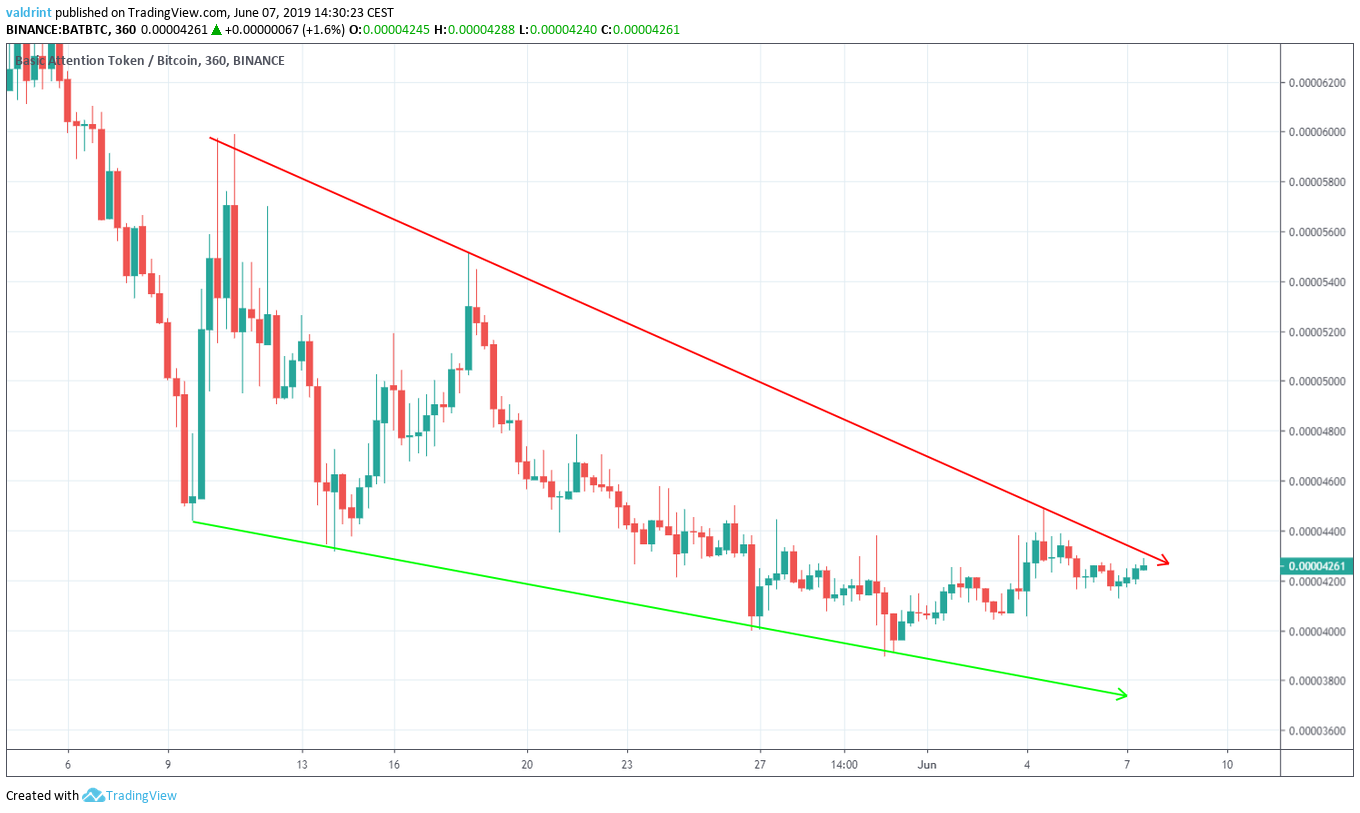
At the time of writing, BAT was trading very close to the resistance line of the wedge.
Additionally, it is approaching the end of the pattern. Finally, the descending wedge is a bullish pattern.
Will the price break out?
In order to determine that, BAT is analyzed alongside the RSI and the 10- and 20-day moving averages (MA) below:
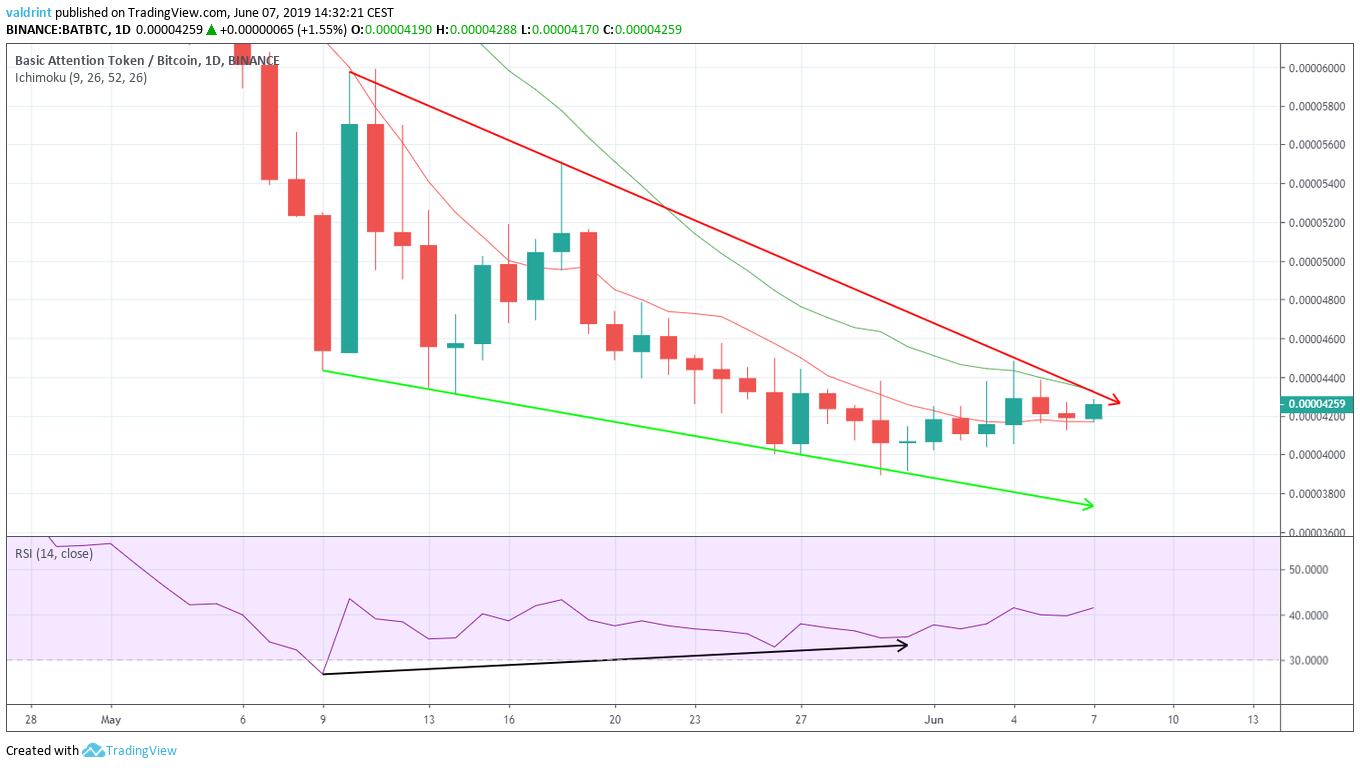
During this time, the RSI and the MACD have generated successively higher values.
This is known as bullish divergence and often precedes price increases.
Furthermore, the price has found support above the 10-day MA but it is still trading below the 20-day one.
If a bullish cross were to occur, it would add support to the possibility that the price breaks out.
If it does, where will it meet resistance?
BAT Reversal Areas
In the case of a breakout, resistance areas can provide likely areas of reversal.
One resistance area is traced for the BAT price below:
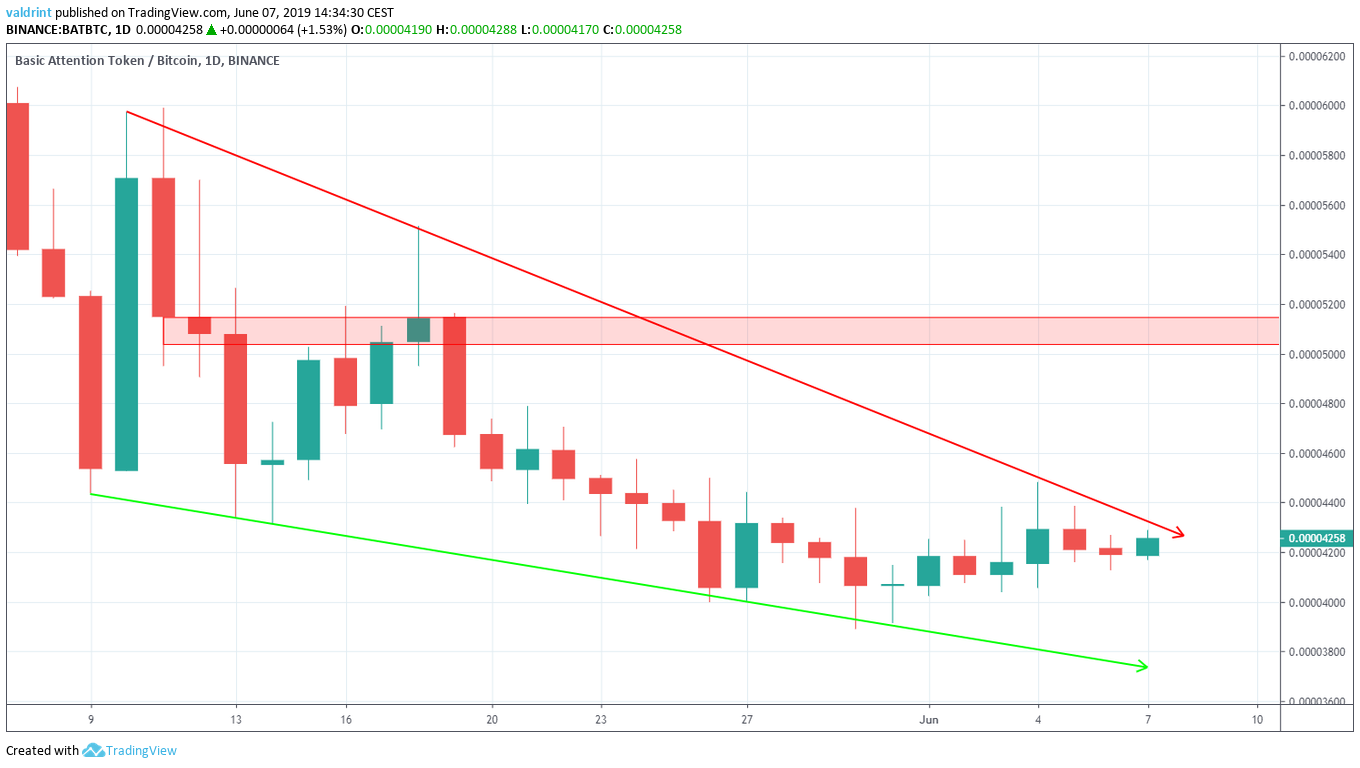
The closest resistance area is found near 5100 satoshis. If the BAT price breaks out from the wedge, it is likely to reach this area. We believe that this is likely to occur.
Summary
To conclude, Basic Attention Token (BAT) is trading inside a bullish pattern while Dogecoin (DOGE) is in a neutral one.
BAT has created significant bullish divergence since the beginning of its wedge. However, the moving averages have yet to make a bullish cross.
In the case of Dogecoin, bullish crosses have occurred both in the MACD and between the moving averages.
Finally, BAT is very close to the end of the pattern, while the Dogecoin price is not. Combined with the fact that the latter has been moving very slowly, we believe that the BAT price has the potential for higher increases, especially in the short-term.
A summary of our findings is presented in the table below:
| DOGE | BAT | Winner | |
| Trading Pattern | Symmetrical Triangle | Descending Wedge | BAT |
| Technical Indicators | Bullish Cross between MAs and the MACD | Bullish Divergence in the RSI and the MACD | Tie |
Do you think the price of Dogecoin will initiate a decisive move? Will BAT break out? Leave your thoughts in the comments below:
Disclaimer: This article is not trading advice and should not be construed as such. Always consult a trained financial professional before investing in cryptocurrencies, as the market is particularly volatile.


