


Band Protocol (BAND), Waves (WAVES), and Arweave (AR) have fallen by more than 90% since their all-time highs. The tempo of the drop is typical of a pump-and-dump scheme.
A pump and dump happens when the price of an asset is artificially increased through false recommendations. Afterward, large holders dump their holdings at inflated prices, leading to the subsequent decrease in price.
The chart of a pump and dump consists of a sharp growth in price followed by an even more violent drop that negates all the preceding increases.
Will BAND Price Break Out From Long-Term Pattern?
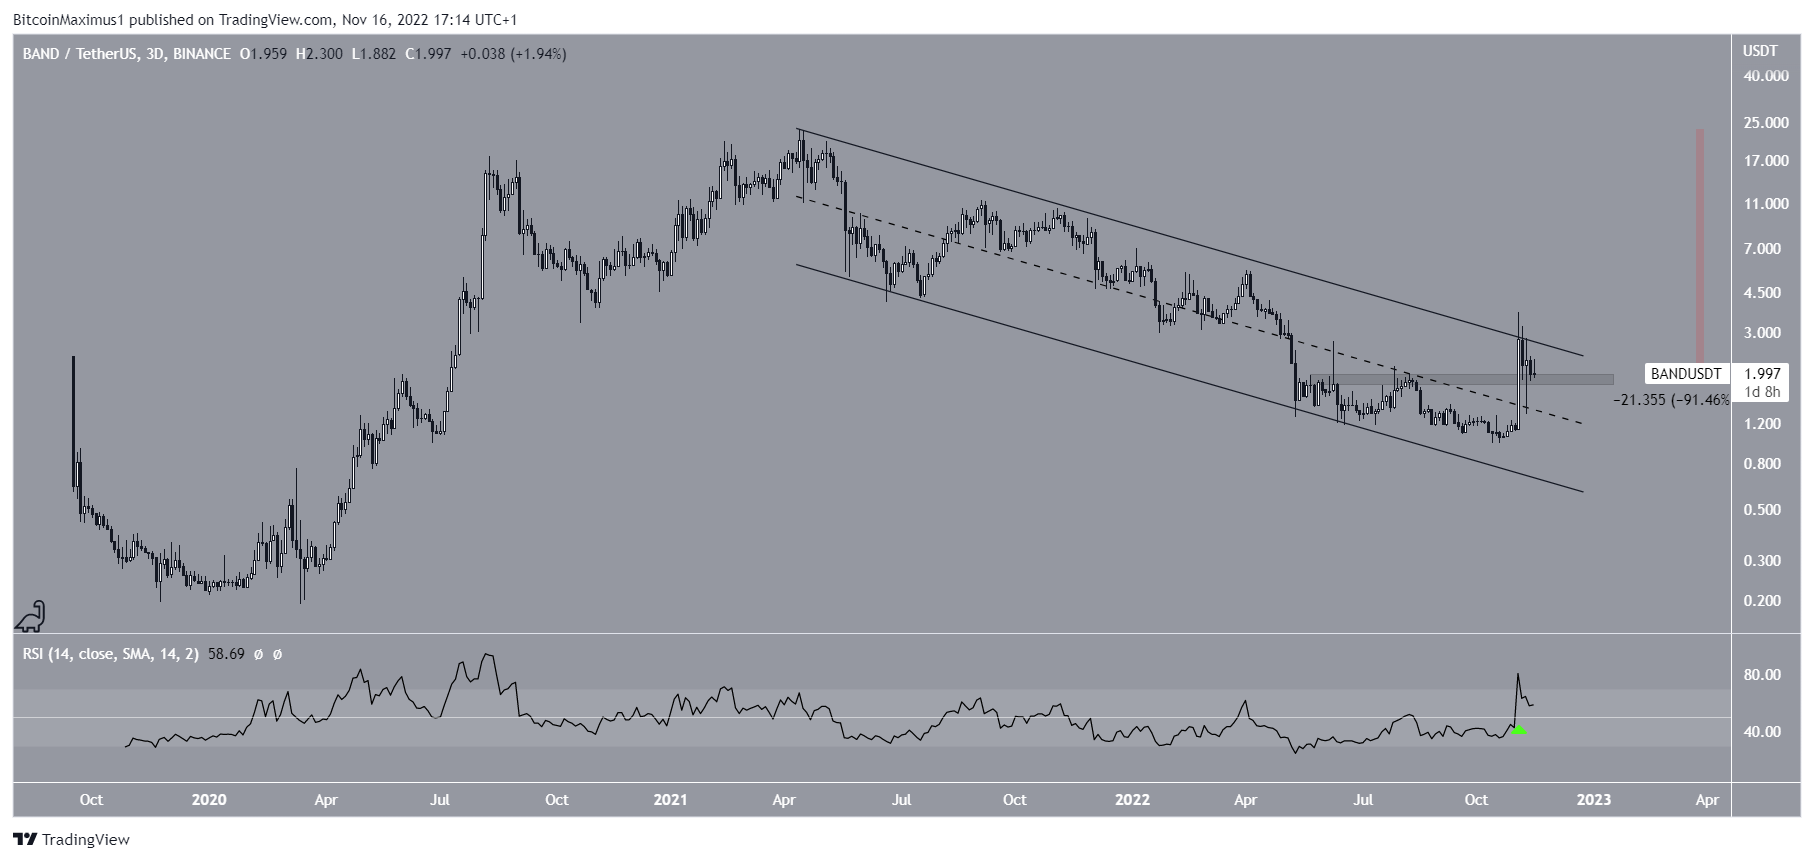
The BAND price has fallen inside a descending parallel channel since reaching an all-time high price of $23.30 in April 2021. The decrease led to a low of $1.08 in Oct., before a sharp bounce led to a high of $3.68.
Despite falling by more than 91%, the downward movement has been gradual and choppy. Additionally, the fact that it is contained inside a descending parallel channel suggests is corrective. Finally, the weekly RSI has moved above 50 (green icon). This indicates it is possible that the BAND price will break out.
However, in order to do so, it has to hold above the $1.82 horizontal support area. The BAND price reached the area after decreasing over the past 24 hours.
Out of the three altcoins outlined, BAND resembles a pump-and-dump scheme the least. The main reason for this is the gradual decrease after the all-time high.
Waves Risks Breakdown From Long-Term Support
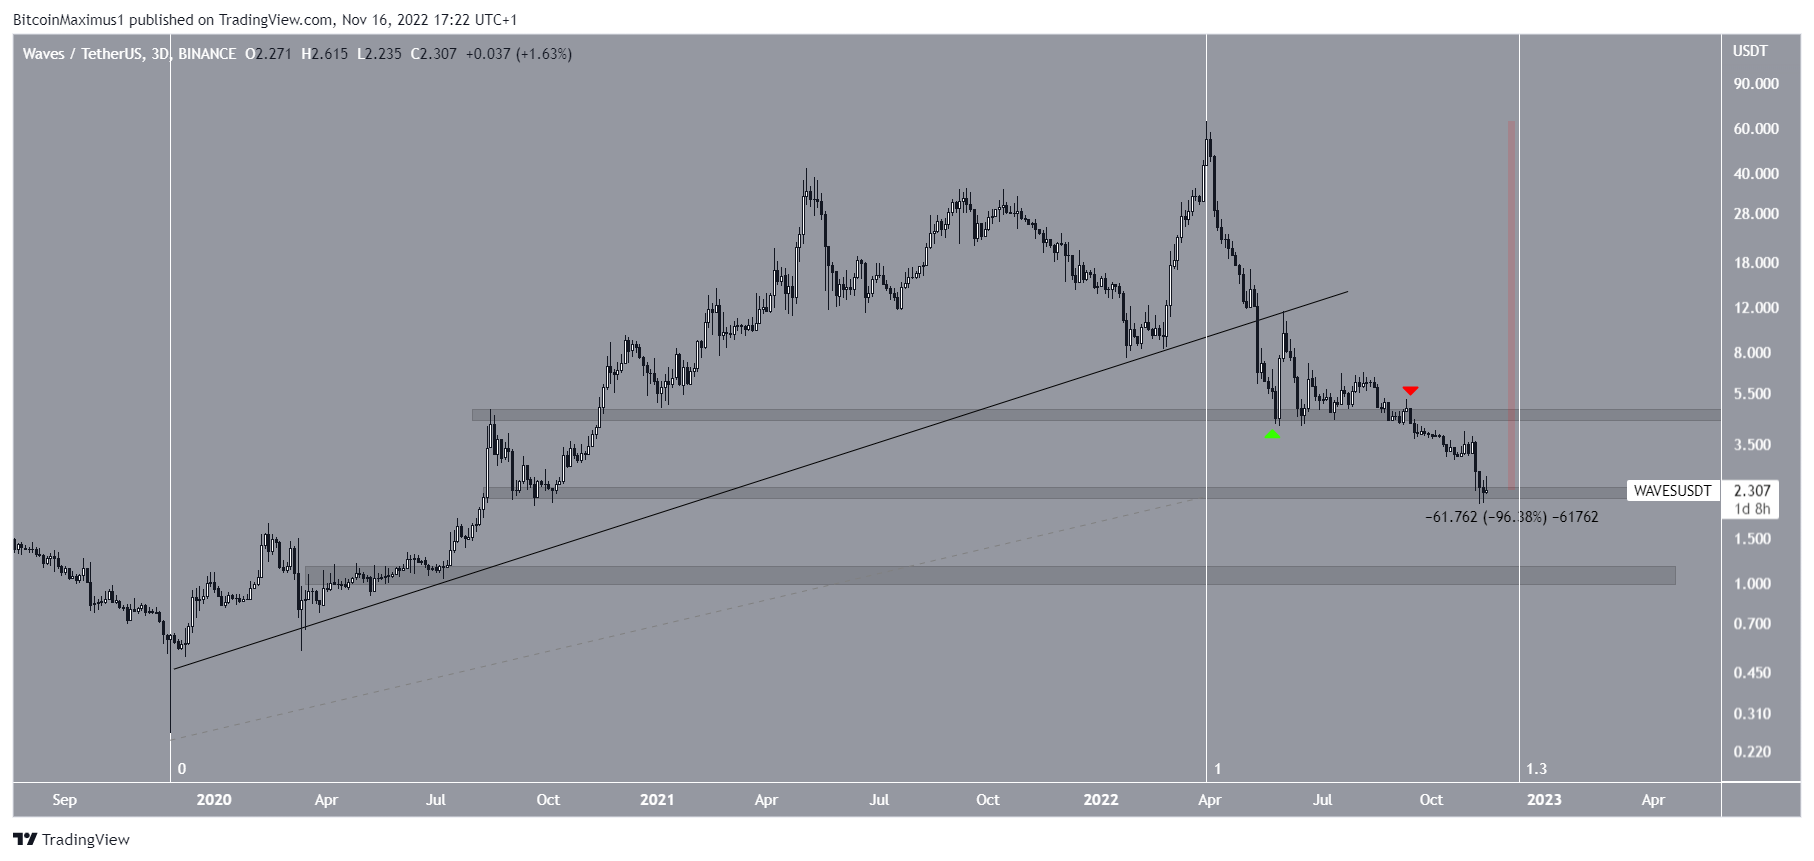
The WAVES token price has fallen since reaching an all-time high of $65.88 in March 2022. The decrease caused a breakdown from a long-term ascending support line and the $4.50 support area. The latter was afterward validated as resistance.
So far, the WAVES price has decreased by 96% relative to its all-time high. It is currently attempting to hold on above the $2.25 support area, but shows no bullish signs.
The ongoing decrease has taken less than a third of the time it took for the WAVES price to reach an all-time high, something more similar to a pump-and-dump scheme than the price movement of BAND.
A breakdown from the $2.25 support area could cause a fall toward $1.
Arweave Price Approaches Make-or-Break Level
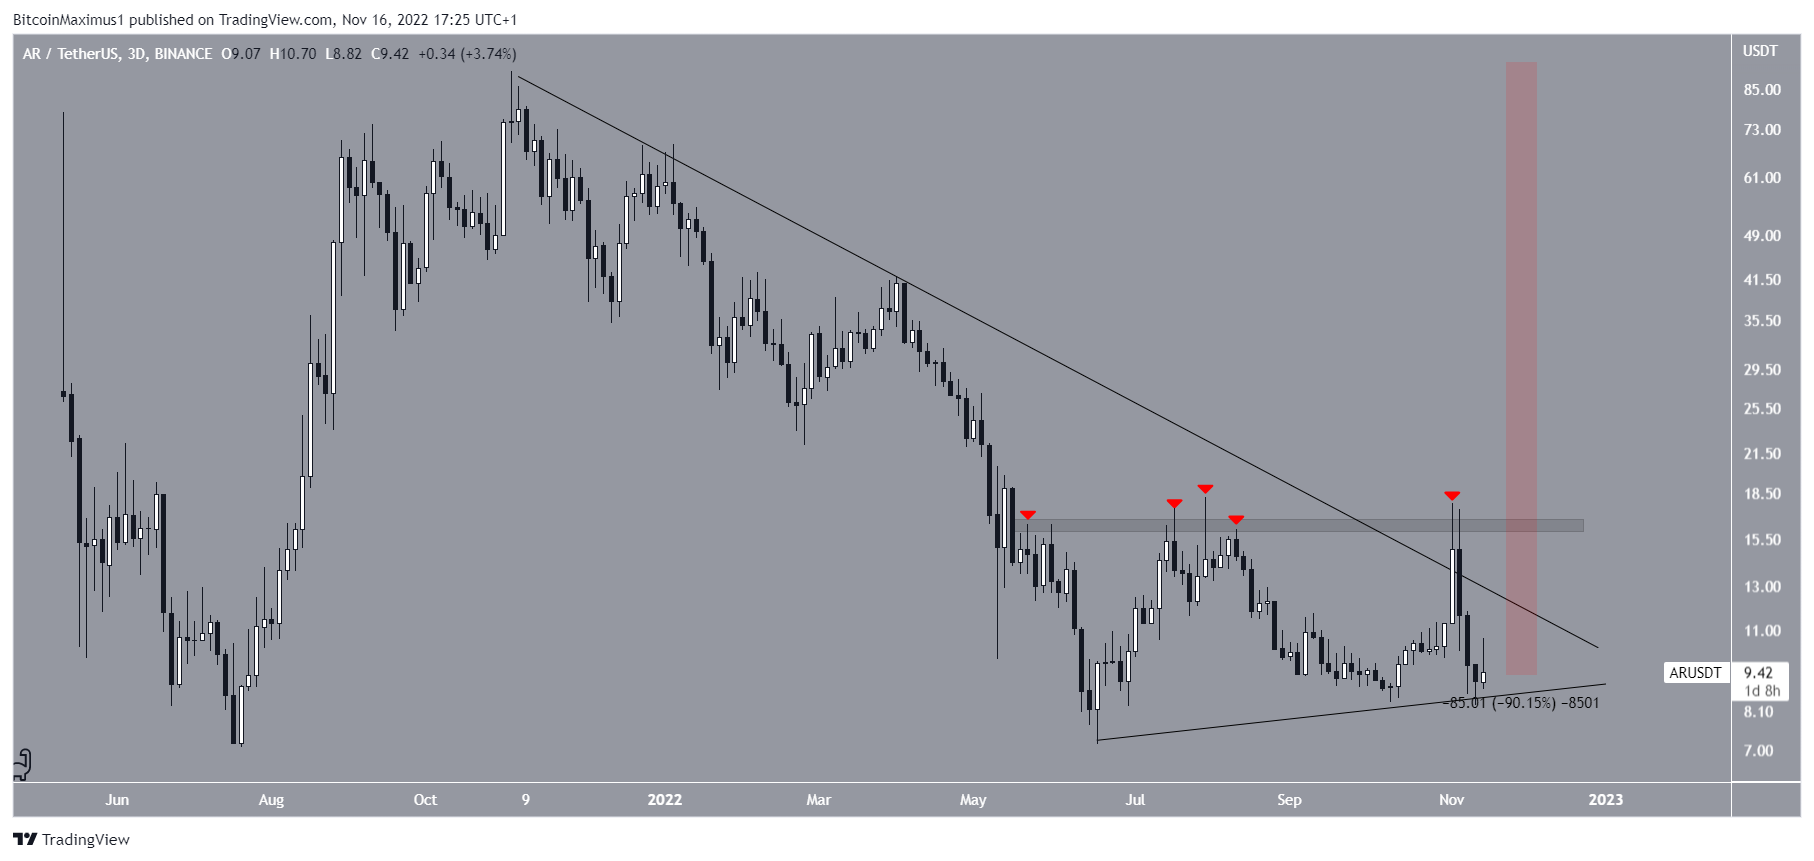
The AR tokens price has fallen underneath a descending resistance line since reaching an all-time high of $91.08 in Nov. 2021. So far, the price has decreased by 90%.
The downward movement led to a low of $7.17 in June 2022. The AR price has been moving upwards since.
It followed an ascending support line throughout this period and made four unsuccessful attempts (red icons) at breaking out from the $16.50 resistance area.
Currently, the AR price is trading close to its support line. Whether it breaks down from the support line or breaks out from the long-term resistance line instead will determine the direction of the future price movement.
For BeInCrypto’s latest Bitcoin (BTC) analysis, click here.
Disclaimer: BeInCrypto strives to provide accurate and up-to-date information, but it will not be responsible for any missing facts or inaccurate information. You comply and understand that you should use any of this information at your own risk. Cryptocurrencies are highly volatile financial assets, so research and make your own financial decisions.


