


Avalanche (AVAX) is holding on above the previous all-time high, but has not shown any signs that it will sustain its upward movement.
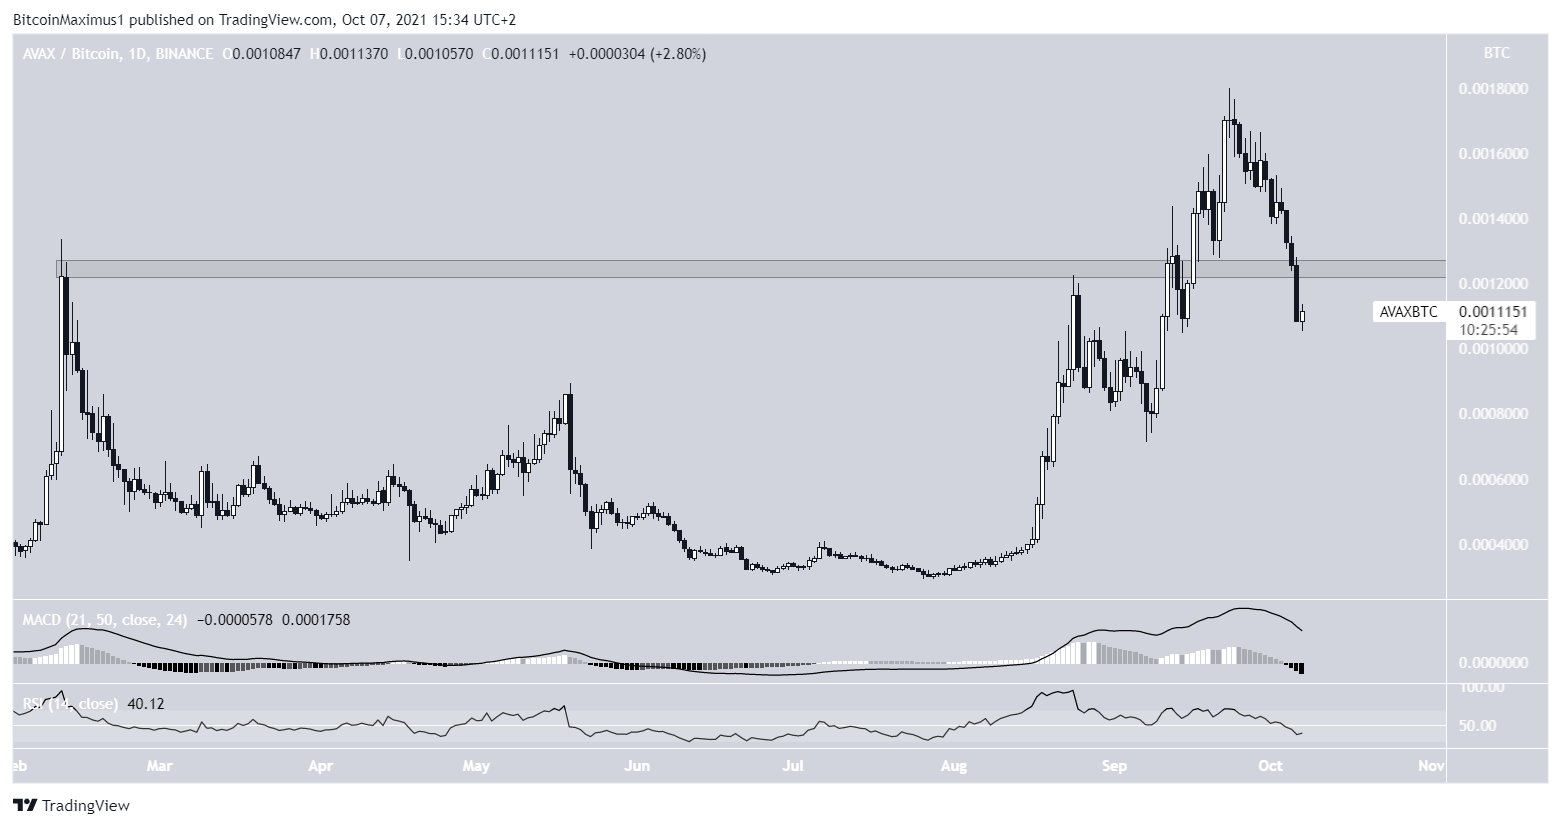
The AVAX/BTC pair looks considerably more bearish than the USD one, since both the price action and technical readings provide a bearish outlook.
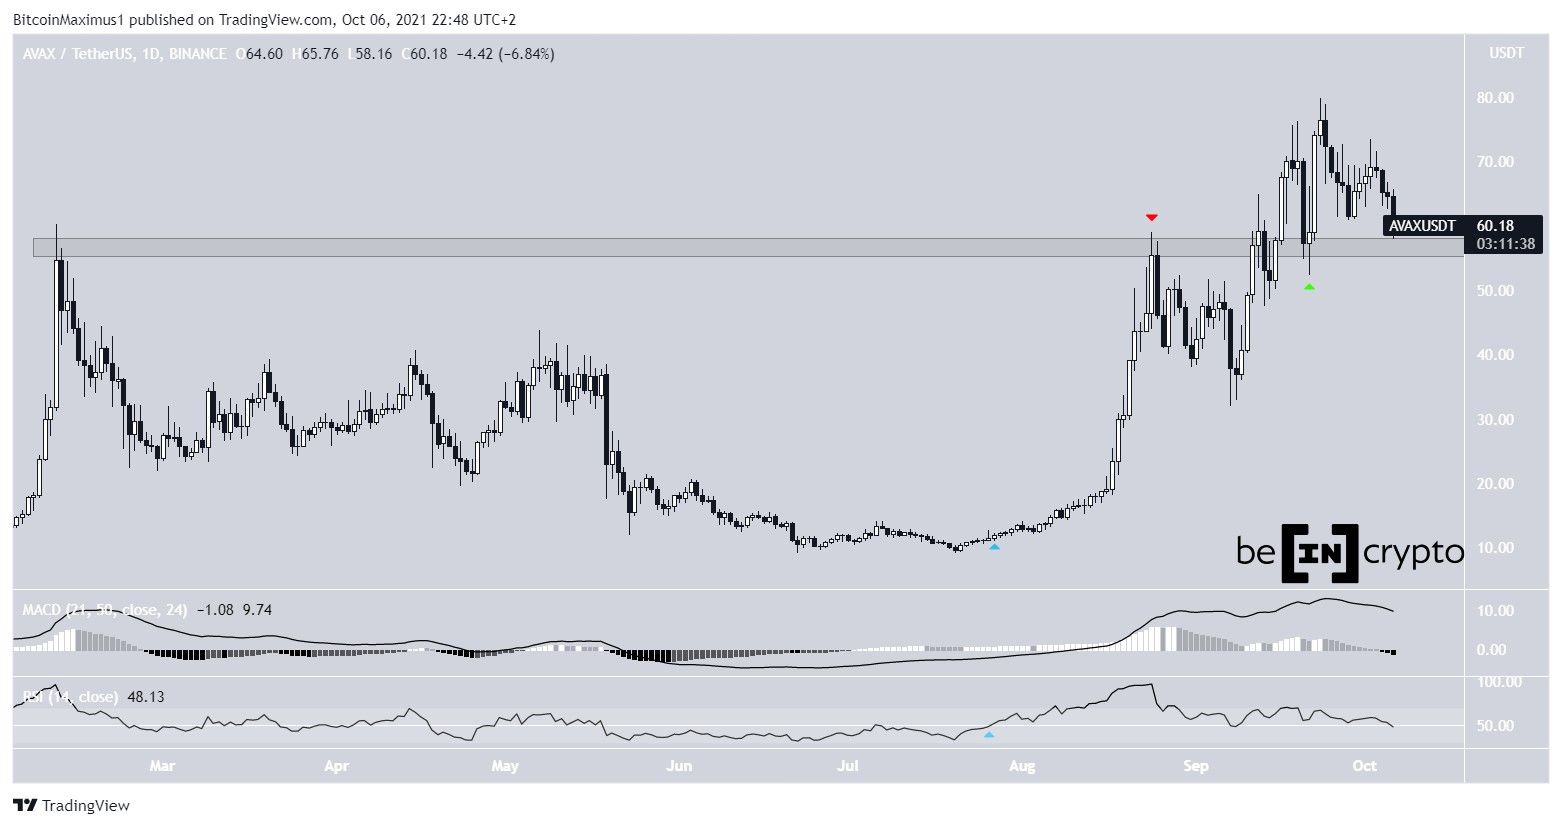
AVAX drops after all-time high
AVAX has been moving downwards since Sept 23, when it reached an all-time high price of $79.80.
Despite the drop, it is still trading above the $57 area. This area is crucial, since it was the previous all-time high in Feb and then acted as resistance in Aug (red icon). Afterwards, once the token broke out, it validated it as support on Sept 21 (green icon) before reaching the aforementioned all-time high. So, if it returns to this area, a bounce would be likely.
However, technical indicators are not in agreement with the price action.
The MACD, which is created by a combination of short- and long-term moving averages (MA), is falling. Furthermore, its histogram is negative. This means that the rate of increase of the short-term trend has fallen below that of the long-term one.
The RSI, which is a momentum indicator, is decreasing and is at risk of falling below 50. Previously, the RSI cross above 50 on July 26 (blue icon) preceded the entire upward movement. It remains to be seen if the cross below 50 will do the same in the opposite direction.
Future movement
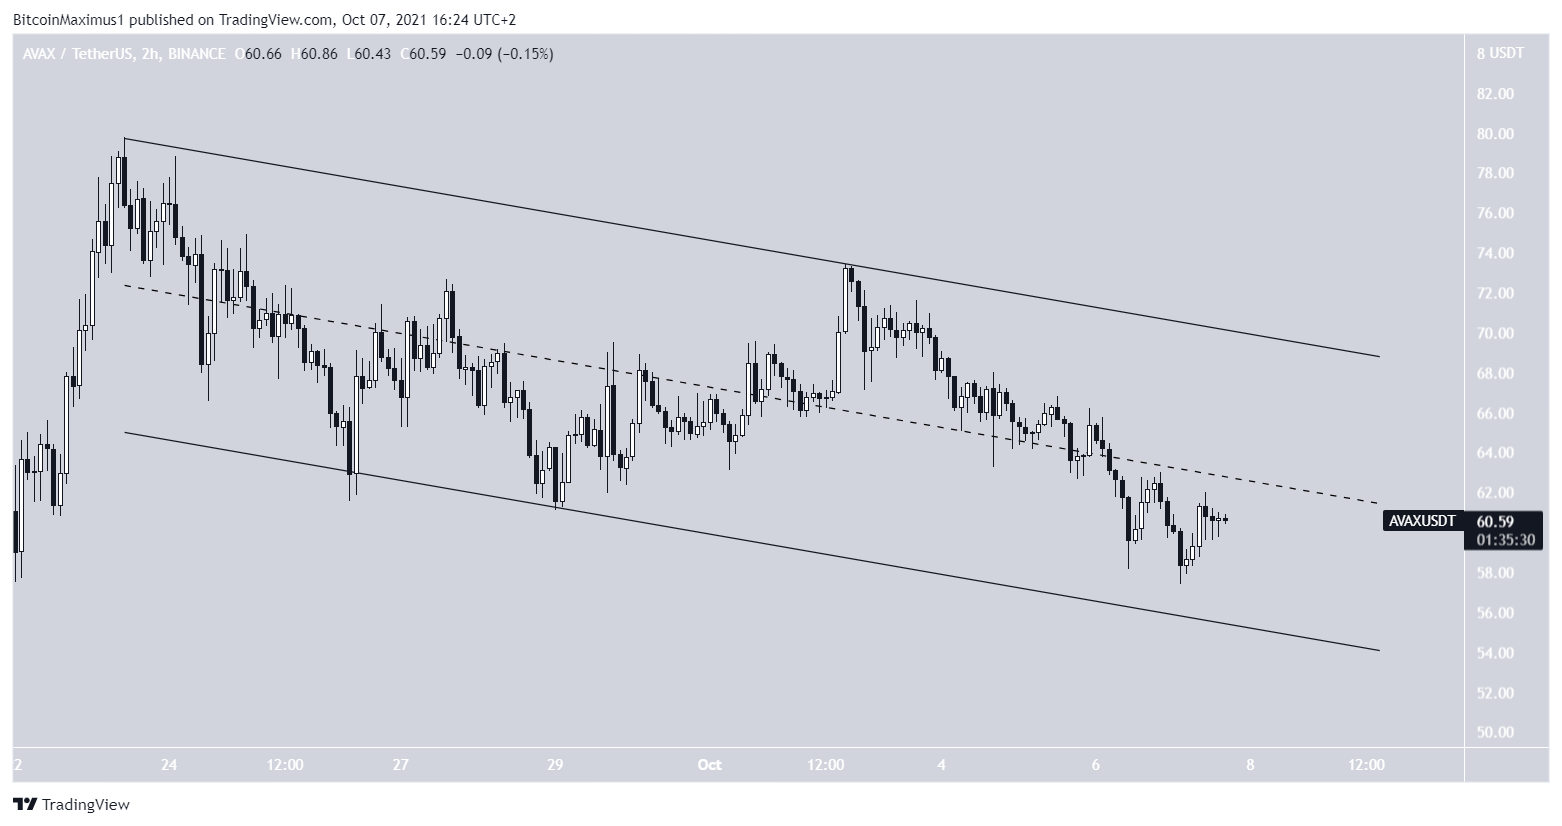
The shorter-term six-hour chart shows that since the aforementioned all-time high, AVAX has been trading inside a descending parallel channels.
Such channels usually contain corrective movements. This would mean that the downward movement is a correction, and the upward movement will follow after the correction is complete.
However, due to the bearish readings from the daily time-frame, the trend cannot be considered bullish, at least until AVAX breaks out from the channel.
AVAX/BTC
Cryptocurrency trader @BobLoukas outlined an AVAX/BTC chart, stating that the pair is showing considerable strength.
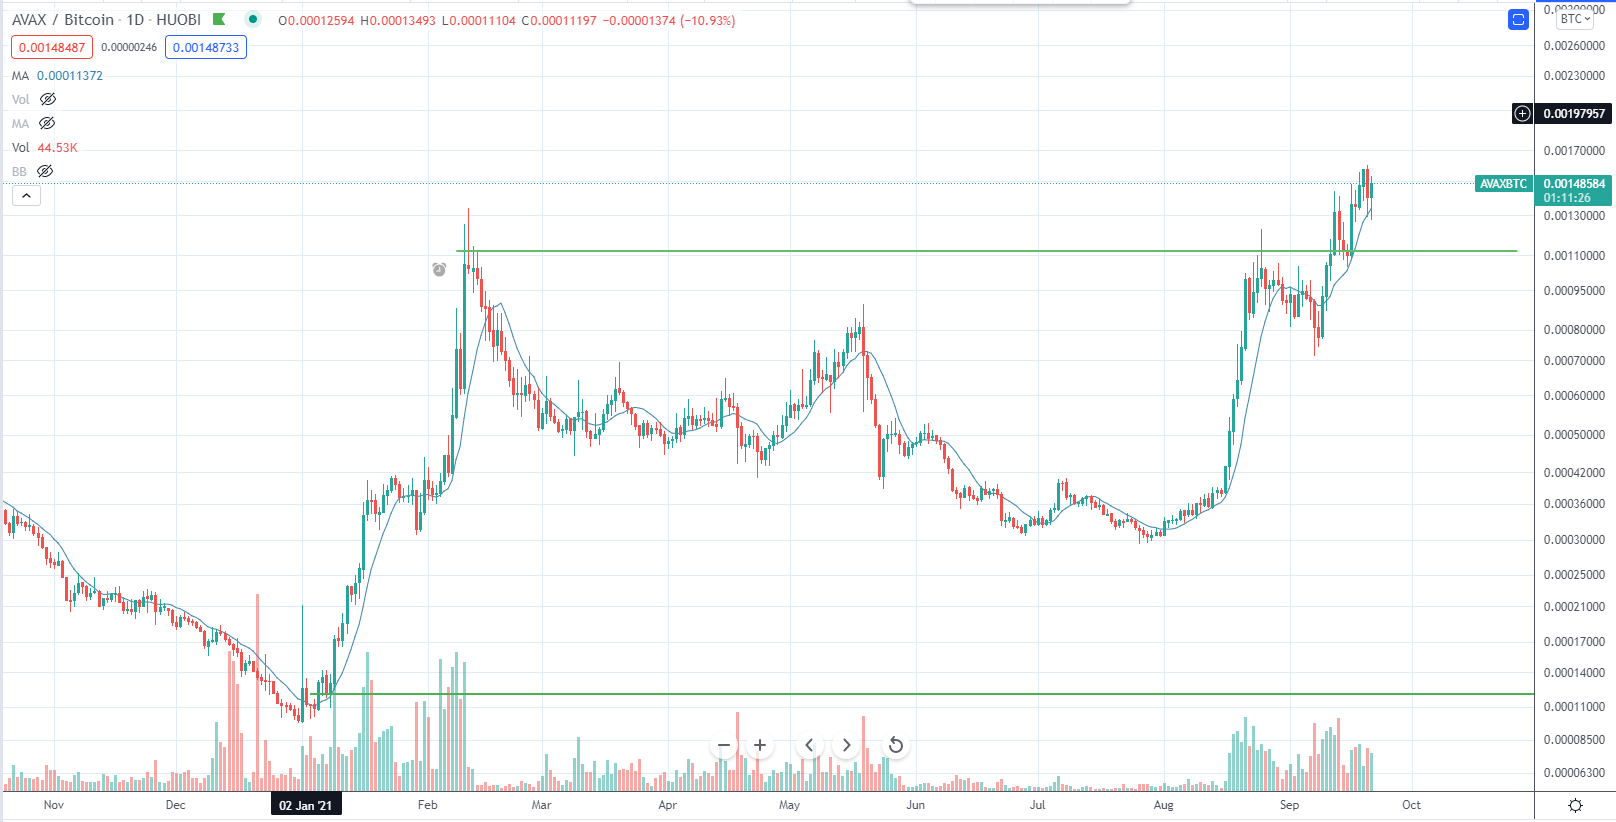
However, since the tweet, the token has fallen considerably.
Most importantly, it has decreased below the ₿0.00125 level. This is important since the level was the previous all-time high.
Therefore, the inability to stay above this area means that the upward movement could not be sustained, and the increase might have only been a fake-out.
Furthermore, the MACD and RSI both provide a bearish reading identical to that of the USD pair.
For BeInCrypto’s latest Bitcoin (BTC) analysis, click here.
What do you think about this subject? Write to us and tell us!


