


The Cosmos (ATOM) price has created a reversal pattern at the support area of 49,000 satoshis. From this level, the price is expected to continue moving upwards.
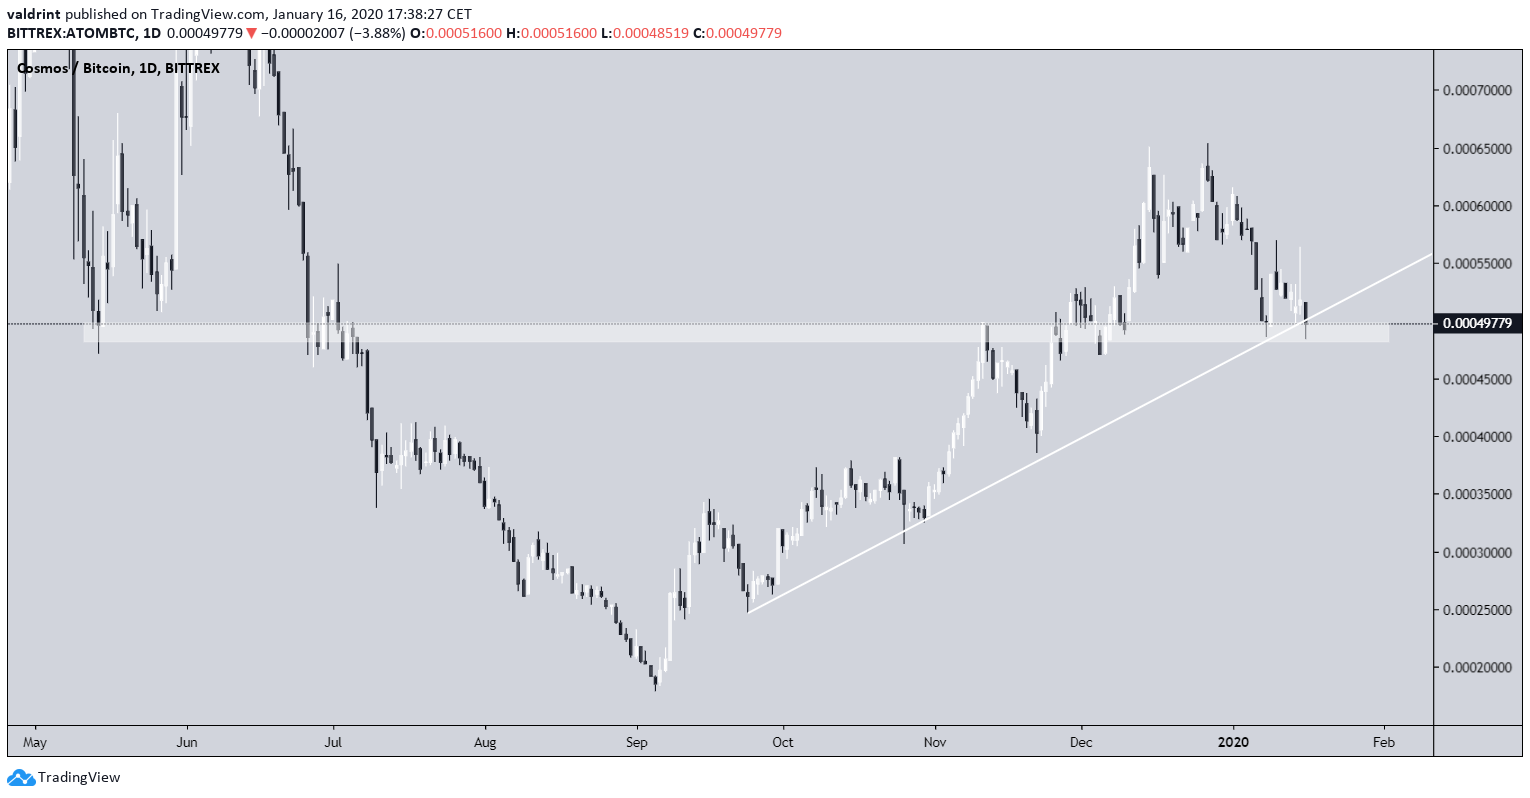
Besides the reversal pattern (double bottom), the upward movement is supported by the ascending support line, which has been measuring ATOM’s rate of increase since October. Further increases at this rate would cause ATOM to break out above the 64,000 satoshi resistance area by the end of next month.
Well-known investor and trader Posty stated that the ATOM price chart reveals that the current price level could be suitable for the initiation of a long trade. However, he did not post specific targets for future price movement.
Probably not a bad area to punt a long tbh pic.twitter.com/FEGfA4tvoC
— Posty (@PostyXBT) January 16, 2020
ATOM Strong Support
The support area outlined in the tweet is found at 49,000 satoshis. It has intermittently acted as resistance and support since May 2019.
Besides this support area, the price has also been following an ascending support line since October 2019. The current price is at the convergence of the ascending support line and the aforementioned support area.
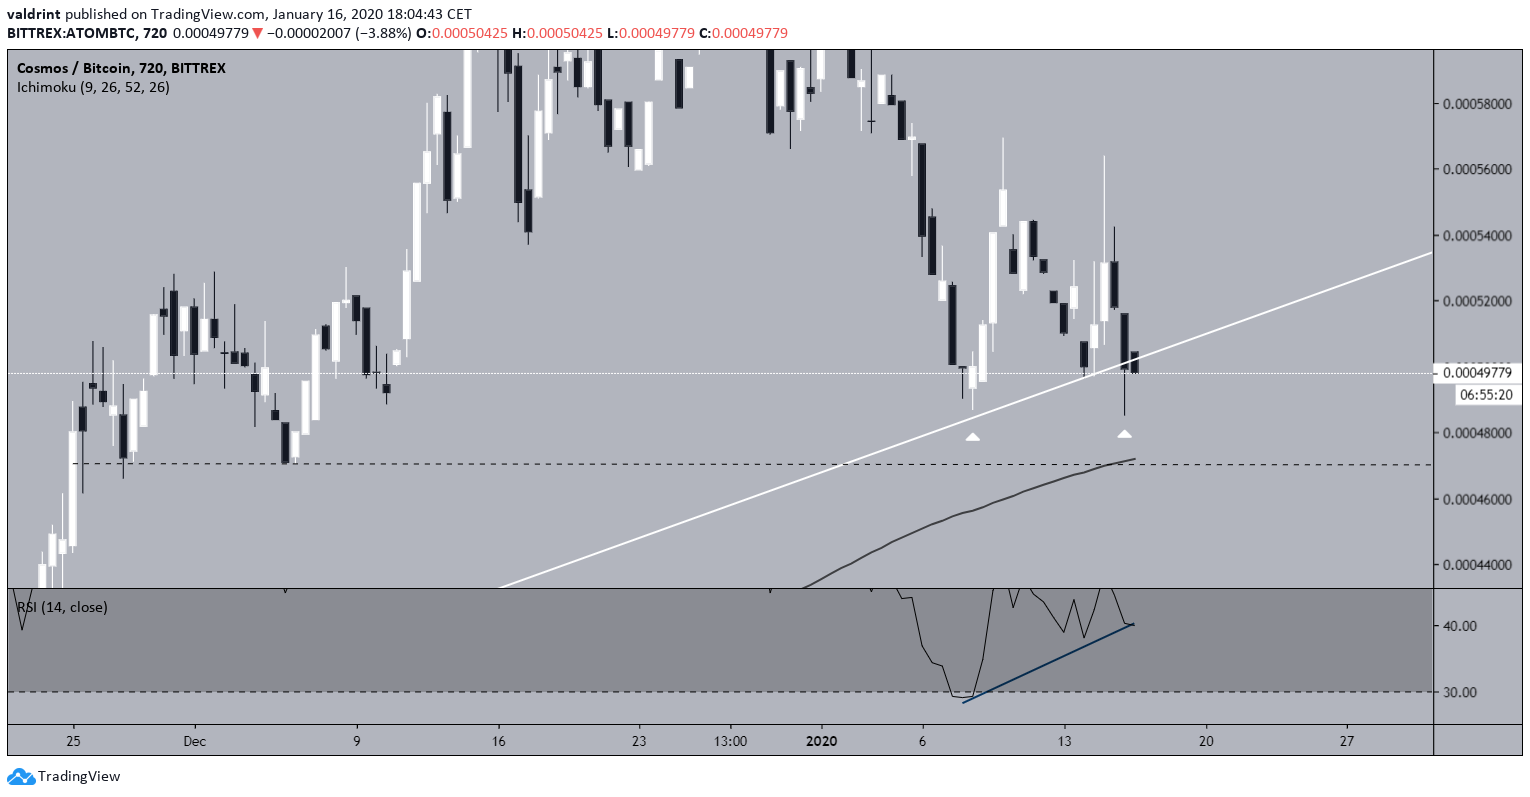
The price movement inside the support area resembles a double bottom pattern and is combined with lower wicks that are relatively short.
While the current 12-hour candlestick is slightly below the ascending support line, it would not be surprising if it rallied to close above, creating a long lower wick in the process. In addition, the double bottom is supported by bullish divergence in the RSI.
In a case where the price reverses, the proximity to the support line and a significant support level will allow for exiting the trade without experiencing significant losses. The placement of a stop loss below 47,000 satoshis would represent a decrease of around 6% from the current price level. This level is expected to provide support since it also coincides with the 100-day moving average (MA).
Future Movement
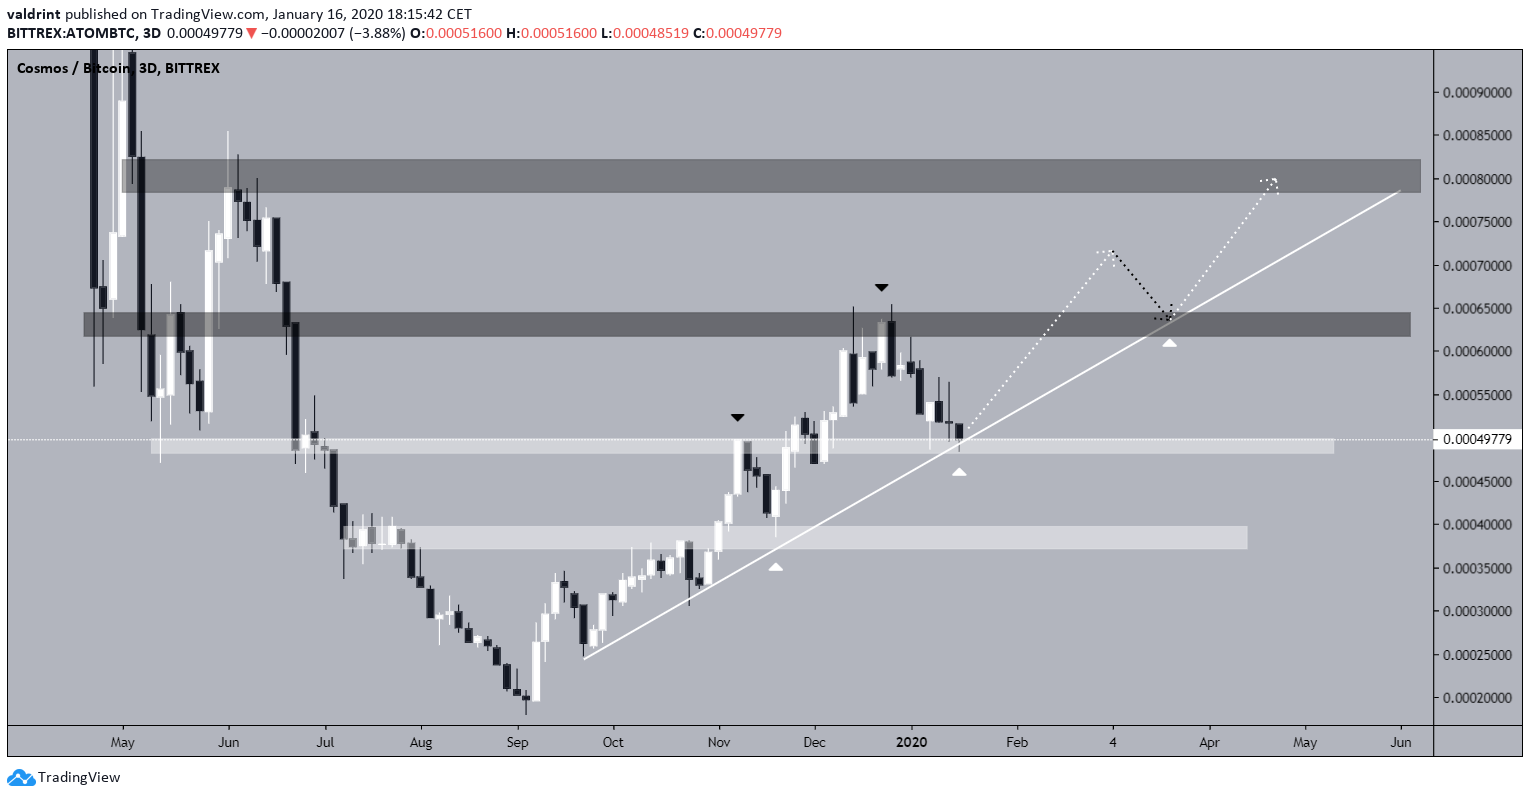
Since the upward movement began in September 2019, the price has followed a simple pattern. It breaks out above the first overhead resistance, reaches the next resistance area then decreases to validate the first one as support. In addition, the retest happens at the convergence with the ascending support line.
If the same pattern repeats, ATOM will move above the 64,000 resistance area before validating it as support, possibly in the beginning of April. Afterward, it is expected to continue towards the next resistance area at 80,000 satoshis.
To conclude, the ATOM price has reached a significant support area and the ascending support line in place since October. It is likely the price will bounce upwards from this level and target the overhead resistance at 64,000 satoshis.


