


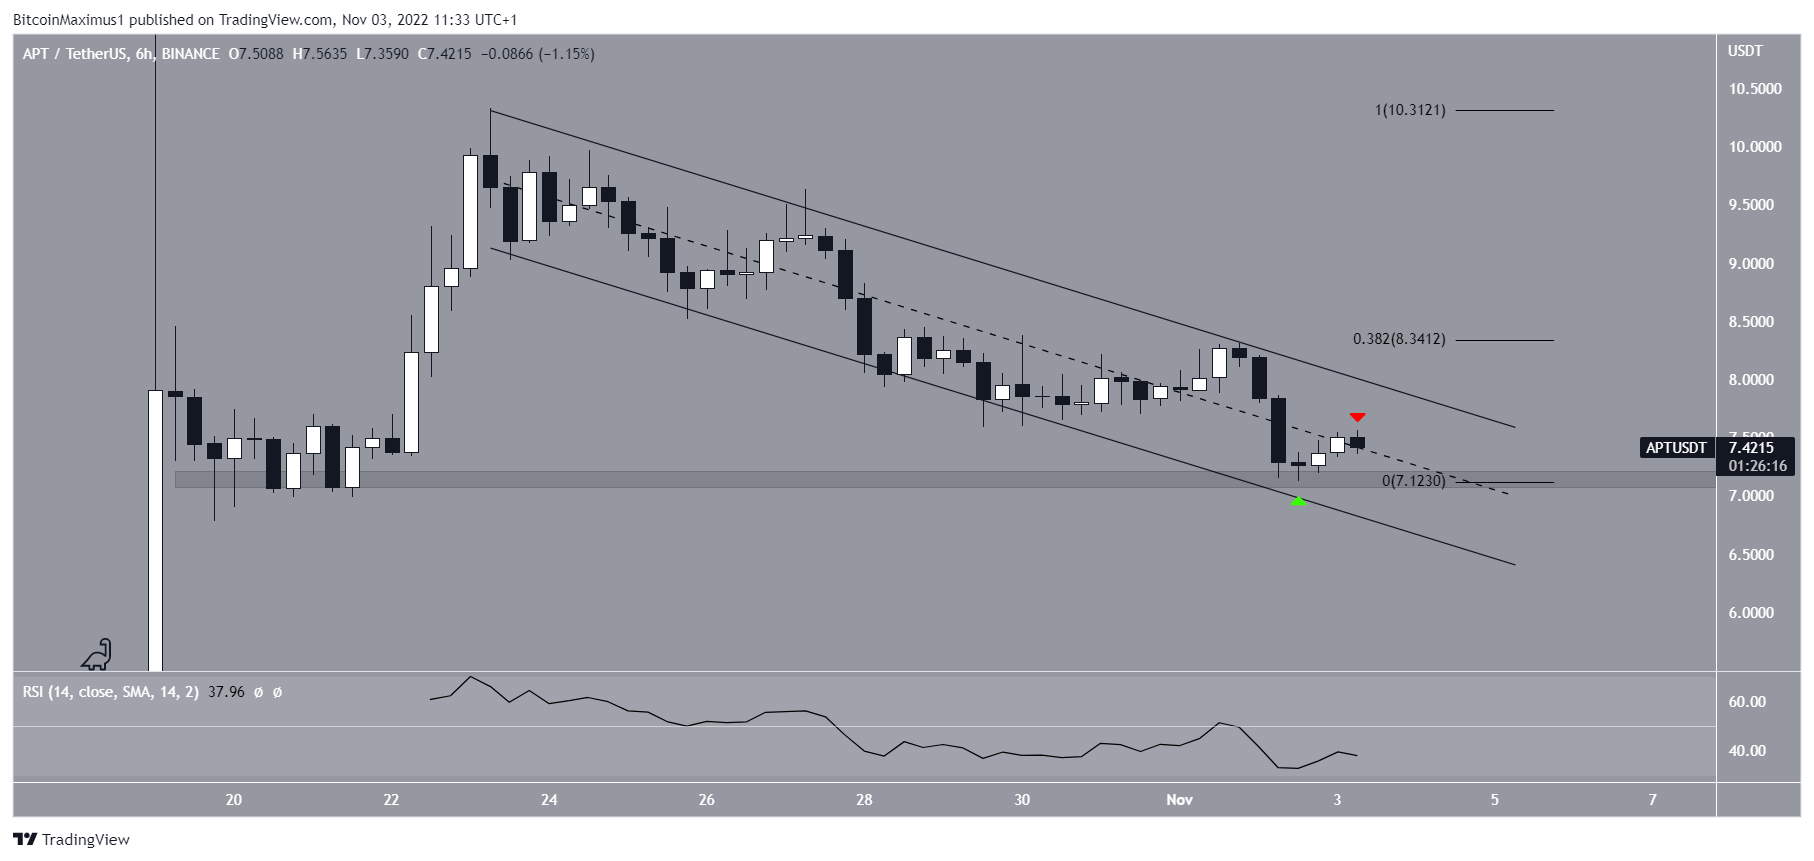
The Aptos (APT) price has corrected since Oct. 23. It seems to be in the final leg of the correction, which could cause a breakdown from the current support area.
A technical analysis of the APT price action shows a decrease inside a descending parallel channel since reaching a high of $10.33 on Oct. 23.
The downward movement has led to a low of $7.12 on Nov. 2. The low and ensuing bounce (green icon) served to validate the $7.15 horizontal area as support.
Descending parallel channels usually contain corrective structures, meaning an eventual breakout from it would be likely. If one occurs, the next closest resistance would be at $8.34.
However, despite the bounce, the APT price has yet to move above the middle of the channel. Doing so would be a sign an eventual breakout is expected.
Furthermore, the daily RSI is still bearish. It has not generated any bearish divergence, and it is still below 50.
Therefore, despite trading in a long-term corrective pattern, there are no signs that suggest a bullish Aptos price prediction and an impending reversal is likely. A daily close below the $7.15 horizontal area could accelerate the decrease and lead to new lows.
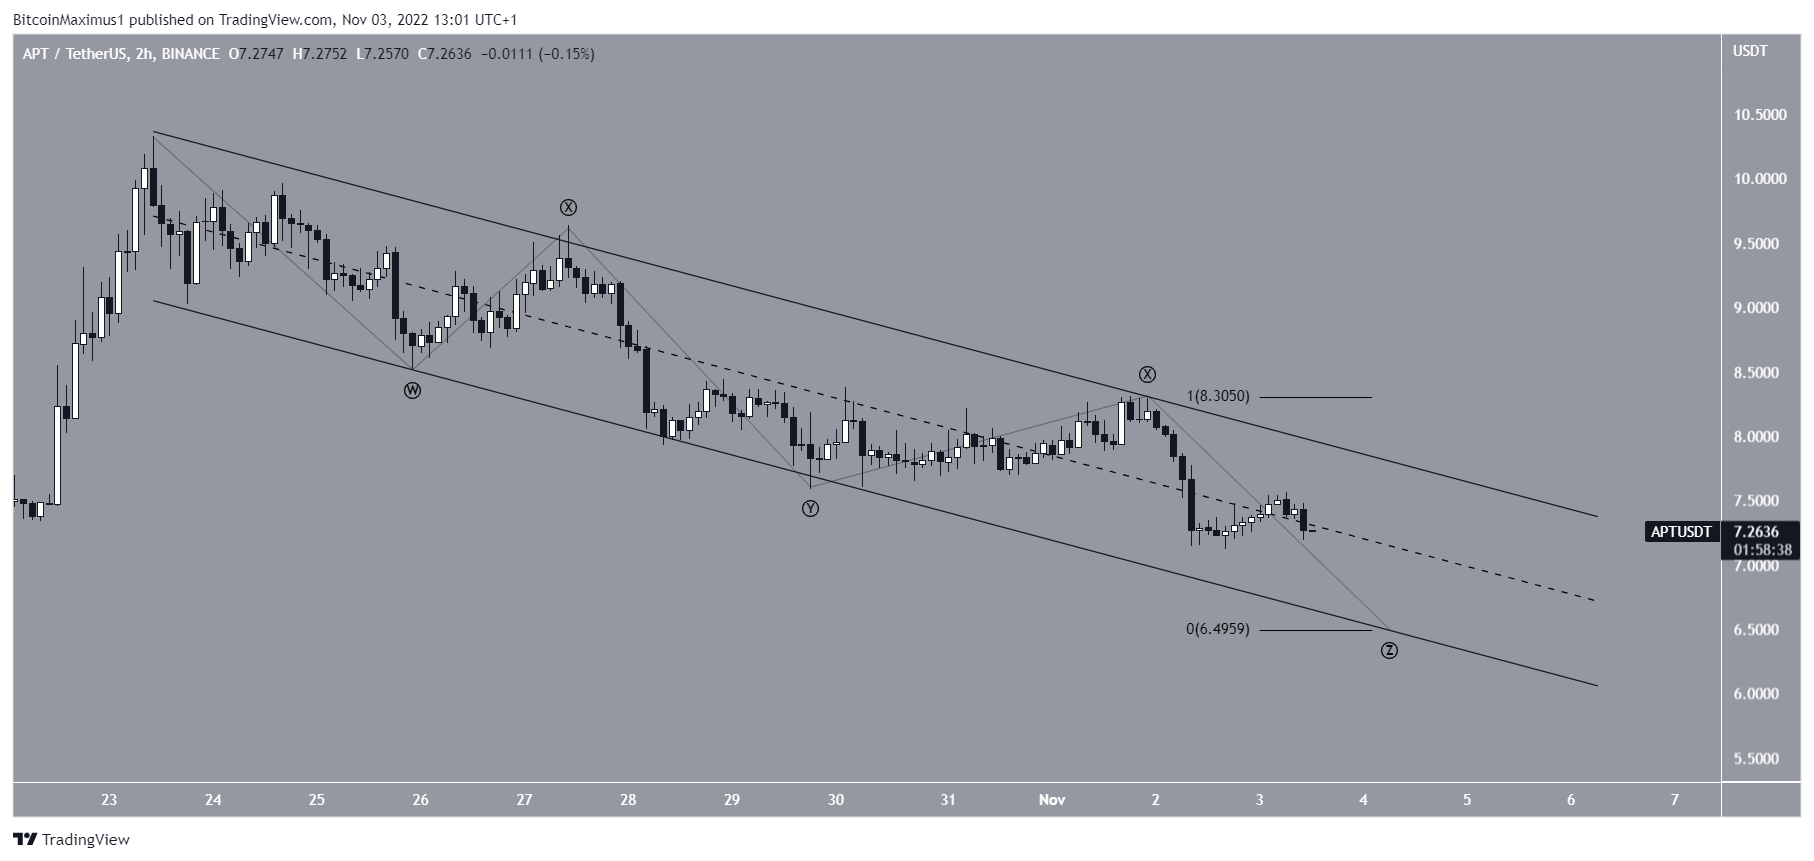
APT Price Prediction: Wave Count Supports $6.50 Low
The decrease since the Oct. 23 high resembles a complex corrective pattern (black). The considerable overlap and fact that the movement is contained inside the channel support this possibility.
If correct, this would mean that the Aptos price is in the Z-Wave of a W-X-Y-X-Z correction. Since wave Y was the longest, it would make sense that waves W and Z would have a 1:1 ratio. This minimum price would be expected to reach $6.50.
Additionally, this area coincides with the support line of the channel mentioned above. Due to this confluence, it is fitting that a low would be reached at this level.
Conversely, a breakout above the channel’s resistance line would invalidate this bearish APT short-term price prediction.
For the latest BeInCrypto Bitcoin (BTC) and crypto market analysis, click here
Disclaimer: BeInCrypto strives to provide accurate and up-to-date information, but it will not be responsible for any missing facts or inaccurate information. You comply and understand that you should use any of this information at your own risk. Cryptocurrencies are highly volatile financial assets, so research and make your own financial decisions.


