


The Aragon (ANT) price has bounced above a long-term ascending support line and aims to reach the next resistance area at $8.
Both Ocean Protocol (OCEAN) and Decentraland (MANA) have been moving upwards since validating their previous all-time highs as support.
Aragon (ANT)
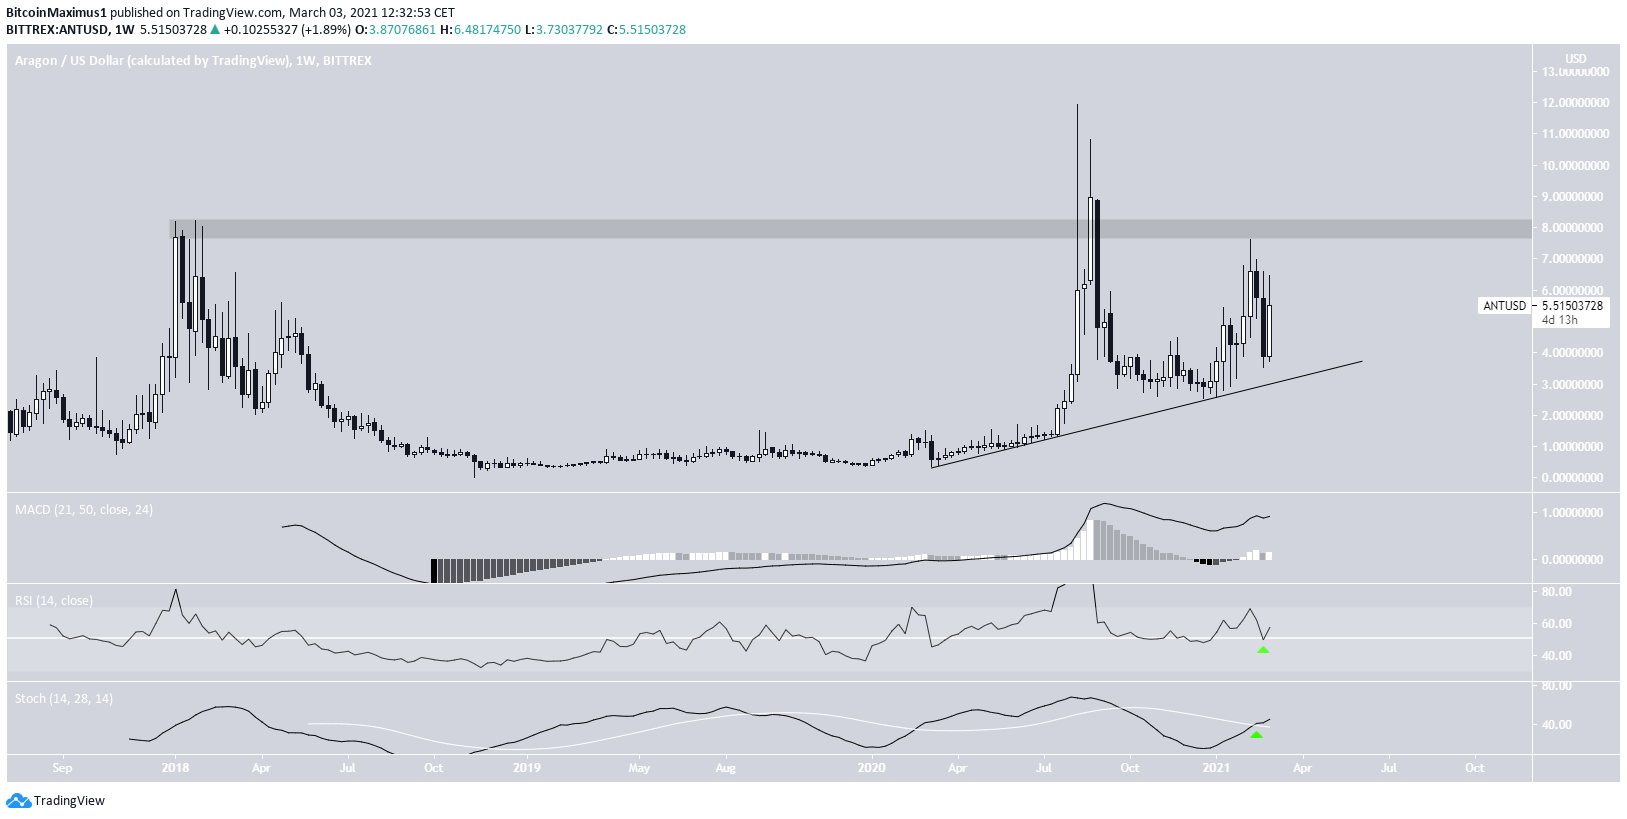
The weekly chart shows that ANT has been following an ascending support line since Mar. 2020, when it was trading at a low of $0.35. Currently, it is trading only slightly above it.
Technical indicators are bullish, as evidenced by the bullish cross in the Stochastic oscillator and the RSI bounce at 50.
If ANT resumes the ongoing bounce, it will find the next resistance area at $8, the all-time high level from 2017, which was broken in 2020.
Since ANT has fallen back below it, it is likely to act as resistance once more.
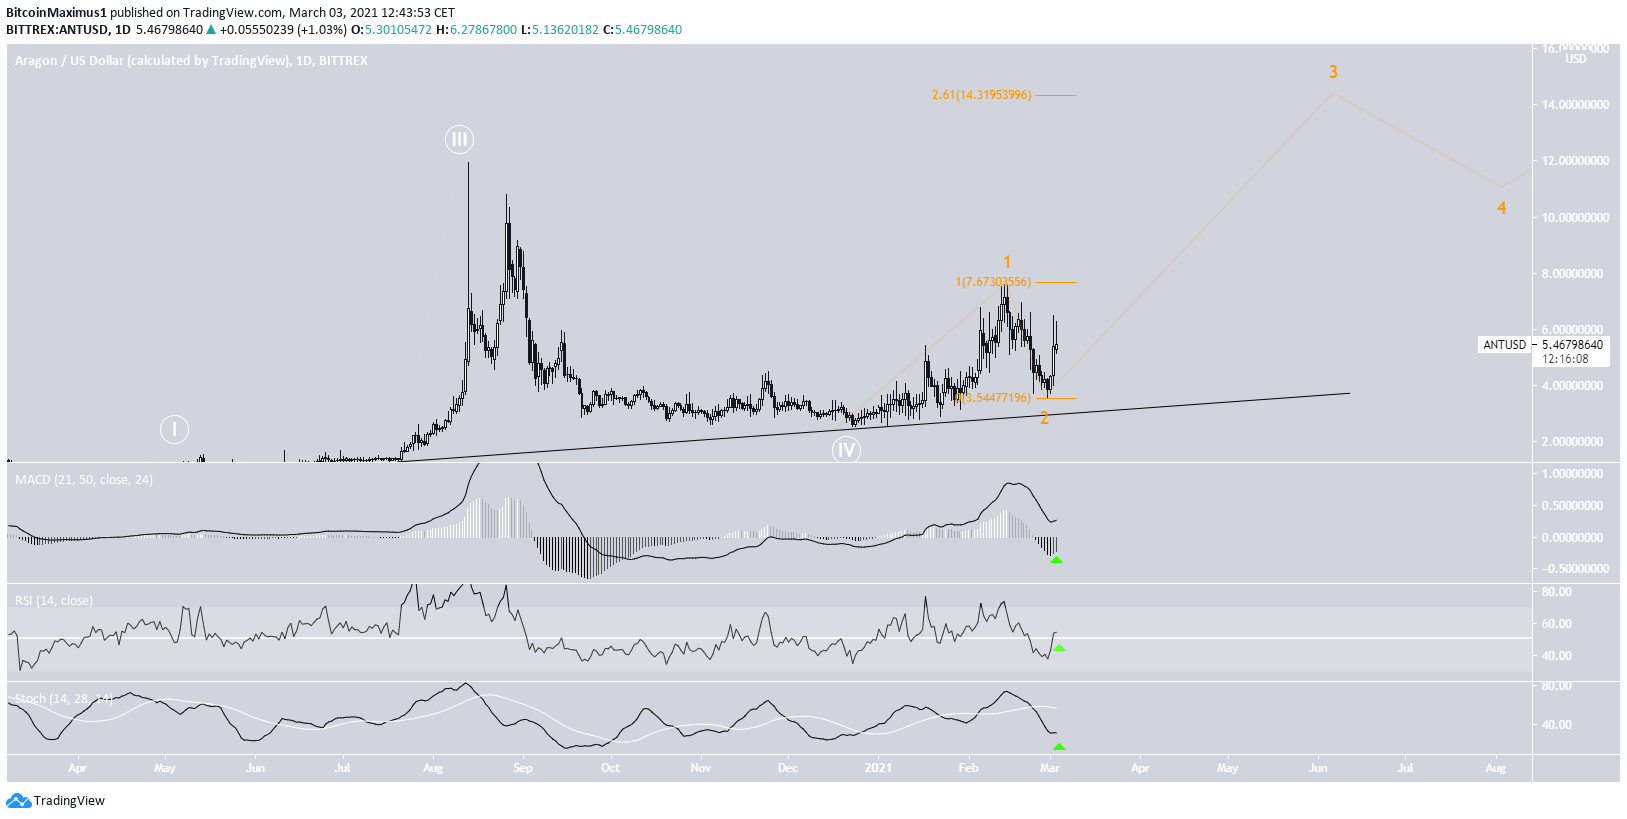
The wave count suggests that ANT is in wave three of a bullish impulse (orange). A potential target for the top of the current movement would be found at $14.31, found by the 2.61 external fib retracement of wave two.
The daily time-frame’s technical indicators are also gradually turning bullish, as evidenced by the bullish reversal signal in the MACD and the RSI cross above 50.
Highlights
- ANT is following a long-term ascending support line.
- It is likely in wave three of a bullish impulse.
Ocean Protocol (OCEAN)
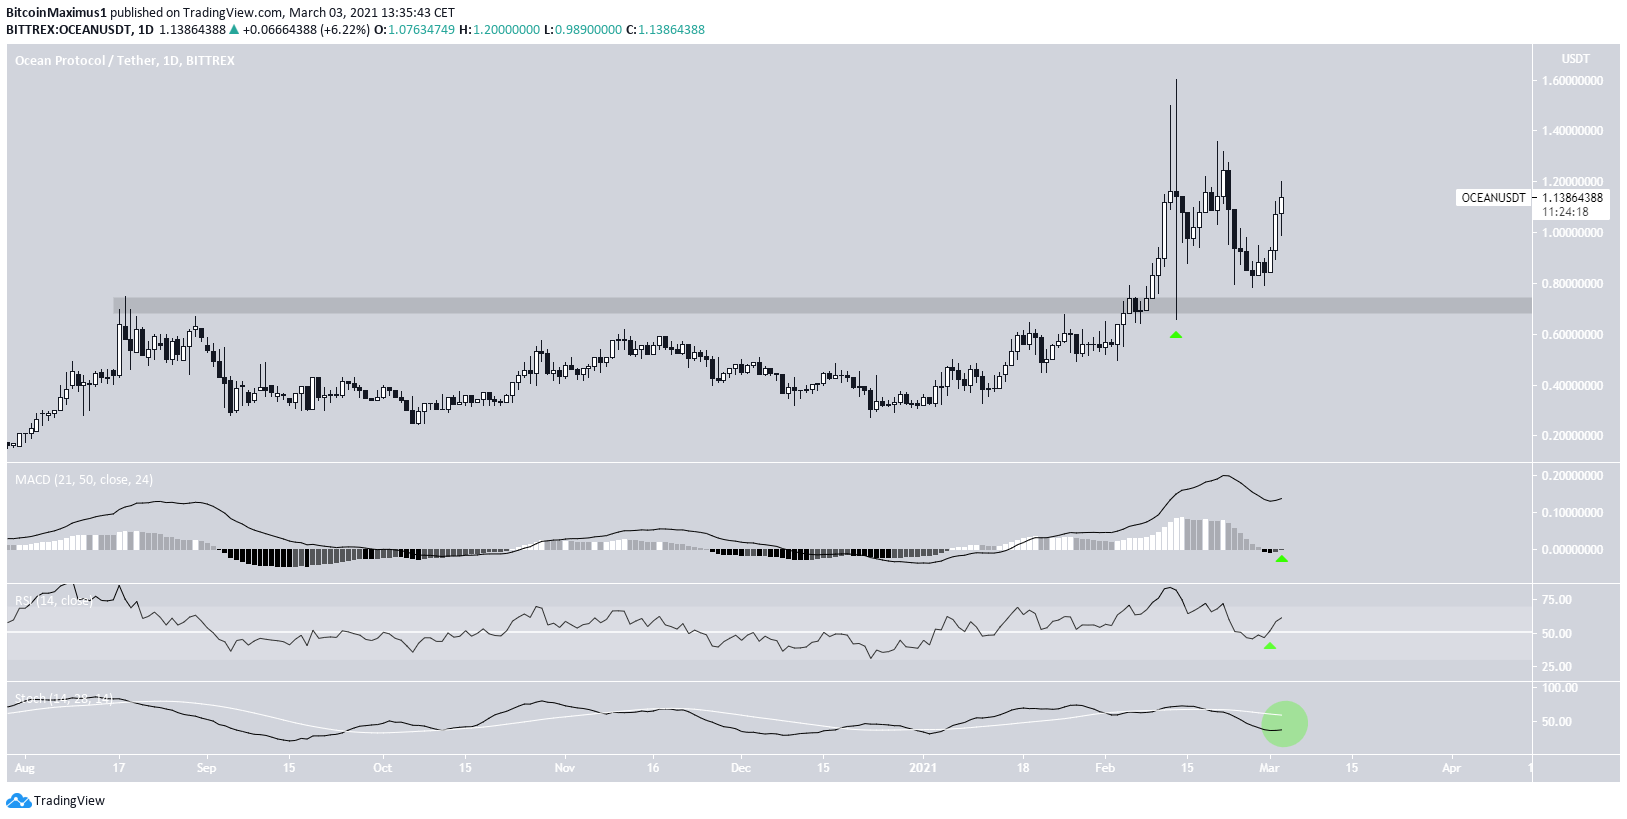
On Feb. 13, OCEAN reached an all-time high price of $1.60, but decreased immediately afterwards, falling all the way to a low of $0.65.
The drop served to validate the previous all-time high resistance at $0.65 as support and created a long lower wick. OCEAN has been moving upwards since.
Technical indicators are gradually turning bullish, as evidenced by the bullish reversal signal in the MACD and the RSI bounce above 50.
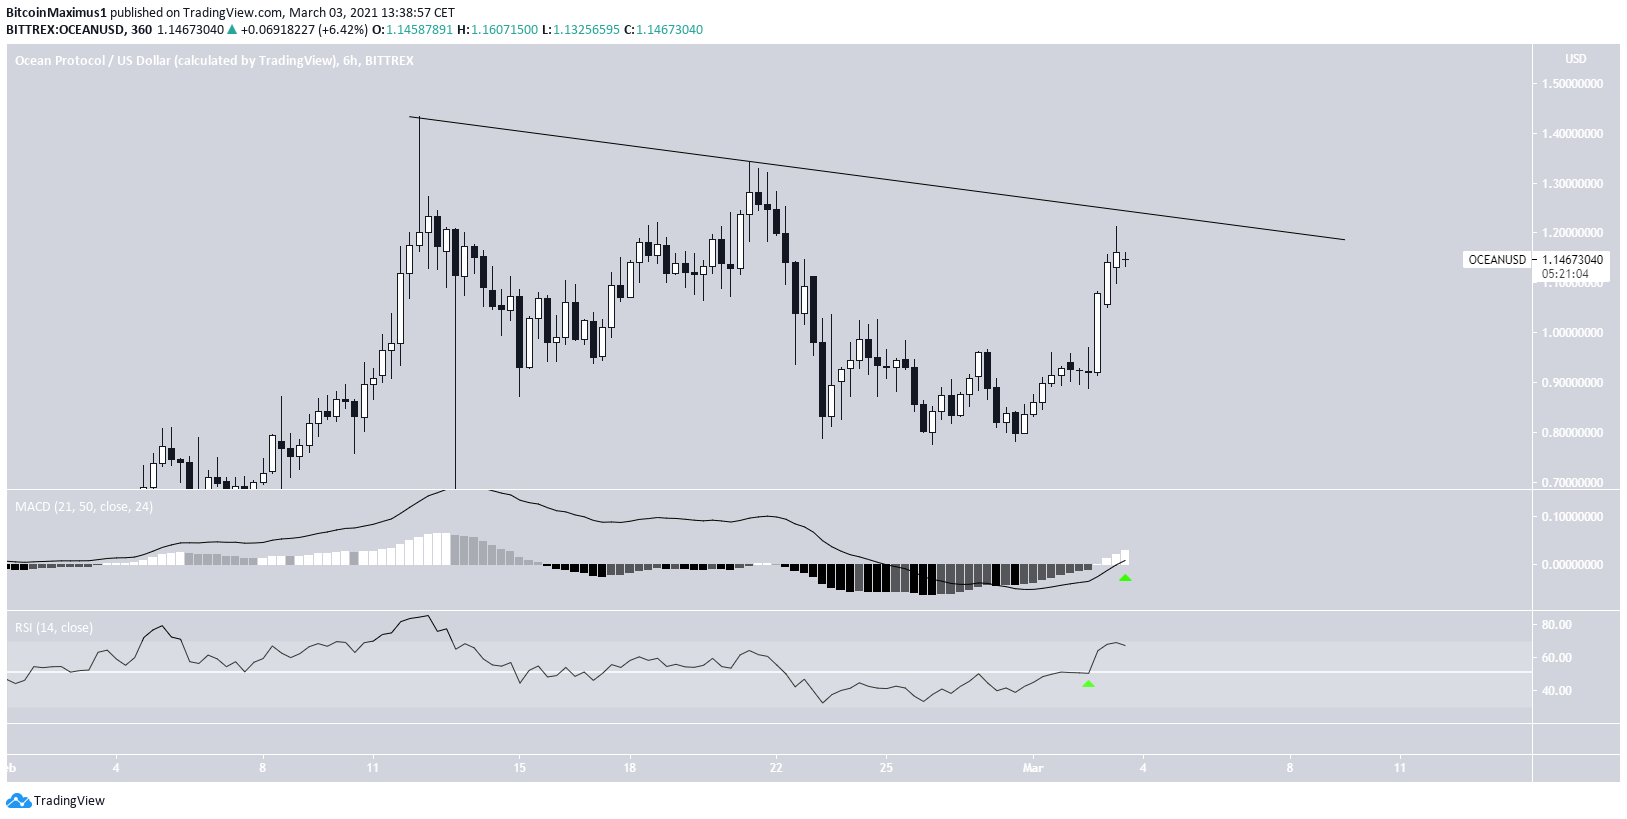
The shorter-term six-hour chart shows that OCEAN is still following a descending resistance line, currently being very close to touching it for the third time.
Both the MACD & RSI support the possibility of a breakout, which would likely take OCEAN towards the all-time high price of $1.60 and potentially higher.
Highlights
- OCEAN has re-tested the previous all-time high as support.
- OCEAN is following a descending resistance line.
Decentraland (MANA)
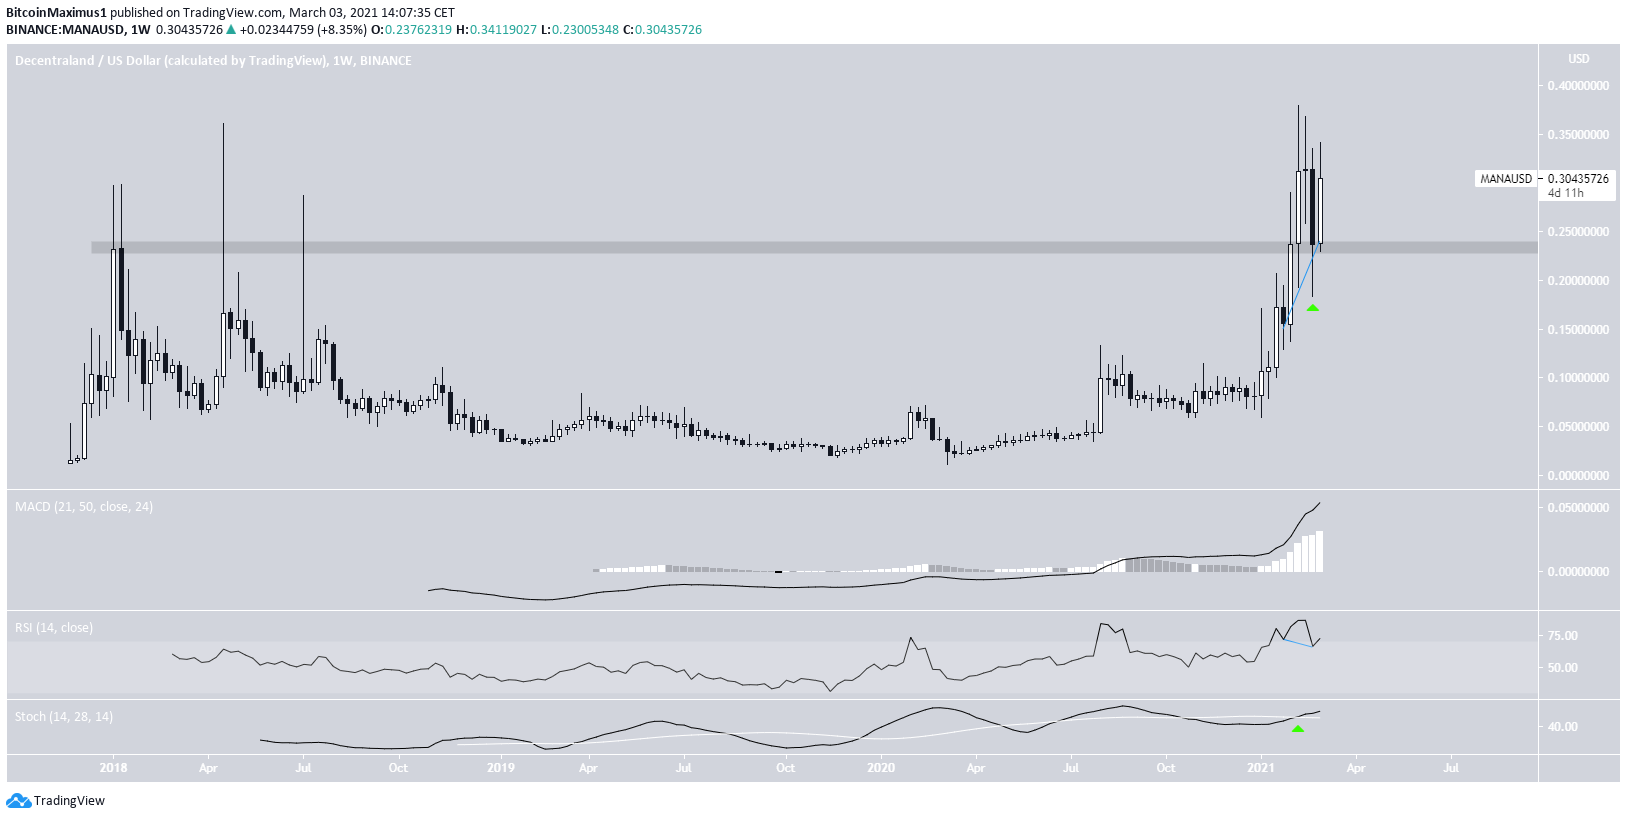
On Feb. 13, MANA reached an all-time high price of $0.379 but began to decrease immediately afterward. The drop took it to the previous all-time high resistance area of $0.23, validated as support.
Technical indicators are bullish since both the Stochastic oscillator and the MACD are increasing while the RSI has generated hidden bullish divergence.
This suggests that MANA is likely to surge towards the all-time high price of $0.379 and potentially increase.
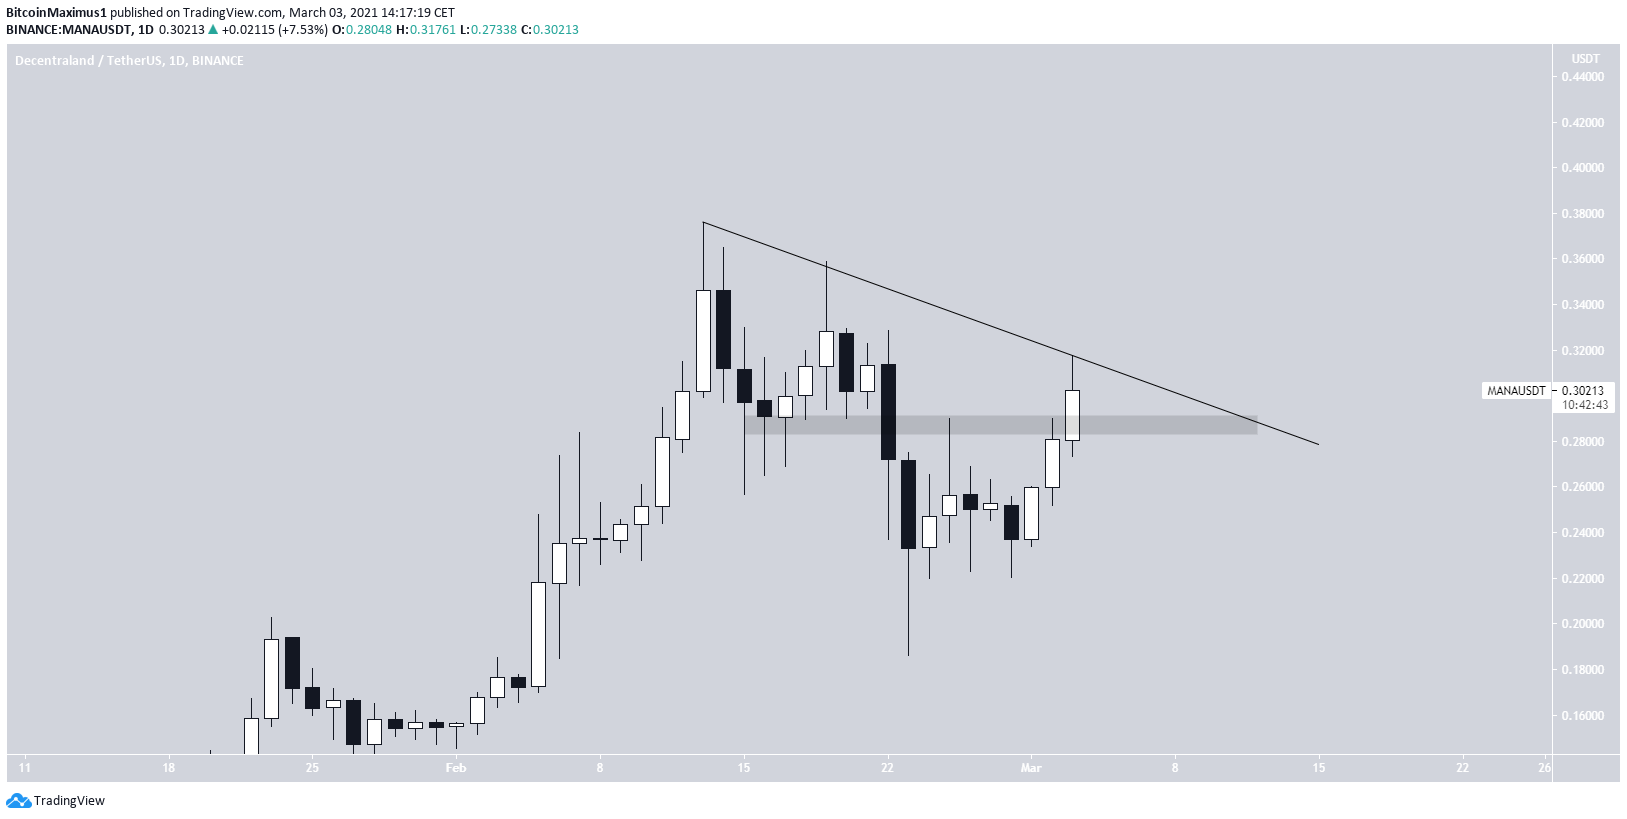
The shorter-term daily chart support this, since it shows that MANA has reclaimed the previous breakdown level at $0.287.
While it is still following a descending resistance line, its breakout will likely trigger an upward movement towards a new all-time high.
Highlights
- MANA has re-tested the previous all-time high as support.
- It is following a descending resistance line.
For BeInCrypto’s latest Bitcoin (BTC) analysis, click here.


