


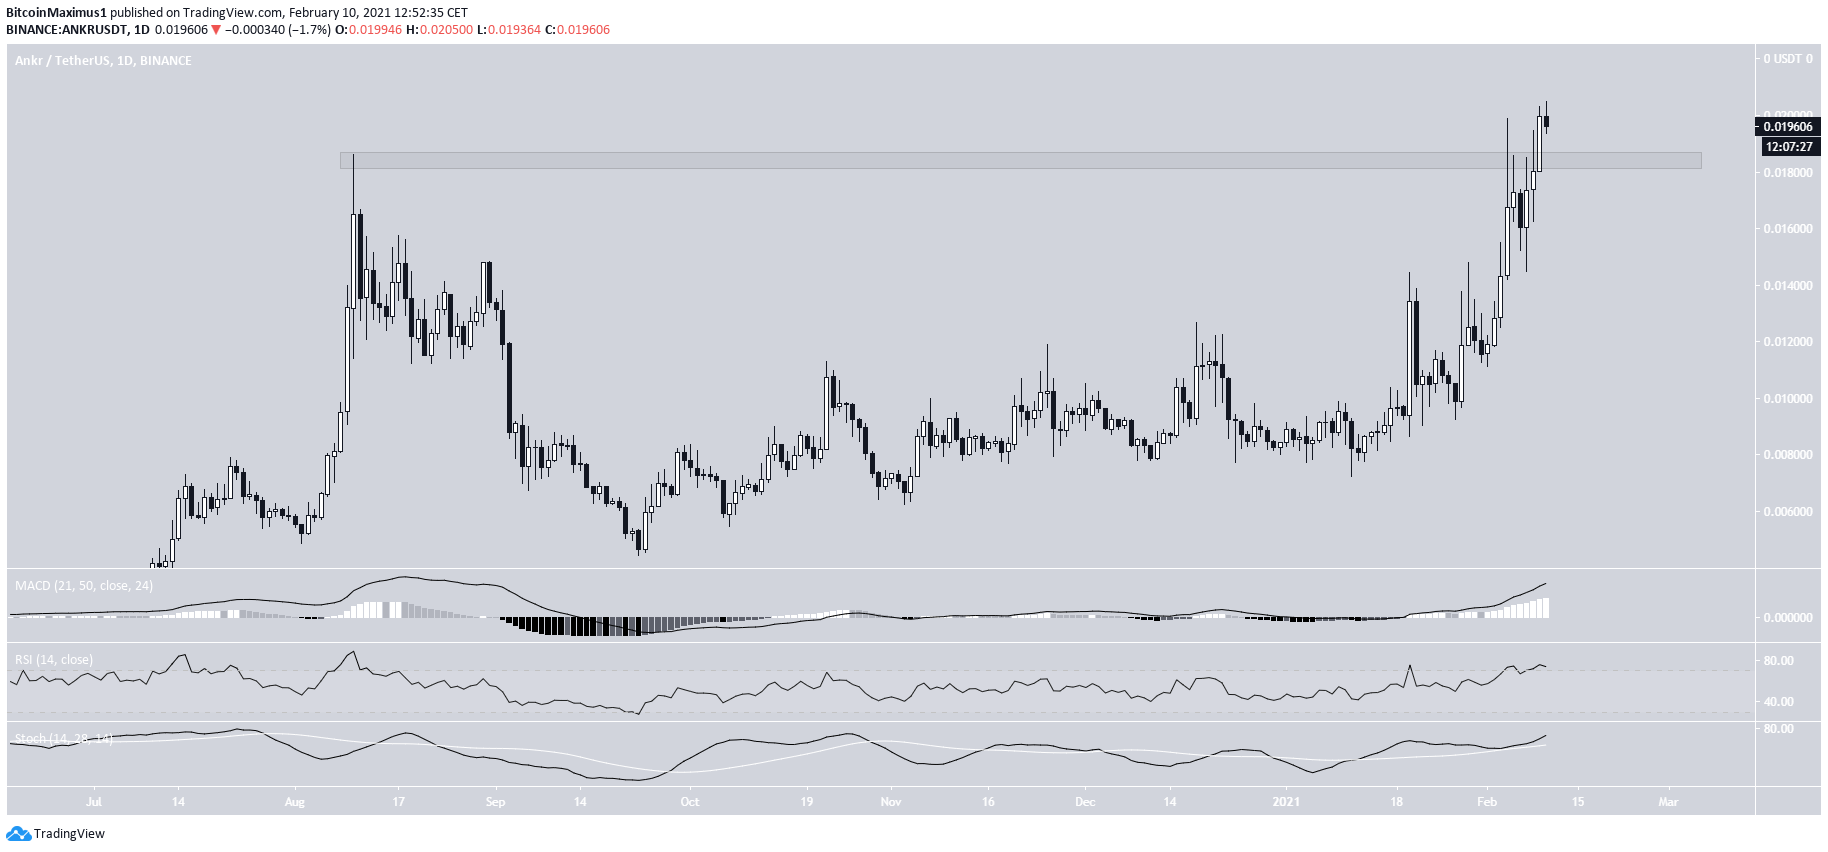
Ankr (ANKR) reached an all-time high price of $0.0205 on Feb. 10, but has decreased slightly since.
Despite the drop, the trend still looks bullish, and ANKR is expected to continue moving upward towards new highs.
All-Time High
ANKR has been moving upwards since Sept. 23, 2020, when it was trading at a low of $0.004.
On Feb. 4, 2021, ANKR reached a new all-time high price of $0.0199, and proceeded to reach a slightly higher high of $0.0205, on Feb. 10.
Technical indicators are still bullish, supporting the possibility that the upward movement will continue.
Wave Count
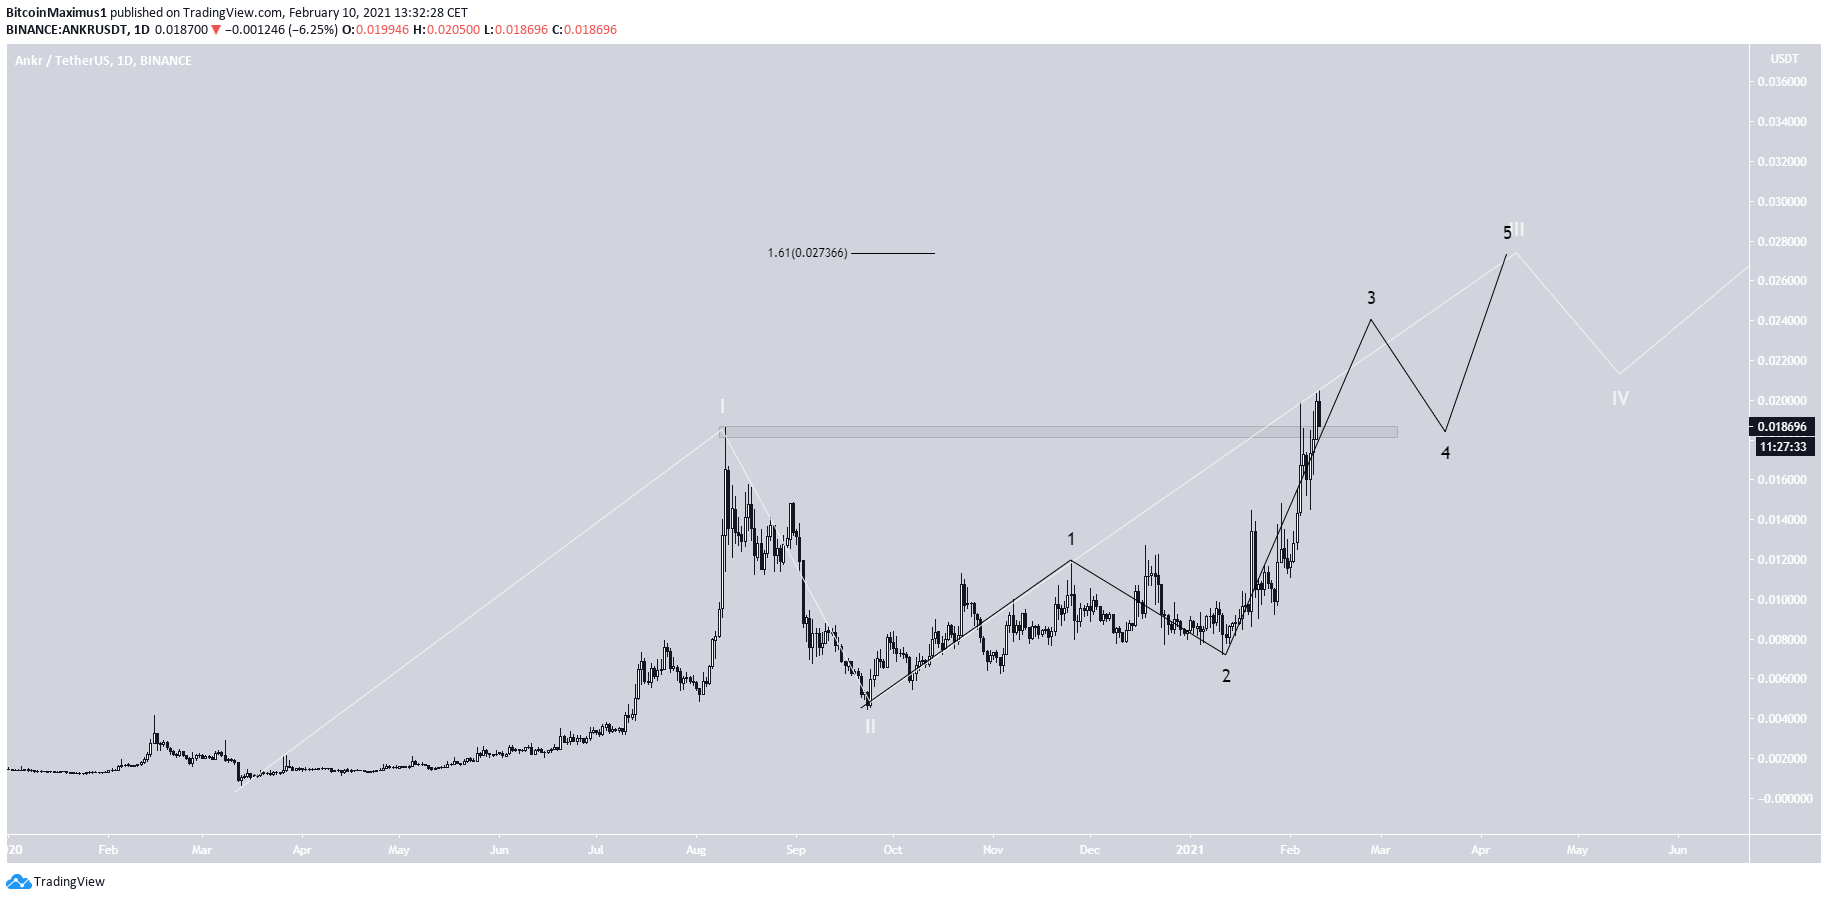
The wave count suggests that ANKR is in wave three (white) of a long-term bullish impulse that began with the Mar. 2020 lows.
The sub-wave count is given in black, indicating that ANKR is in an extended sub-wave three.
The most likely target for the top of the movement is located at $0.027, the 1.61 external Fib retracement of the most recent downward movement.
ANKR/BTC
Cryptocurrency trader @jjjcycles outlined an ANKR/BTC chart, stating that once it clears the current resistance, it is likely to move upwards at an accelerated pace.
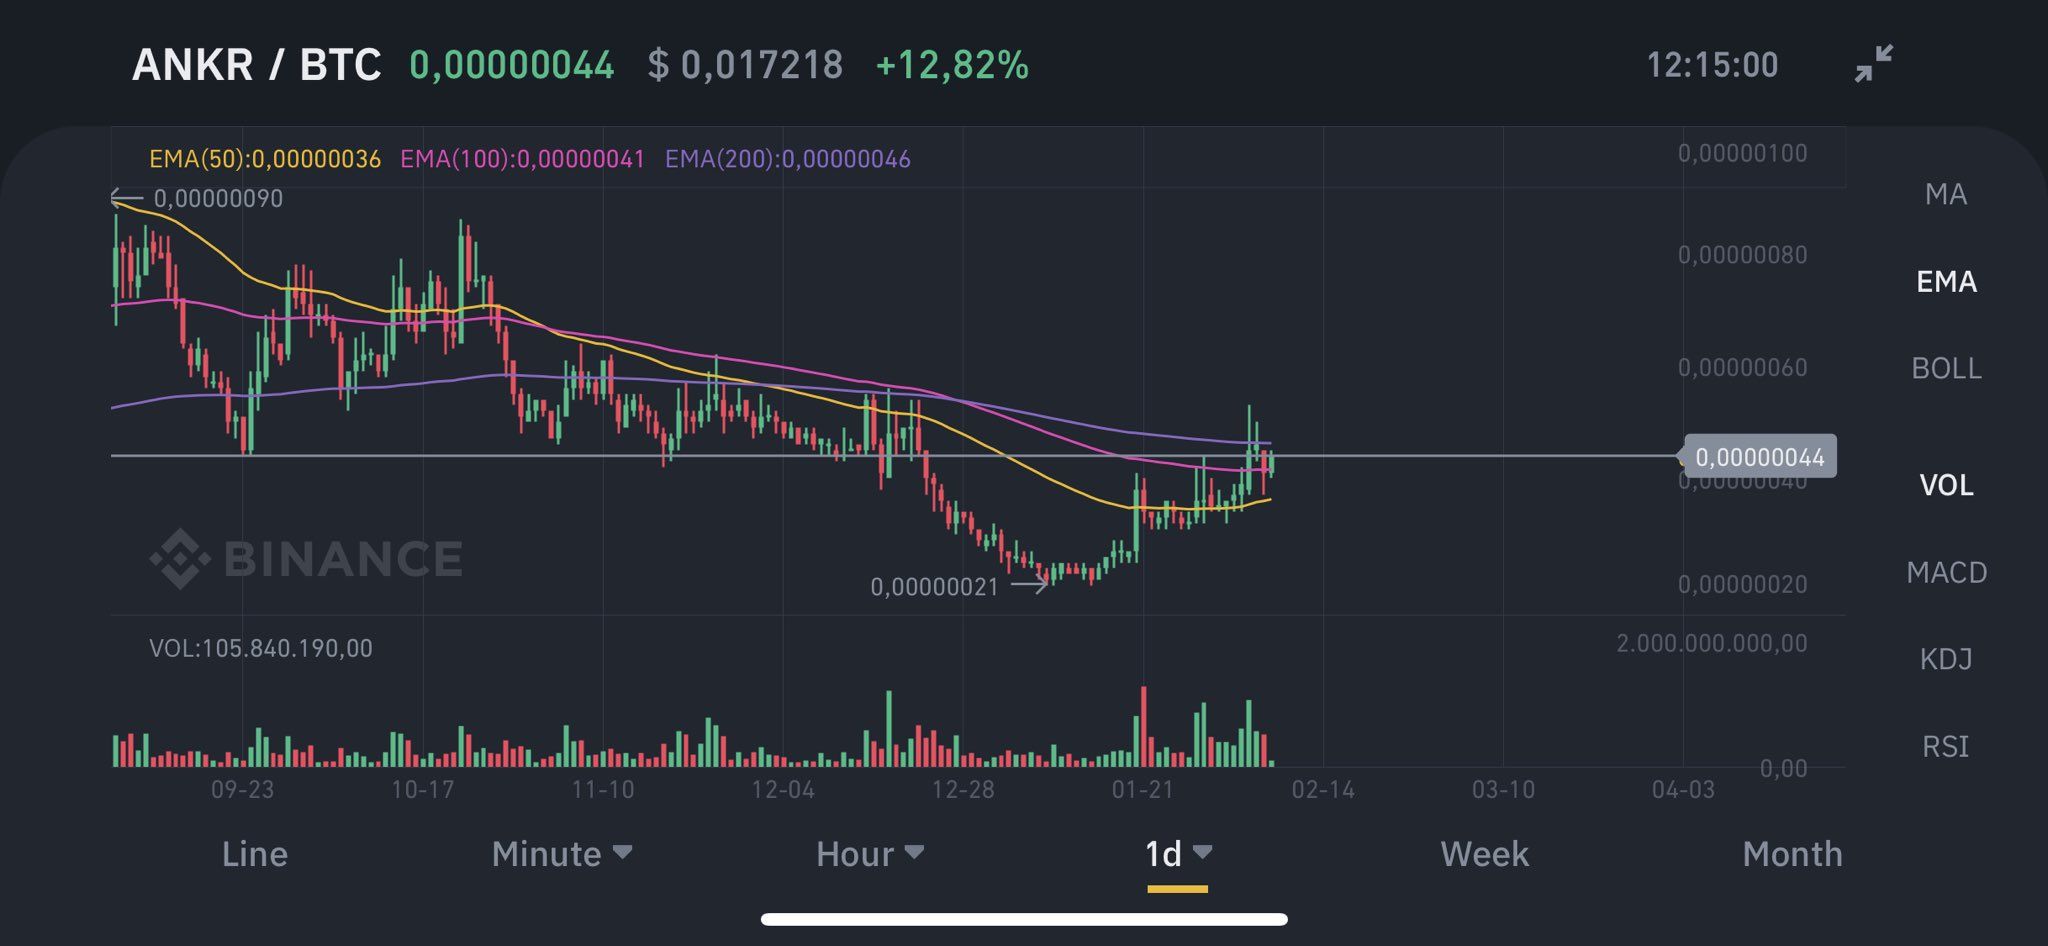
The aforementioned resistance area is found at 45 satoshis. ANKR was rejected by it, in the beginning of February, and has decreased slightly since.
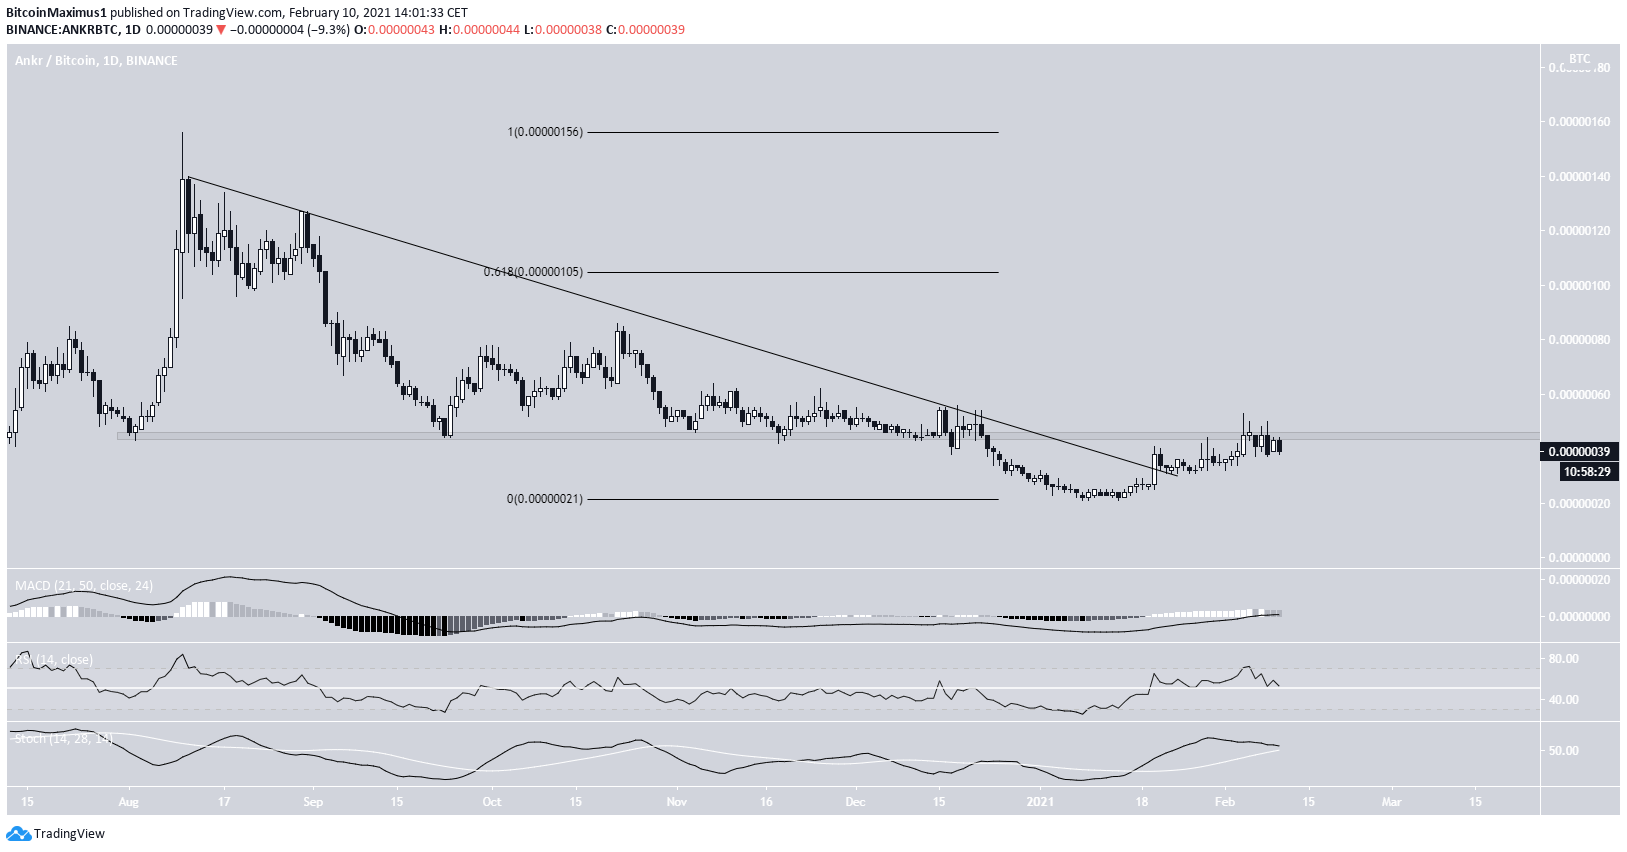
However, prior to reaching it, ANKR broke out from a long-term descending resistance line, possibly indicating that an upward move has begun.
This is also supported by the reading from technical indicators, which are still bullish despite the recent drop.
Once ANKR clears the 45 satoshi area, the upward trend will be confirmed, and ANKR would be expected to increase towards the next resistance area at 105 satoshis.
To conclude, ANKR/USD is expected to continue increasing towards the next closest resistance area at $0.0207.
The trend for ANKR/BTC also seems to be bullish, with the rate of increase likely to accelerate once it moves above 45 satoshis.
For BeInCrypto’s latest bitcoin (BTC) analysis, click here.


