Bitcoin CME futures for June expire this Friday the 26. An analysis of the price movement during prior expiry dates shows a bearish bias, but the results are not conclusive enough to state with certainty that Bitcoin (BTC) decreases during these dates.
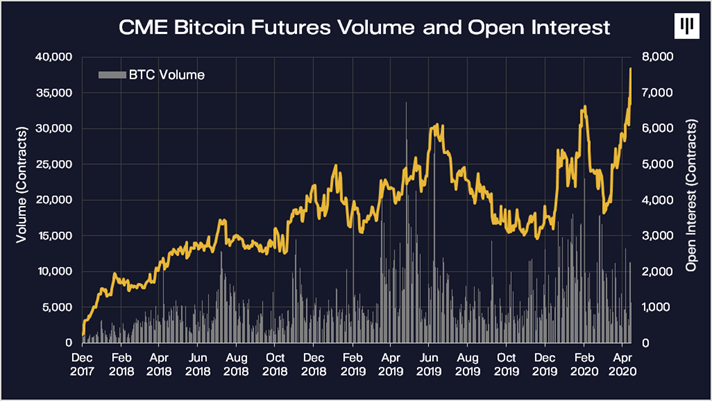
CEO of investment firm Pantera Capital, @Dan_Pantera, stated that the open interest (total number of outstanding derivative contracts that have not been settled) has been increasing for BTC, advocating for increased exposure to Bitcoin due to quantitative easing:
CME bitcoin futures provide a real-time proxy for the increase in institutional investment. Open interest recently surged to a record high.
In this new era of Unlimited Quantitative Easing it might be imprudent to **not** have some exposure to #bitcoin
Bitcoin CME futures, which are financial contracts that obligate the buyer/seller to purchase or sell an asset at a predetermined price, expire on the last Friday of each month, so we are going to take a look at expiry dates for 2020 and the BTC movement on these dates to see if a pattern arises. The next expiry date is this Friday, June 26.
Previous Bitcoin Futures Expirations
The previous five monthly expiry dates for 2020 have happened on Jan 31, Feb 28, March 27, April 24, and May 29.
Interestingly, BTC created a bearish candlestick on four of these dates. However, the movement was usually small, ranging from +0.2% (April 14) to -5.5% (March 27). BTC, for the most part, created candlesticks with small bodies and wicks on either side, indicative of indecision in the market.
Therefore, we cannot state with certainty that the price reacts in a specific way to the date in which futures contracts expire.

Current Movement
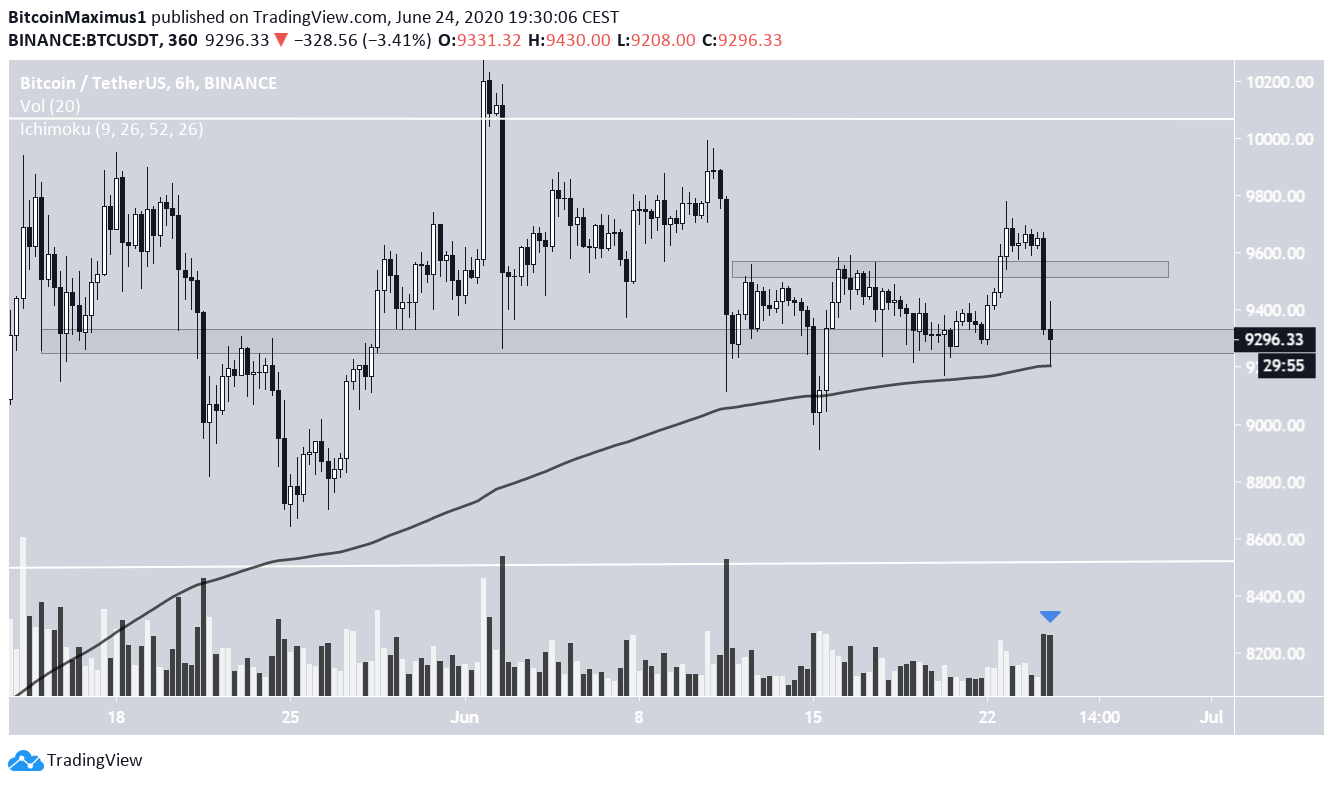
As for the current movement, BTC has decreased considerably today with high volume but is trading inside the $9,250 support area, which has previously initiated several upward movements.
Furthermore, the price is also trading above the 50-day moving average (MA), which initiated a strong bounce on June 15. However, the fact that the price is revisiting the support area often makes it weaker and suggests that a breakdown could occur. If this is the case, the price could decrease all the way to $8,500.
However, the support area is still expected to initiate some type of bounce, possibly back towards the $9,500 support it just broke down from.
The $9,250 area is crucial though since it will likely determine the direction of the future trend.