


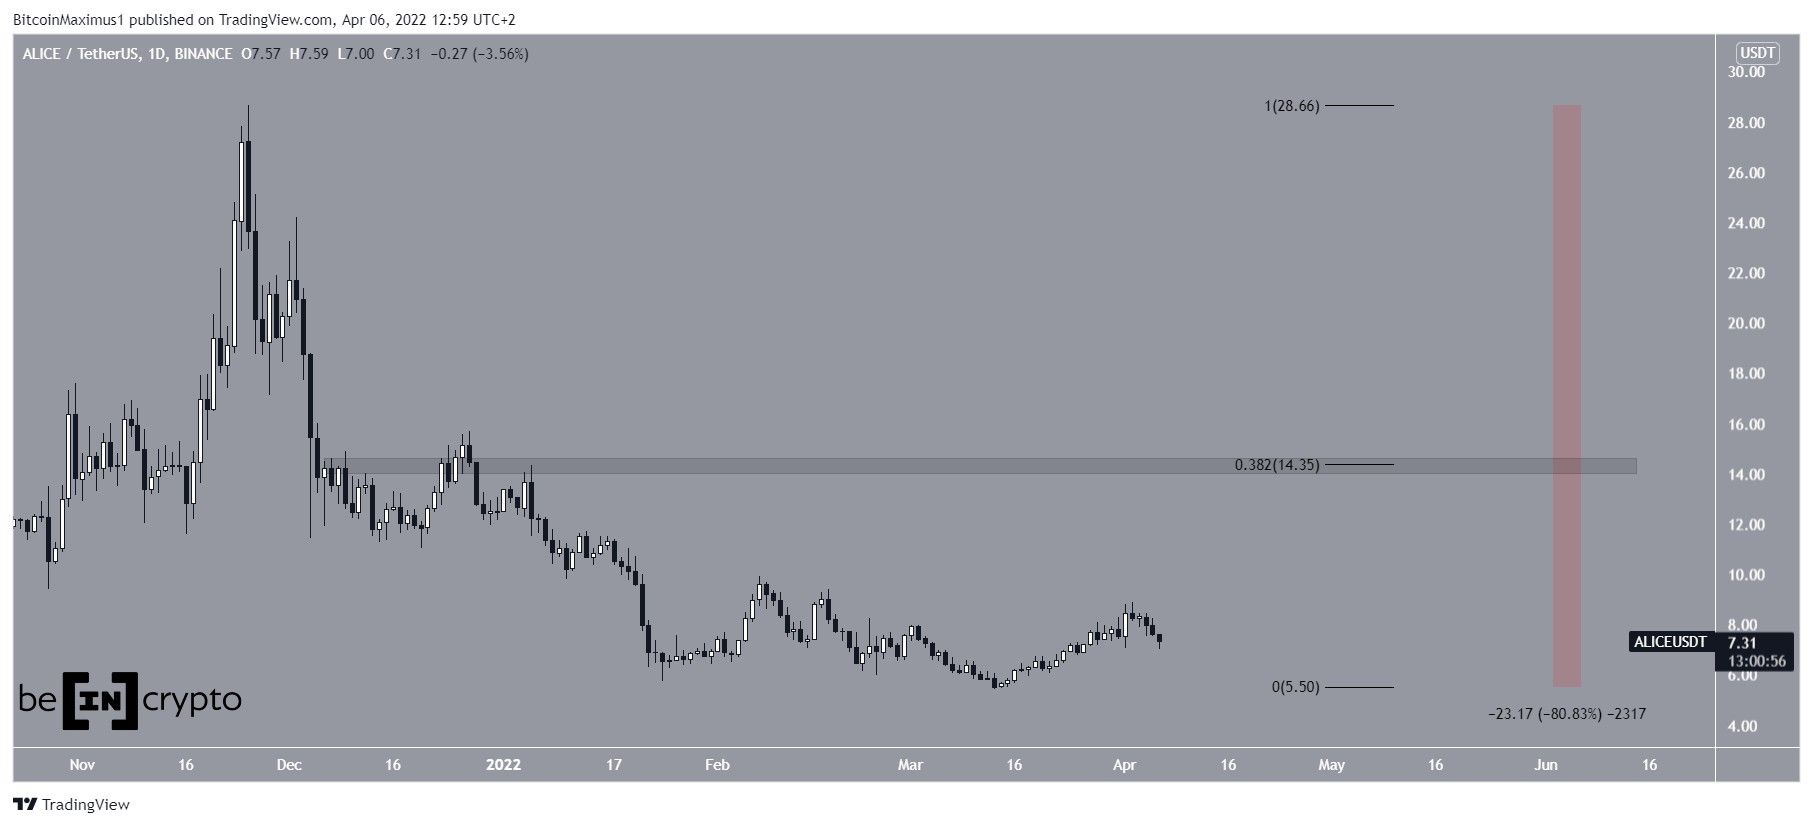
My Neighbor Alice (ALICE) is attempting to find support after breaking down from a short-term ascending support line.
ALICE has been falling since reaching an all-time high price of $28.66 on Nov 25. The downward movement led to a low of $5.38 on March 13. Measuring from the high, this amounted to a decrease of 81%.
While ALICE has been moving upwards since, it has yet to reach any significant resistance levels. The first such resistance is at $14.35. This is the 0.382 Fib retracement resistance level and a horizontal resistance area.
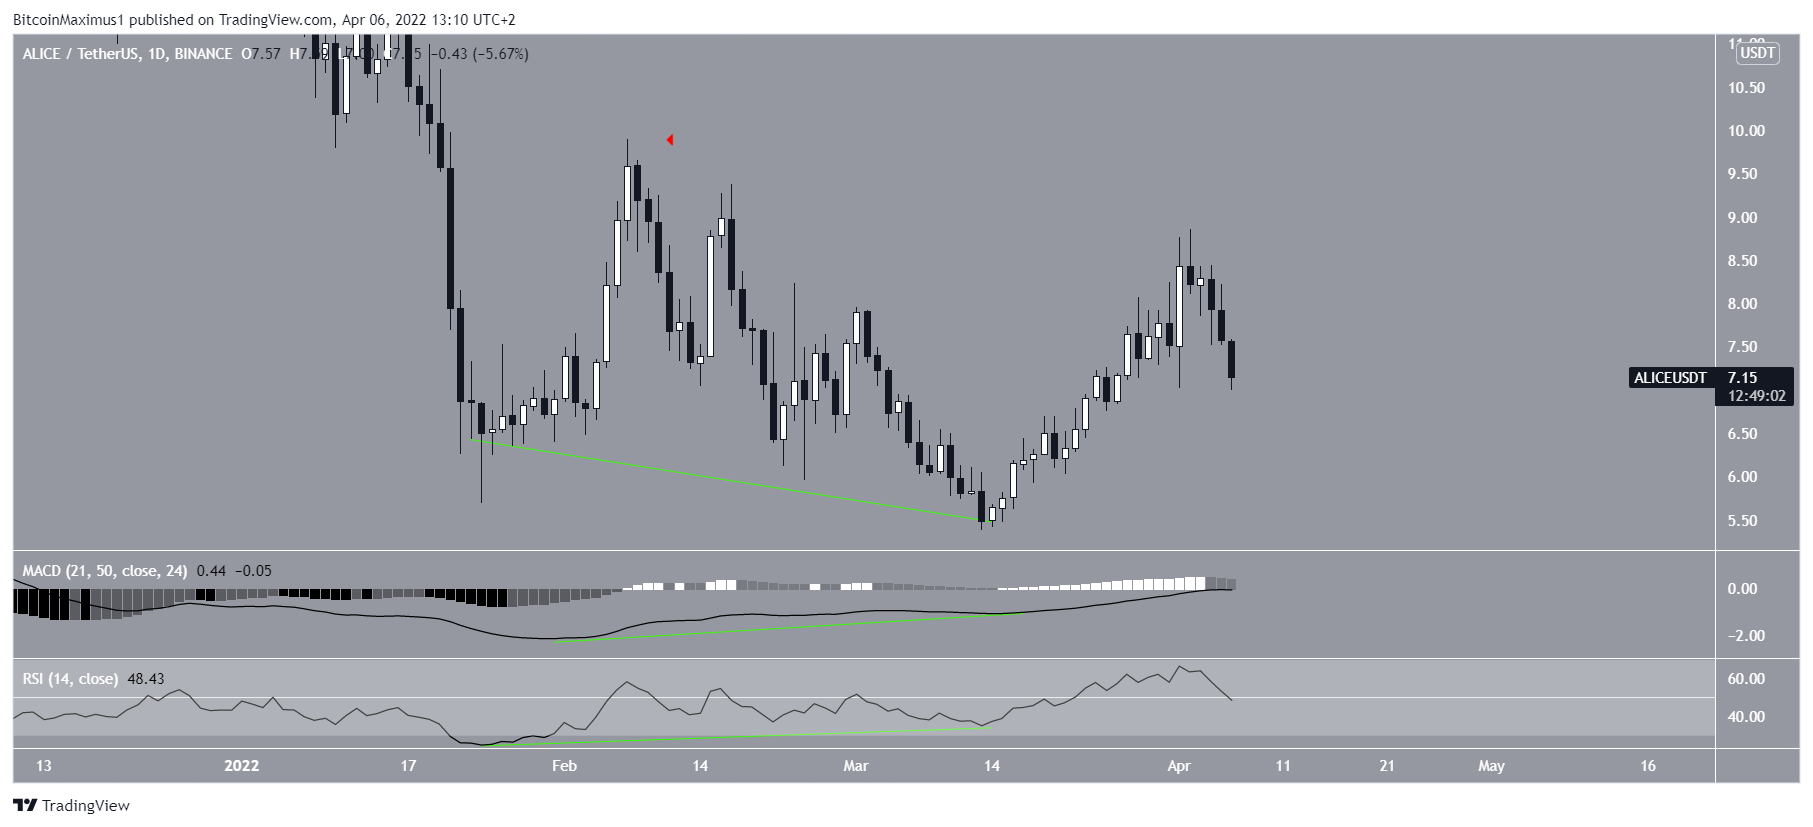
Double bottom pattern
A closer look at the daily movement for ALICE shows a double bottom, which is considered a bullish pattern. The double bottom transpired between Jan and March 24.
Besides being a bullish pattern, the double bottom was combined with bullish divergences in both the RSI and MACD (green lines). Such divergences usually precede bullish trend reversals.
While a reversal has occurred since the double bottom, the price has yet to even reach the highs between the two bottoms (red icon).
After such a pattern, a more pronounced reversal would be customary, which would take ALICE at least to the aforementioned highs.
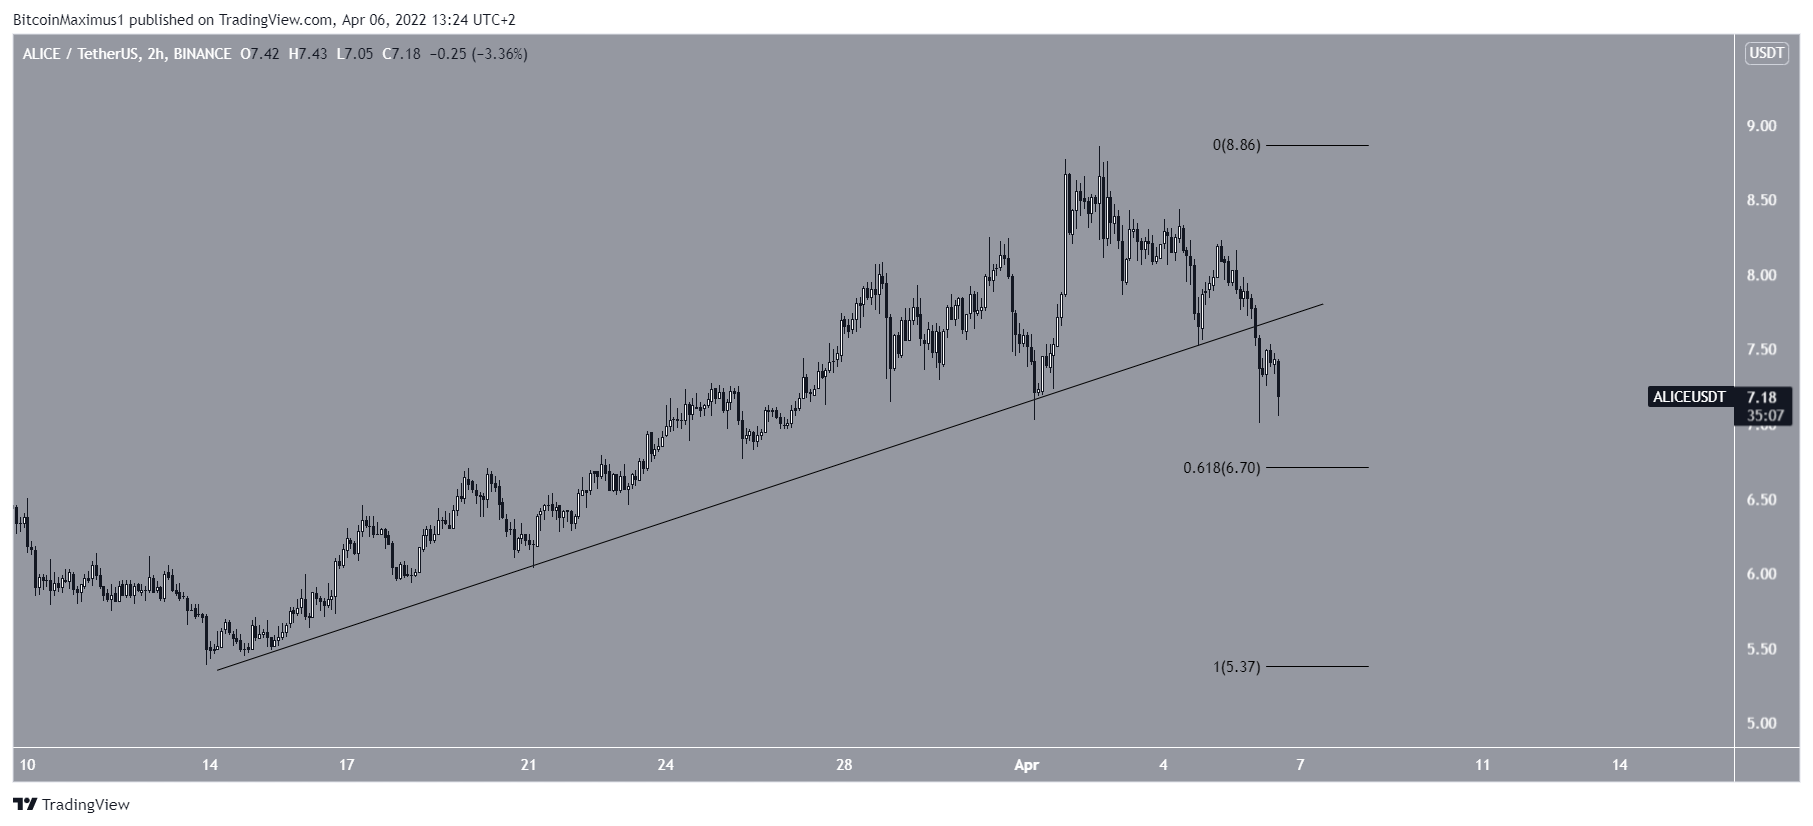
The two-hour chart shows that ALICE has already broken down from an ascending support line that had been in place since March 14.
The closest support area is at $6.70. This is the 0.618 Fib retracement support level and is expected to halt the ongoing drop.
Wave count analysis
Cryptocurrency trader @Jacobemmerton tweeted a chart of ALICE, stating that the price has begun an upward movement that could take it to at least $40.
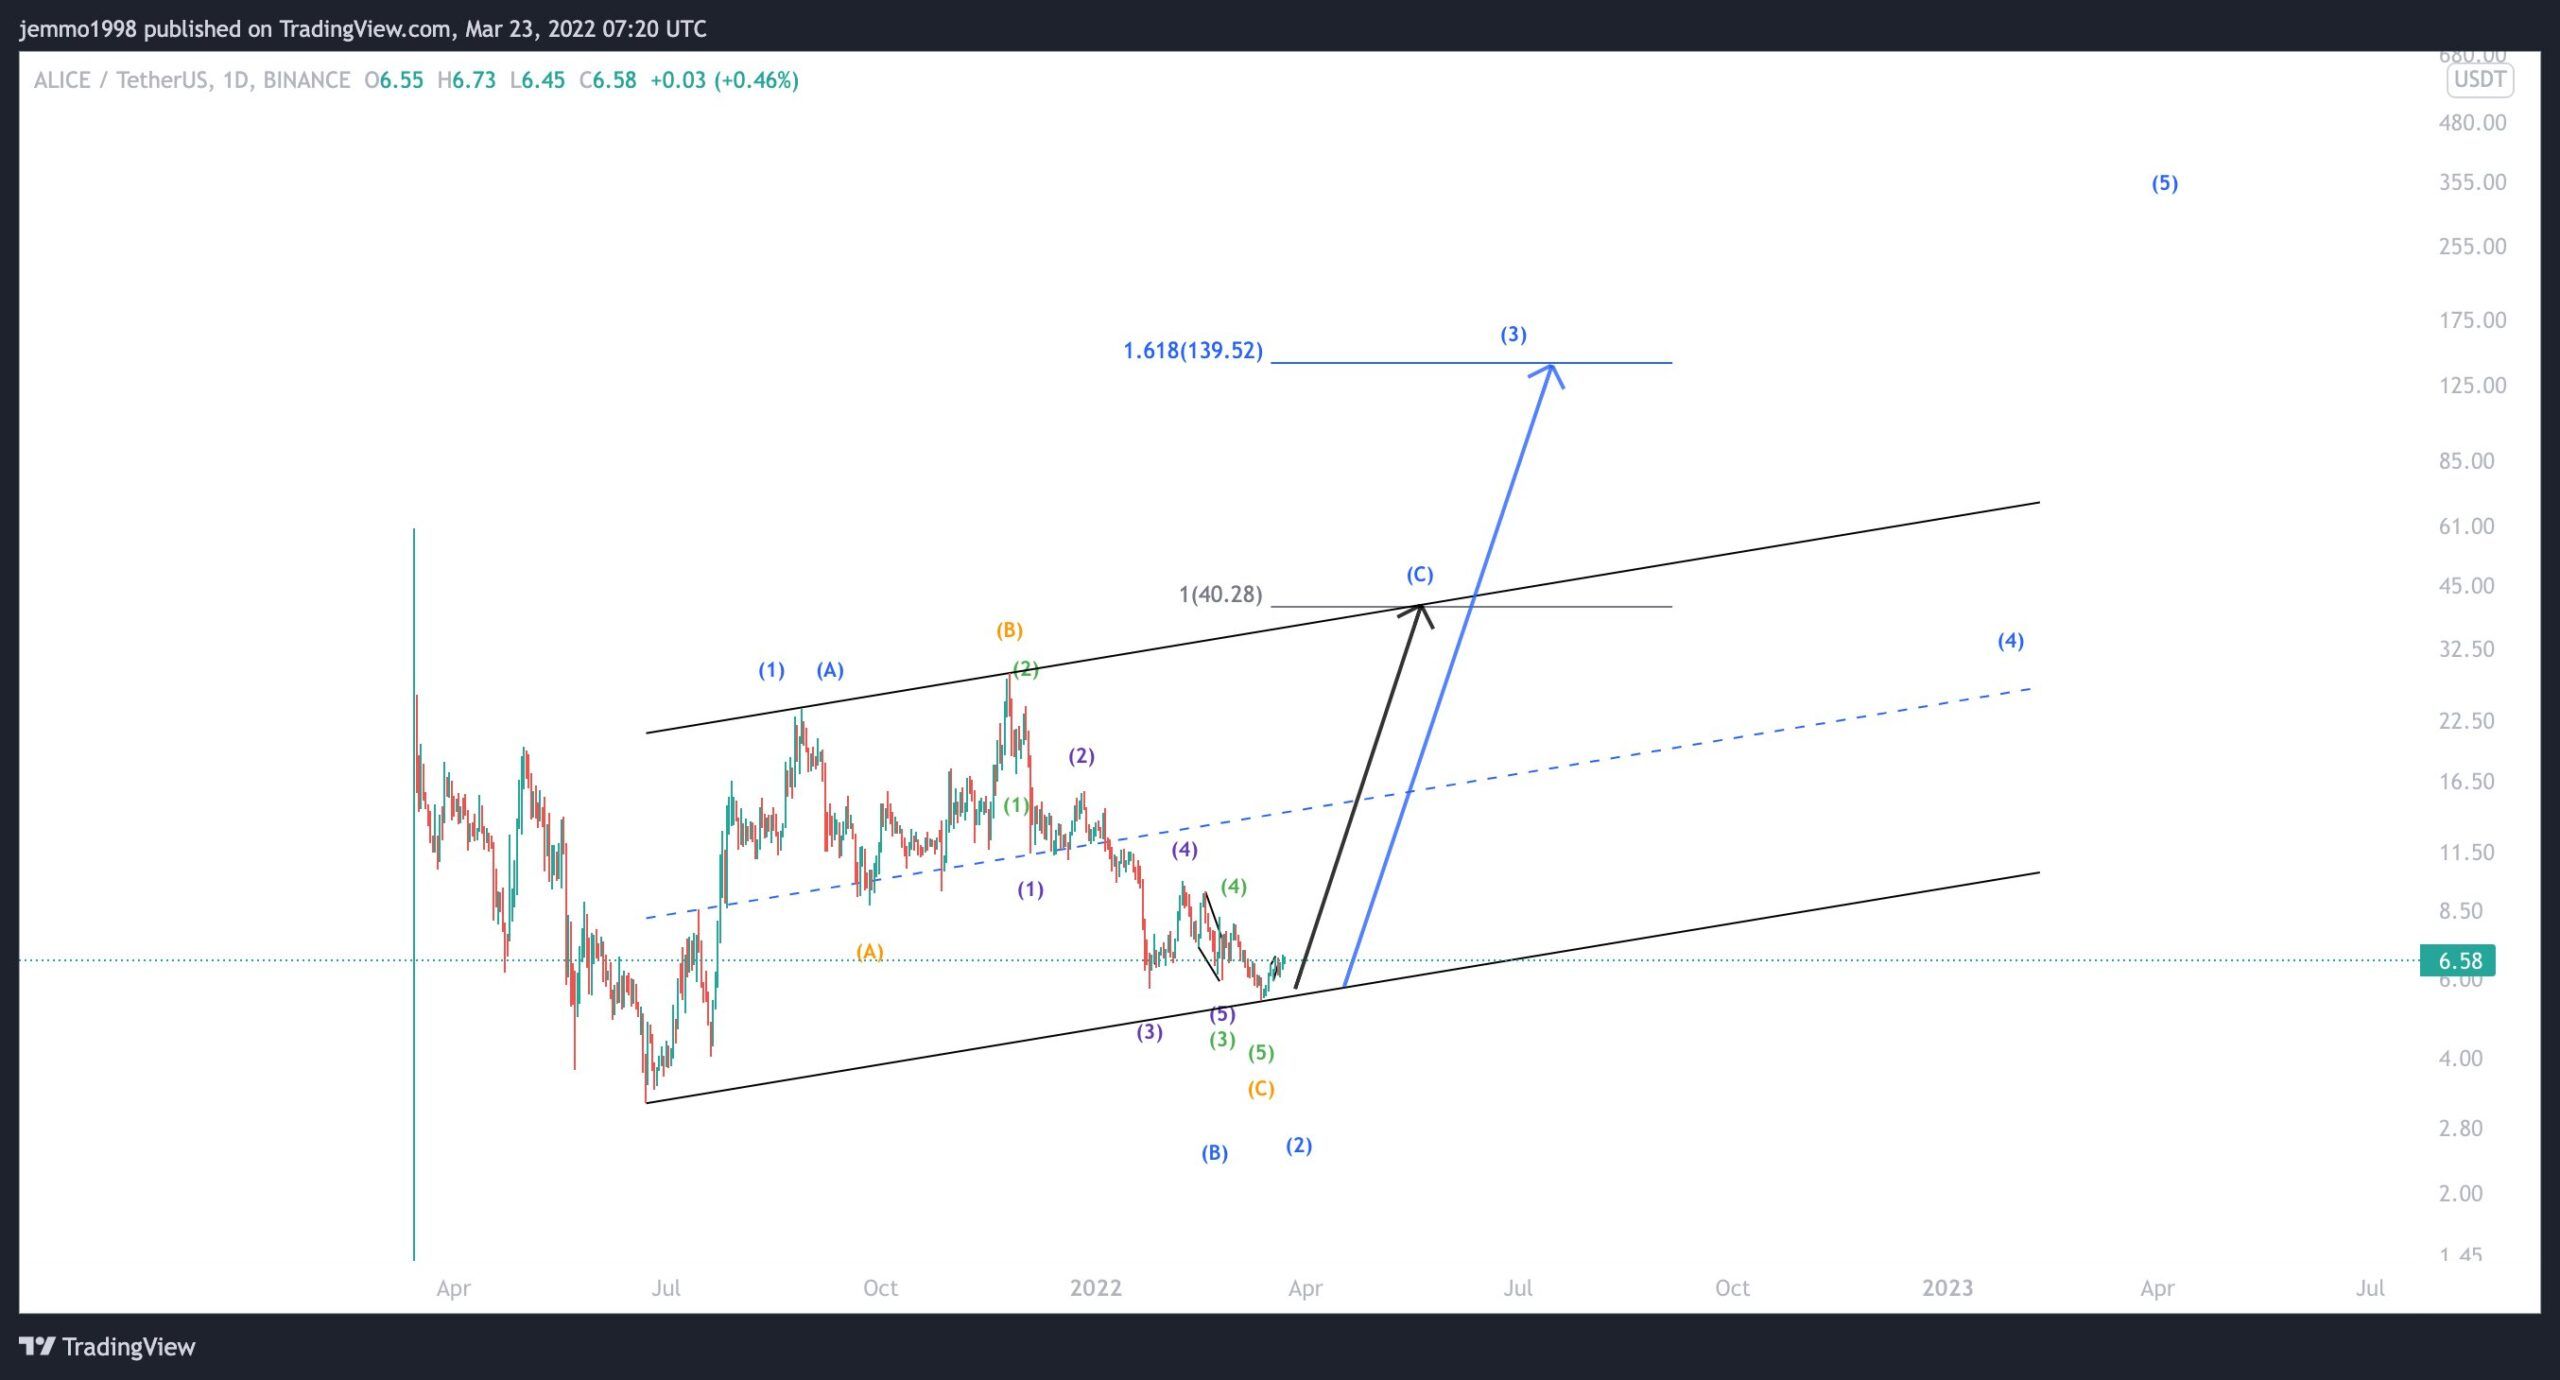
However, there are several possibilities as to the future wave count.
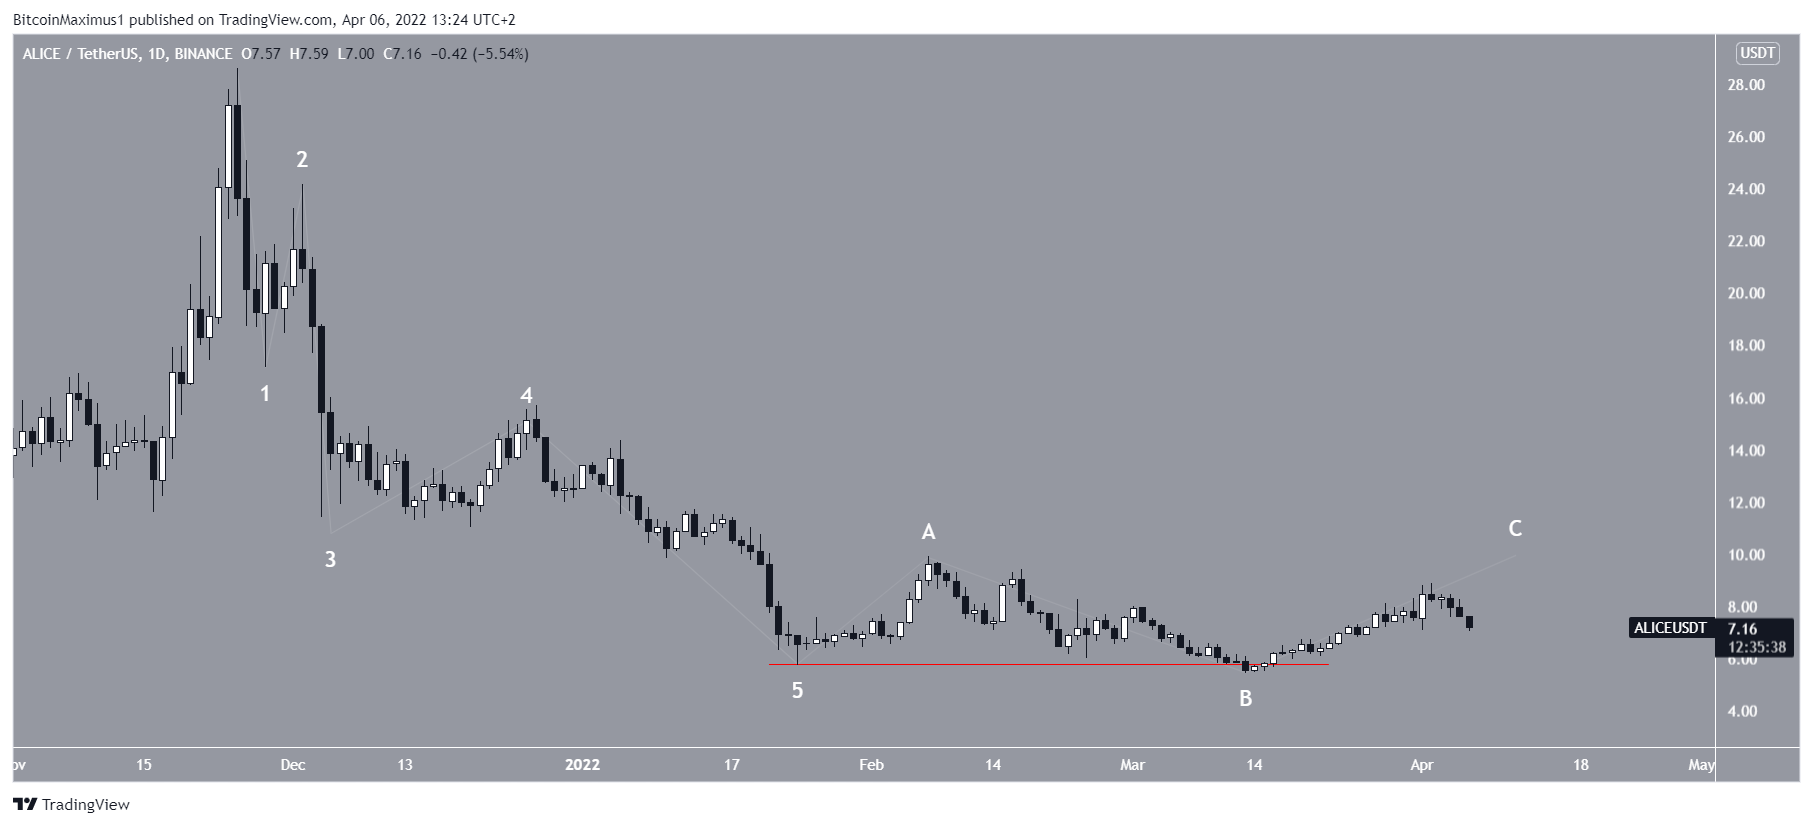
The movement from the all-time high to the Jan 24 low resembles a five-wave downward movement.
Afterward, the March 14 low breaks the aforementioned Jan 24 lows (red line), invalidating the possibility that ALICE began a bullish reversal on Jan 24.
Therefore, it is possible that the entire ongoing upward movement is corrective, and new lows will follow.
For Be[in]Crypto’s latest Bitcoin (BTC) analysis, click here


