


The Algorand (ALGO) price has increased by 85% since August 12, when it broke out from a long-term resistance level.
Rapid Increase After Breakout
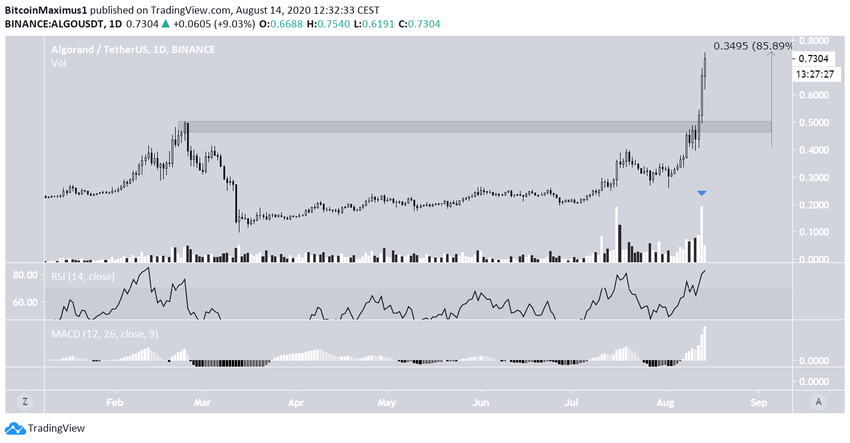
The ALGO price has been moving upwards since March 13. The increase was gradual until August 2, when the price reached a low of $0.259 and started to accelerate. It did so again on August 12, and the ALGO price has increased by 85% since then.
The price broke out above its March high on very high volume, increasing the legitimacy of the move.
Technical indicators show that the trend is still strong. While the RSI is overbought, it has not formed any type of bearish divergence yet. Similarly, the MACD is overextended, but has not shown a decrease in momentum yet.
Long-Term Movement
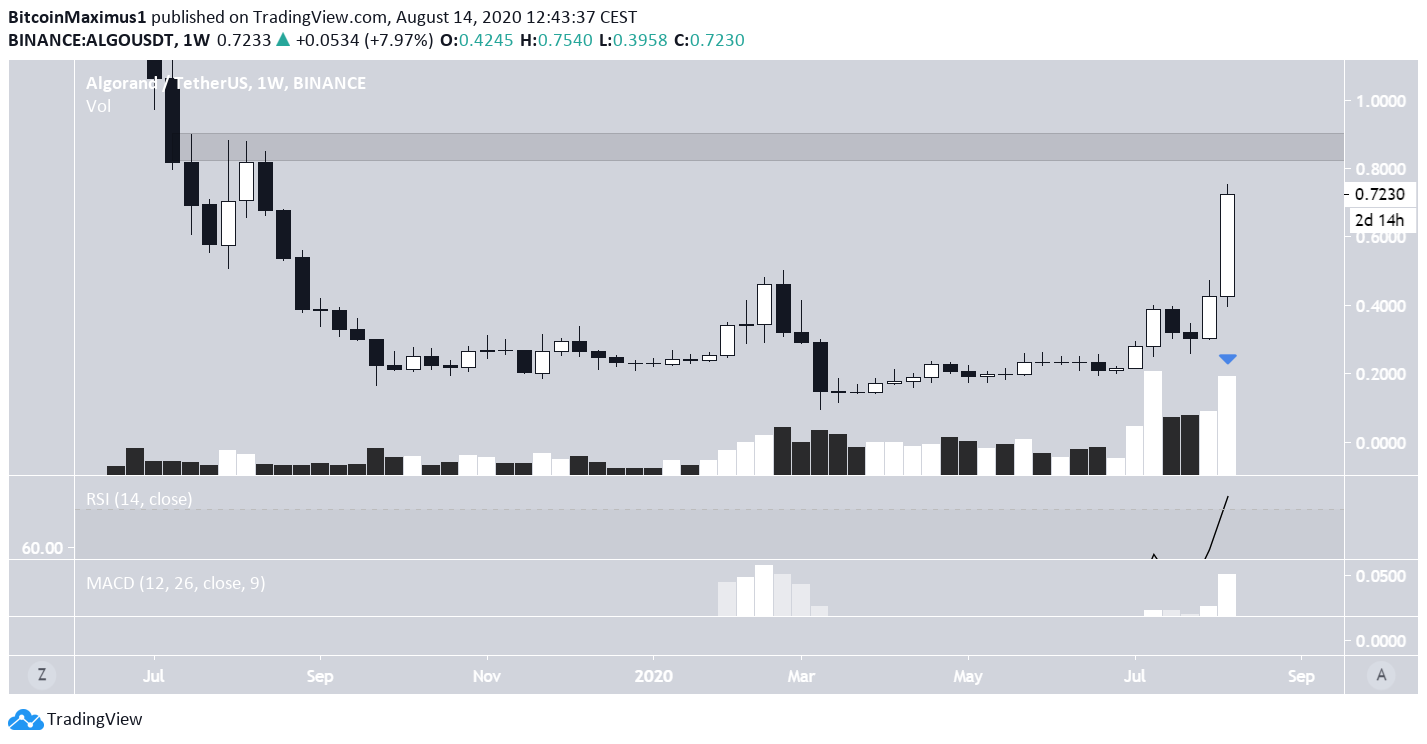
The weekly chart shows that the next resistance level is found at $0.85. Similar to the daily indicators, the weekly ones show that while the trend is overextended, there are no bearish divergences yet.
Considering that the current week has the highest volume since the beginning of 2019, the price is likely to continue moving higher before reaching the resistance level.
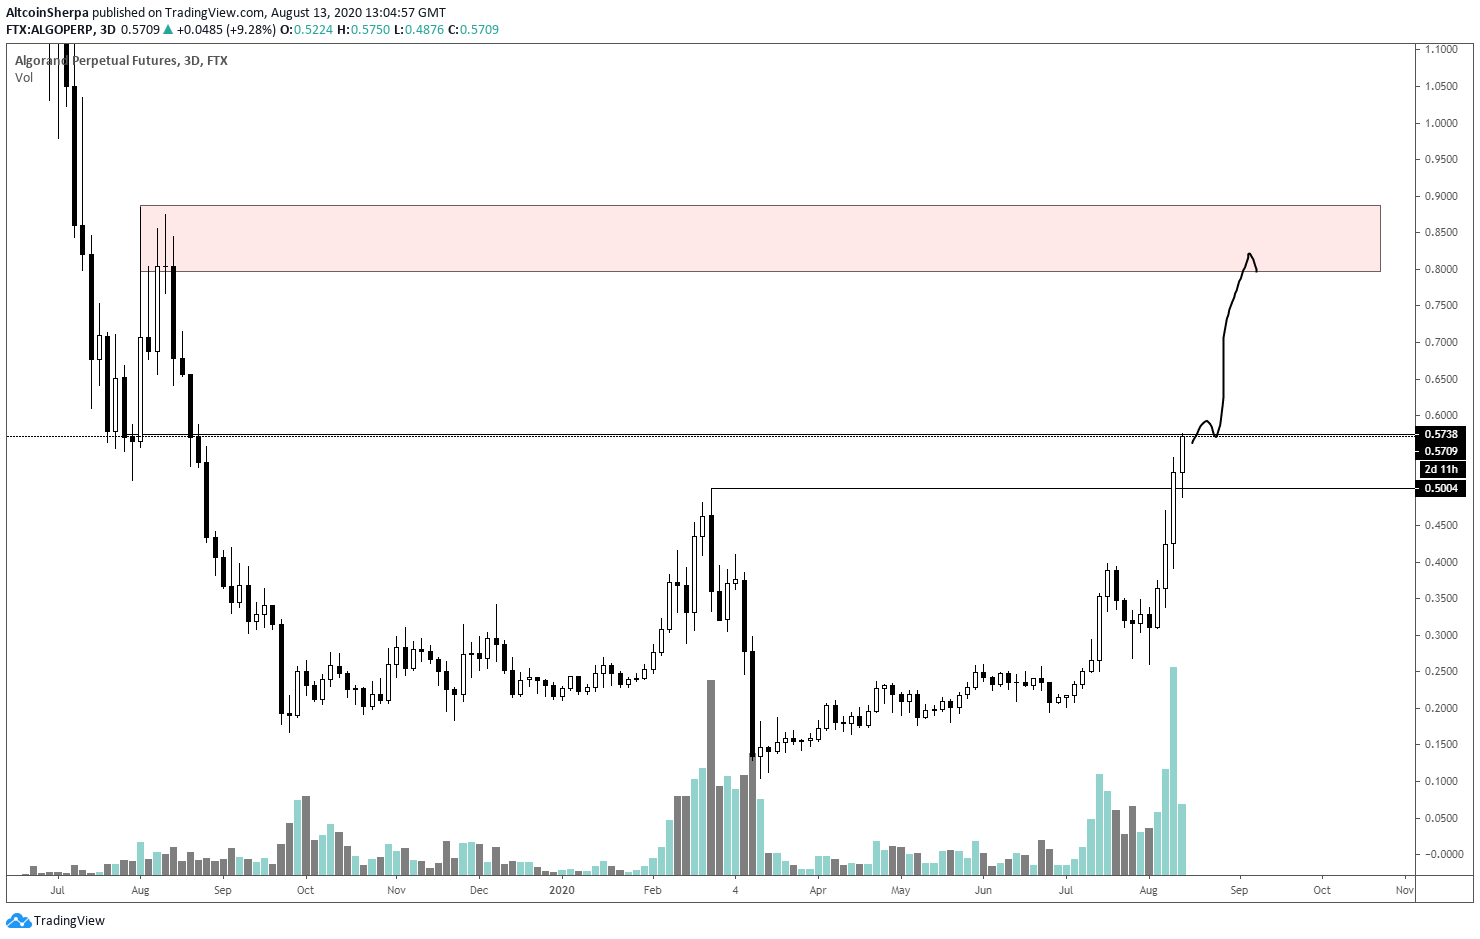
Cryptocurrency trader @altcoinsherpa stated that the ALGO price is likely to continue increasing, giving a target of $0.85, which fits with our long-term resistance area.
$ALGO: Good with both pairs, I think the BTC pair will hit some resistance coming up soon. Planning on still trading this one daily. #ALGO #ALGORAND
ALGO Wave Count
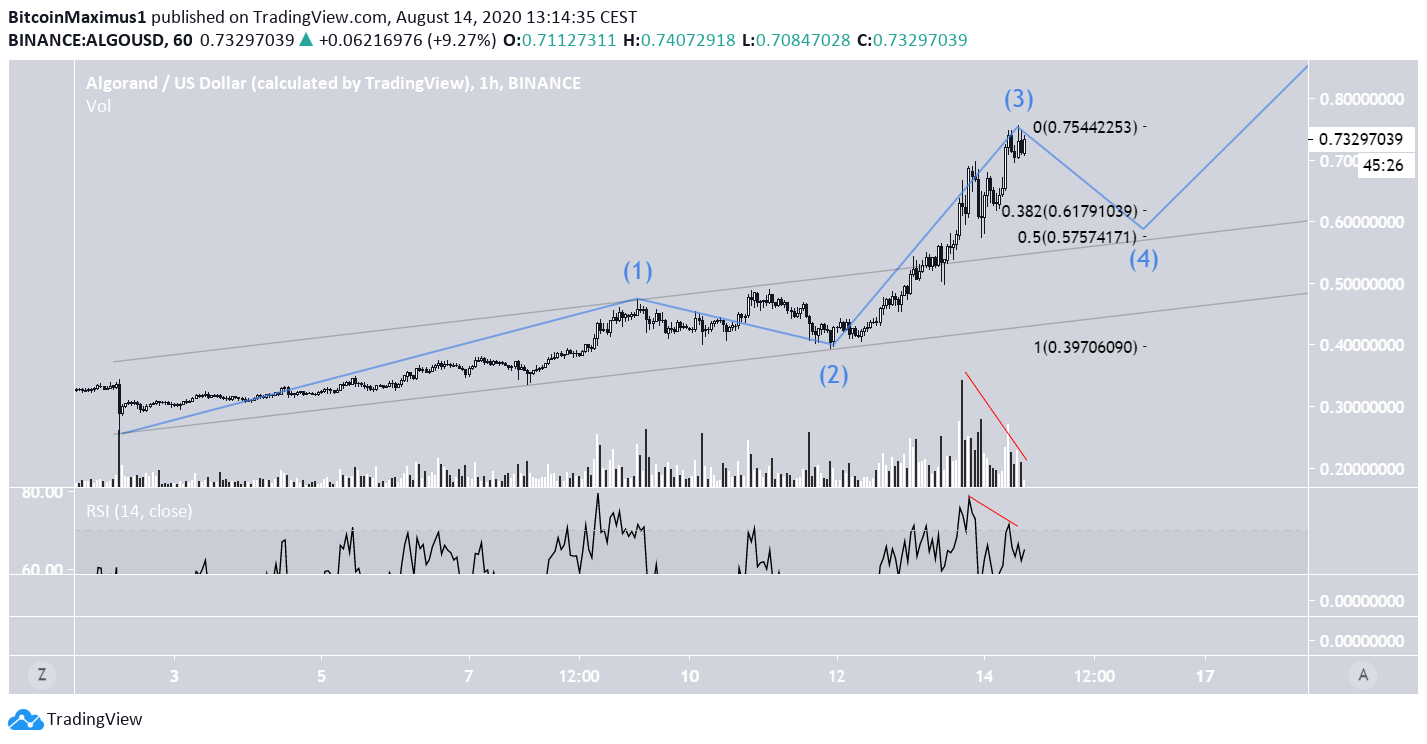
Since the previous August 2 low, it’s possible that ALGO has begun a five-wave impulsive formation, currently having just completed wave 3. The bearish divergence on the RSI and decreasing volume are signs that wave 3 is near a top or has already reached one.
Since the wave 2 correction was deep (reached the 0.618 Fib level), it would make sense for the wave 4 one to be shallower, ending between the 0.382 – 0.5 Fib levels of the entire wave, found at $0.575 – $0.617.
This level would also be near the resistance line of the parallel channel found when connecting the lows of waves 1 and 2 and projecting it to the top of wave 1.
To conclude, the ALGO price is likely in a long-term upward trend. The trend should resume after a possible short-term correction.


