
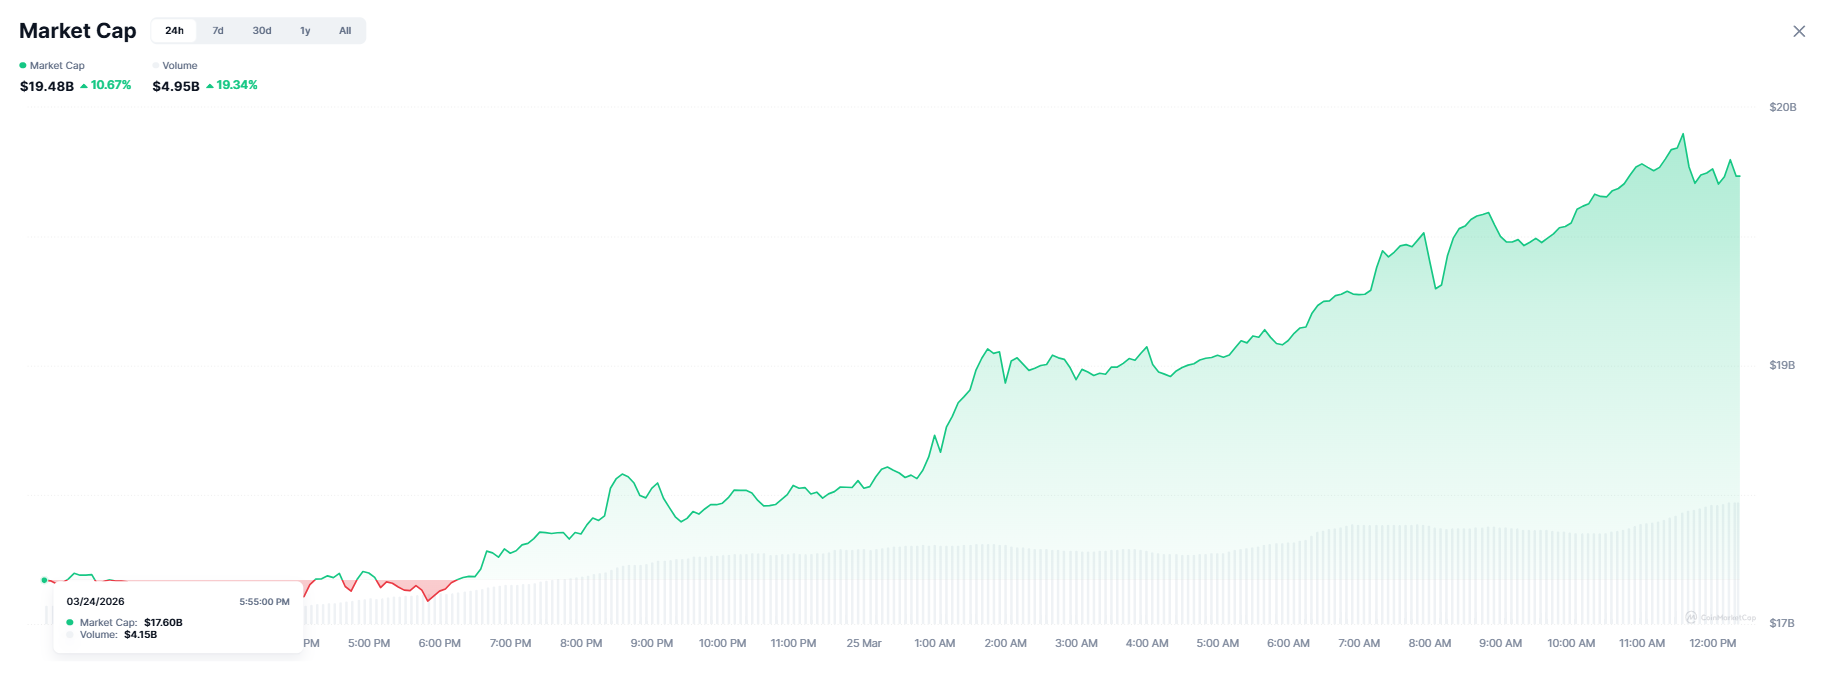
The AI crypto sector surged 10.67% on March 25, 2026, pushing the combined market cap from $17.60 billion to $19.48 billion within a single session. Trading volume climbed 19.34% to $4.95 billion alongside the move, confirming the rally is backed by real participation rather than thin-market price inflation.
In line with the same, BeInCrypto has analysed three AI crypto coins that have surpassed expectations in the last 24 hours.
AI Crypto Market Surges
The catalyst is macro. President Trump’s five-day halt on strikes against Iran triggered a broad risk-on shift across global markets. Oil prices dropped sharply, S&P 500 futures rallied, and crypto followed.
Within the crypto market, AI tokens — which had been under sustained selling pressure through much of Q1 — responded with outsized gains. This is because the risk appetite returned and narrative-driven capital rotated back into the sector.
Want more token insights like this? Sign up for Editor Harsh Notariya’s Daily Crypto Newsletter here.
Grayscale’s research arm had already flagged AI tokens as one of the two sectors showing relative resilience through Q1 2026, and today’s move confirms that positioning is beginning to pay off.
Artificial Superintelligence Alliance (FET)
Fetch.AI (FET) is trading at $0.2551 on the daily chart, up 5.20% on the day after recovering from a low of $0.2409. The Fibonacci retracement grid runs from the cycle low at $0.1398 to the swing high at $0.2569. Price is pressing toward the 1.0 extension level, with a prior annotated measured move of 70.59% already completed from the $0.1398 base.
The On-Balance Volume (OBV) indicator is the most significant signal on this chart. OBV has been trending higher along a clear ascending trendline throughout March, currently sitting at 7.55 billion.
Critically, OBV has maintained its upward trajectory even during the periods when the price pulled back between March 17 and March 23. That pattern — rising OBV into price weakness — indicates that buyers absorbed selling pressure without retreating, a hallmark of genuine accumulation rather than speculative momentum.
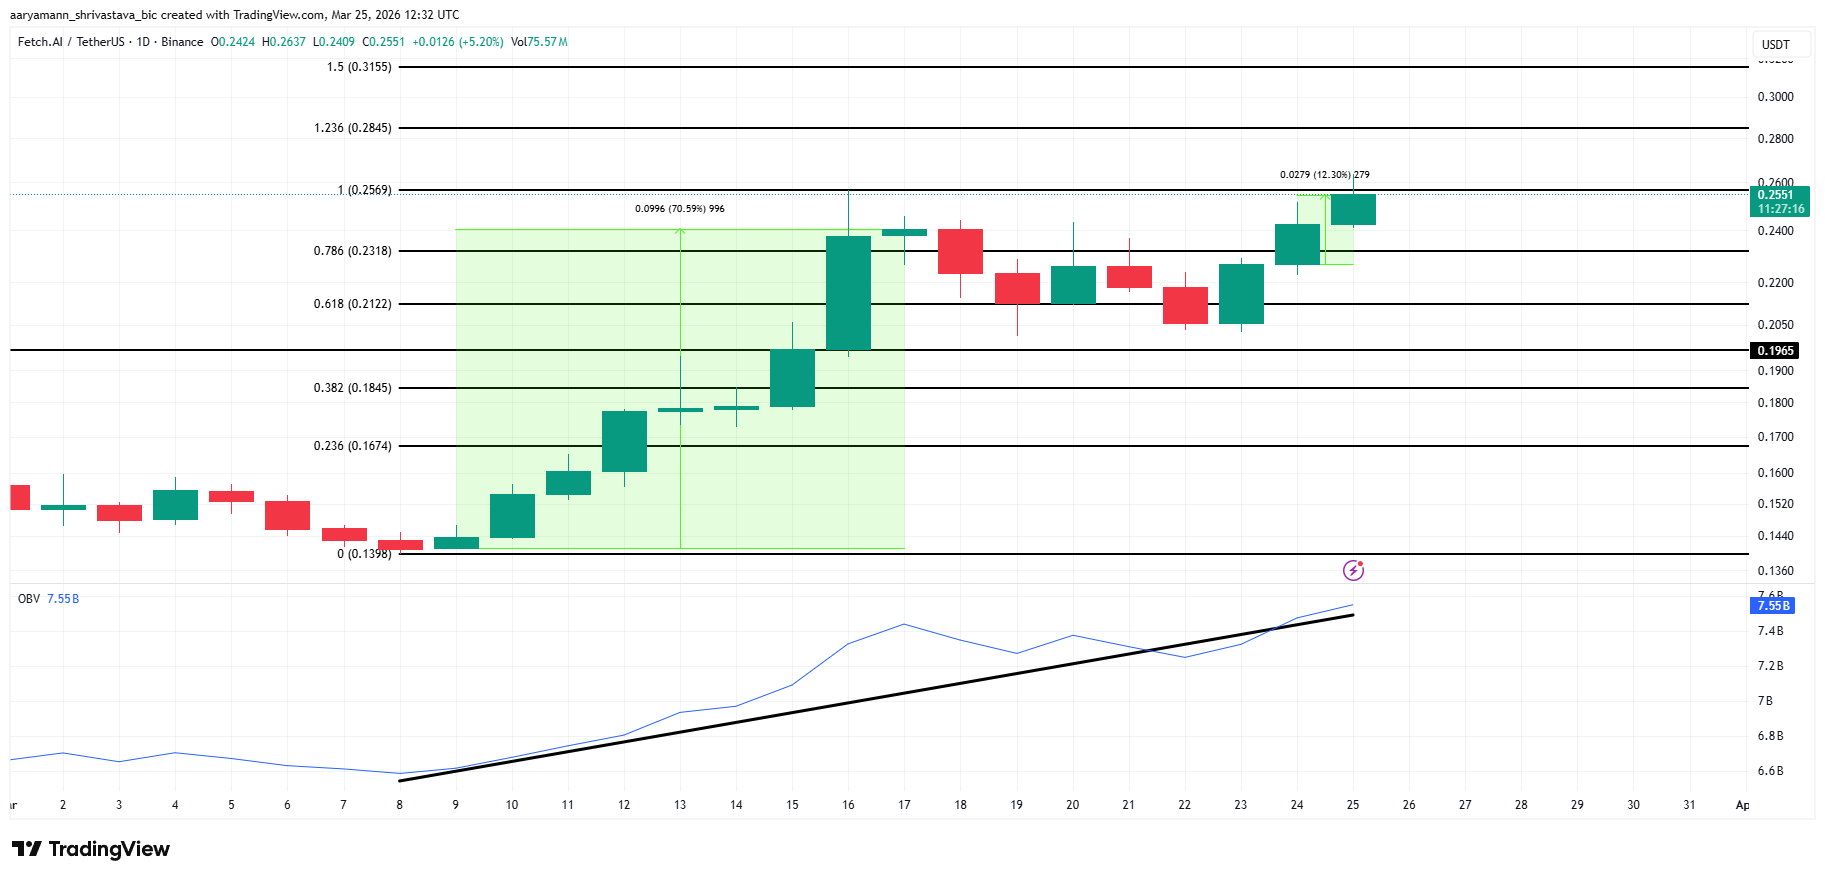
For the bullish case to extend, FET needs a daily close above the $0.2569 level, which is the 1.0 Fibonacci extension and the prior swing high. Above that, the 1.236 extension at $0.2845 and the 1.5 extension at $0.3155 are the next targets in sequence.
The invalidating scenario is a daily close below $0.1965, the horizontal support level visible on the chart. A loss of that floor would suggest the recovery structure has broken down and bring the $0.1845 zone into view.
Siren (SIREN)
Another one of the crypto coins performing well today is SIREN, which is trading at $2.37, up 132.02% on the session — one of the strongest single-day moves in the AI sector. The daily chart shows price reclaiming the $2.00 level after the annotated 67.10% drop to $0.83, and the Money Flow Index (MFI) sits at 76.38, firmly in overbought territory.
However, the Chaikin Money Flow (CMF) reading of -0.12 tells a more cautious story. Despite the explosive price surge, CMF remains negative. Its descending trendline from the prior high shows that buying volume has not dominated the recent action in dollar-weighted terms. This divergence between the price spike and negative CMF is a warning.
The altcoin now stands 120% away from reaching its all-time high of $4.72. This ATH was established over the weekend and is not too far from the SIREN price.
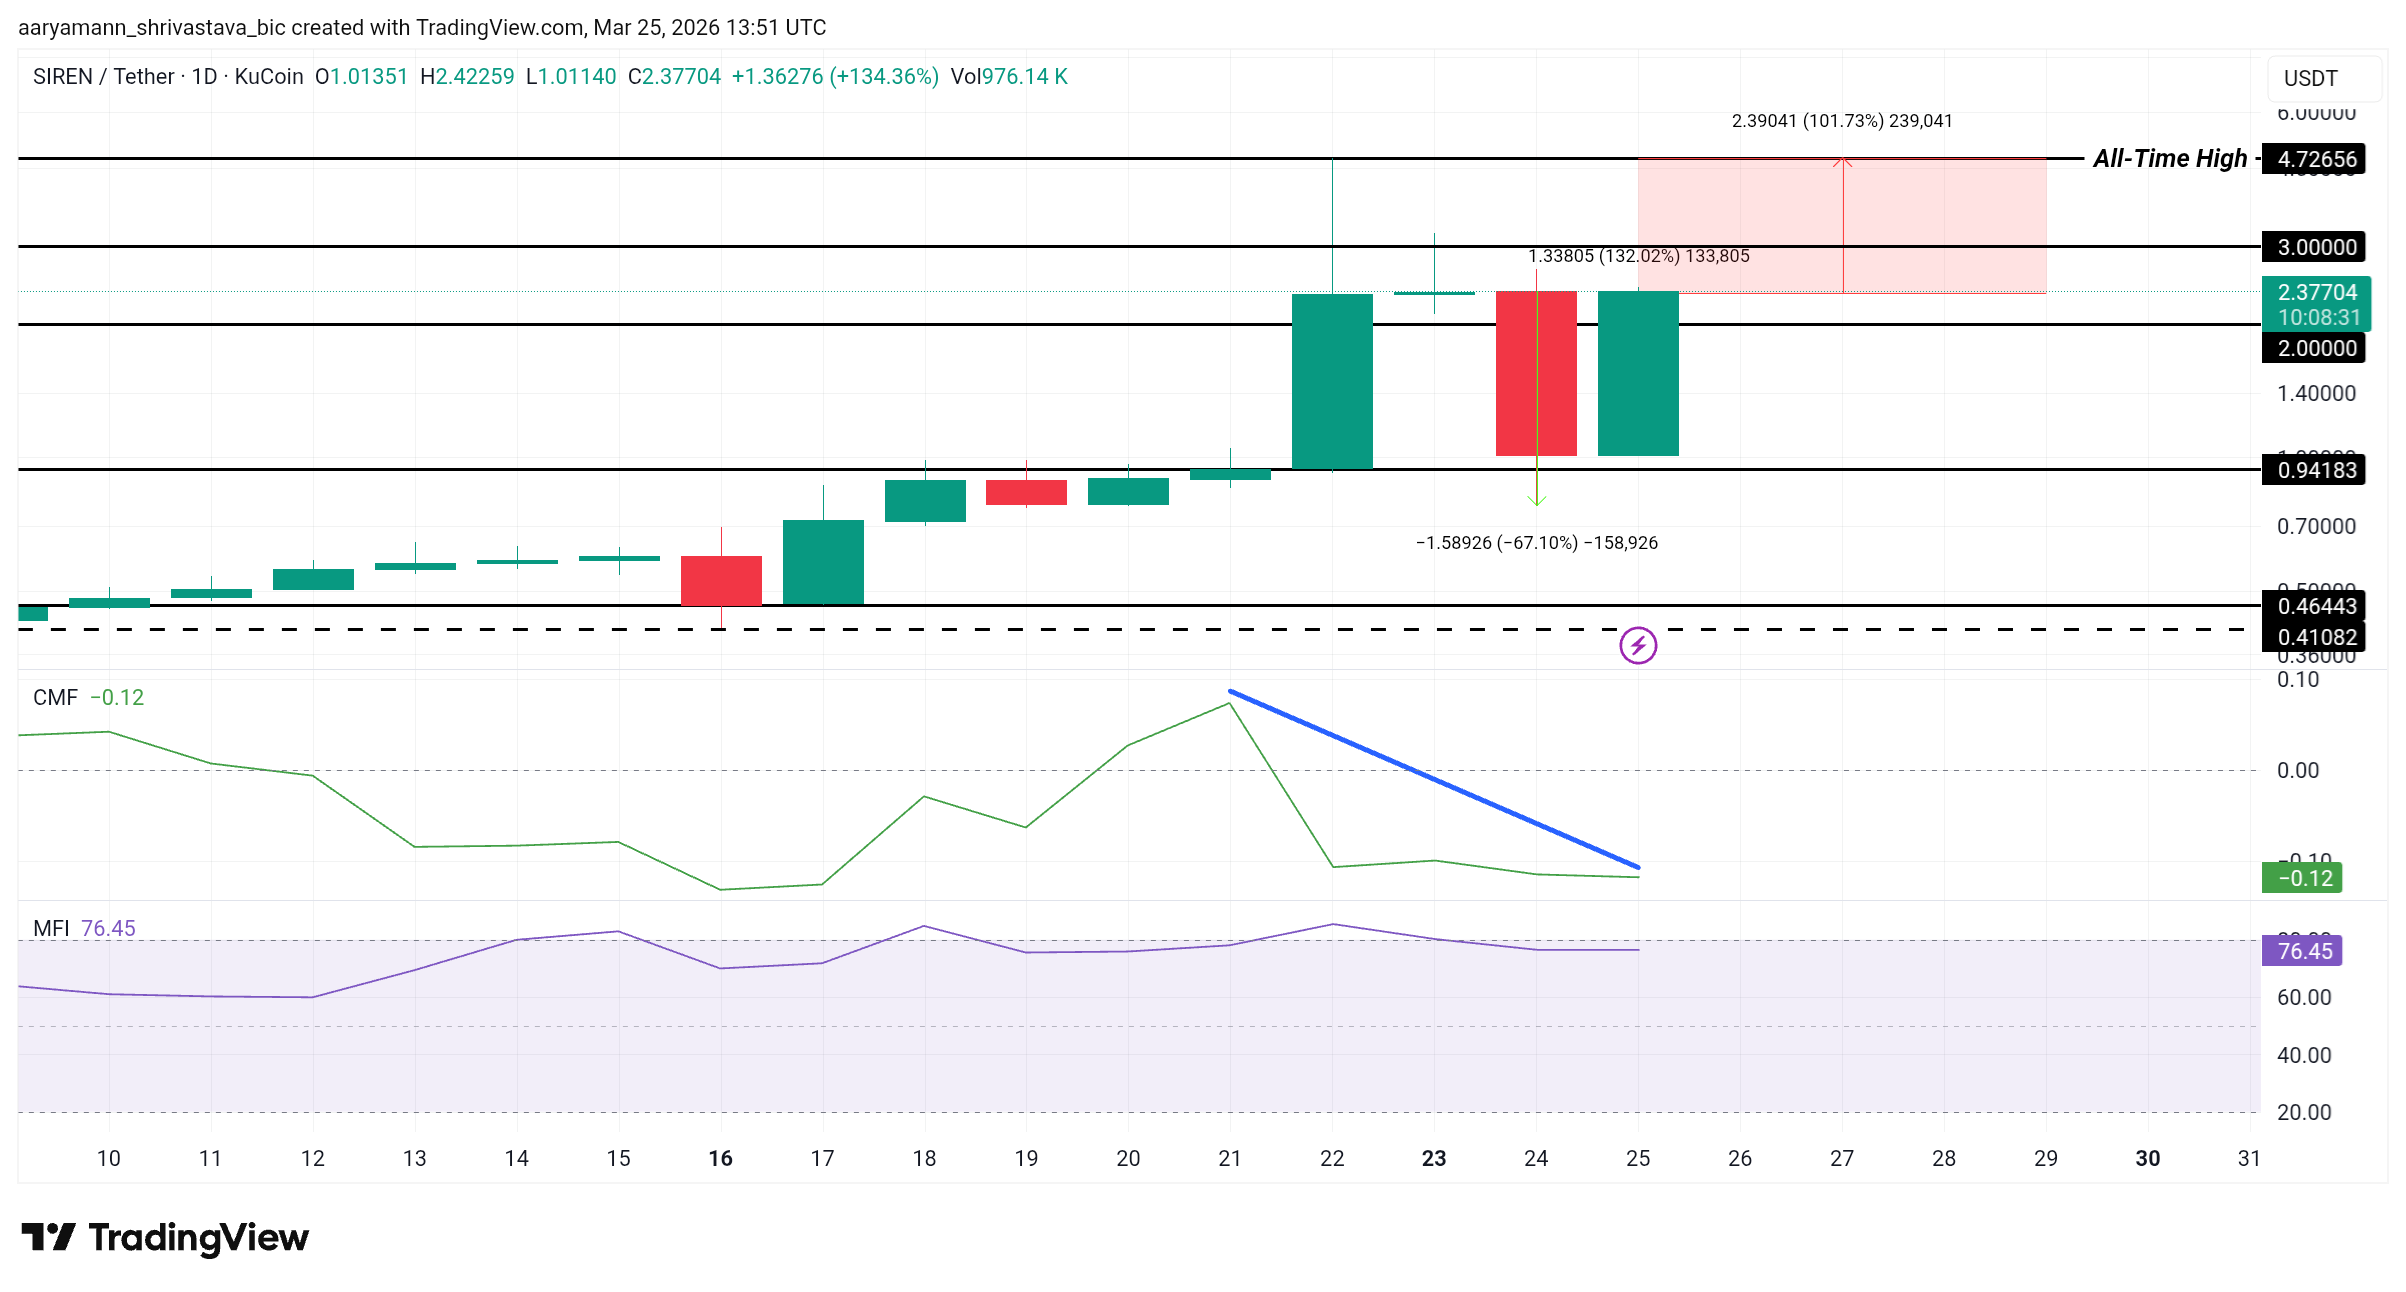
The bullish thesis targets a move toward $2.59, contingent on SIREN holding above the $2.00 level on any pullback. The ascending blue trendline on the price chart, which has provided support through the entire rally from $0.40, now sits near $1.10 and functions as the structural floor.
The invalidation scenario is a daily close below $0.94. That level served as support during the prior consolidation. Losing it would suggest the 110% rally was an exhaustion spike rather than the start of a sustained trend. With MFI at 76.38, a brief consolidation before continuation is the more probable near-term path.
Bittensor (TAO)
Bittensor (TAO) is trading at $355, having broken decisively above the 61.8% Fibonacci retracement level at $306. The Fibonacci grid spans from the cycle low at $142 to the prior high near $589. The chart annotates the current move as a 21.07% measured gain from the breakout zone, with the price reaching $355.
The two exponential moving averages tell a converging story of a potential Golden Cross ahead. The 50-day EMA (blue) sits at $269, and the 200-day EMA (red) sits at $233. Both are now below the current price, and TAO has cleared them cleanly.
After spending months below both moving averages during the December through February correction, the recovery above both EMAs in March represents a structural regime change from bearish to bullish.
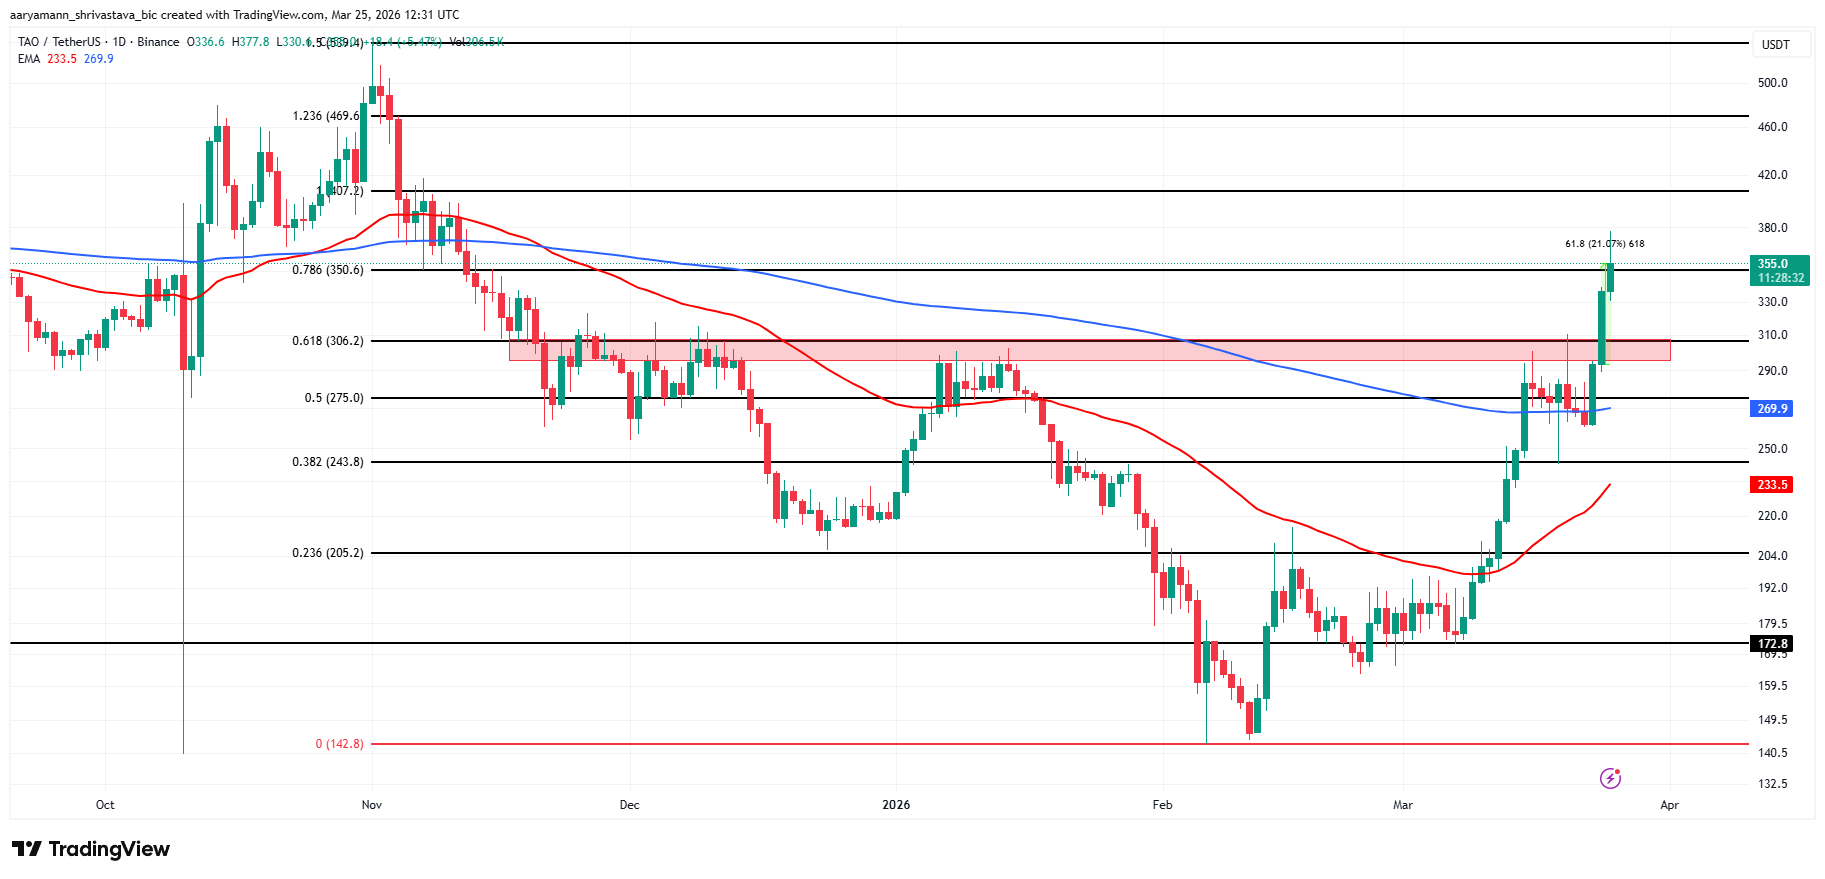
The red demand zone is between approximately $285 and $310. This acted as resistance throughout December and January, and has now flipped to support.
TAO tested this zone on the March 24 pullback and held, validating the breakout. The next targets above the current price are the 78.6% Fibonacci level at $350. This would be followed by the 1.0 extension at the prior high near $407. The ultimate target would be the 1.236 extension at $469.
The Grayscale TAO ETF filing remains a structural catalyst that has not yet been fully priced into the market. The invalidation scenario is a daily close back below $306. That would confirm the 61.8% breakout was a fakeout.
This would put the 50% level at $275 and the 0.382 level at $243 back in focus as the next supports.
