The Zcash (ZEC) price has broken out from an important resistance area and validated it as support afterward. The price should continue moving upwards and create a new yearly high.
Long-Term Movement
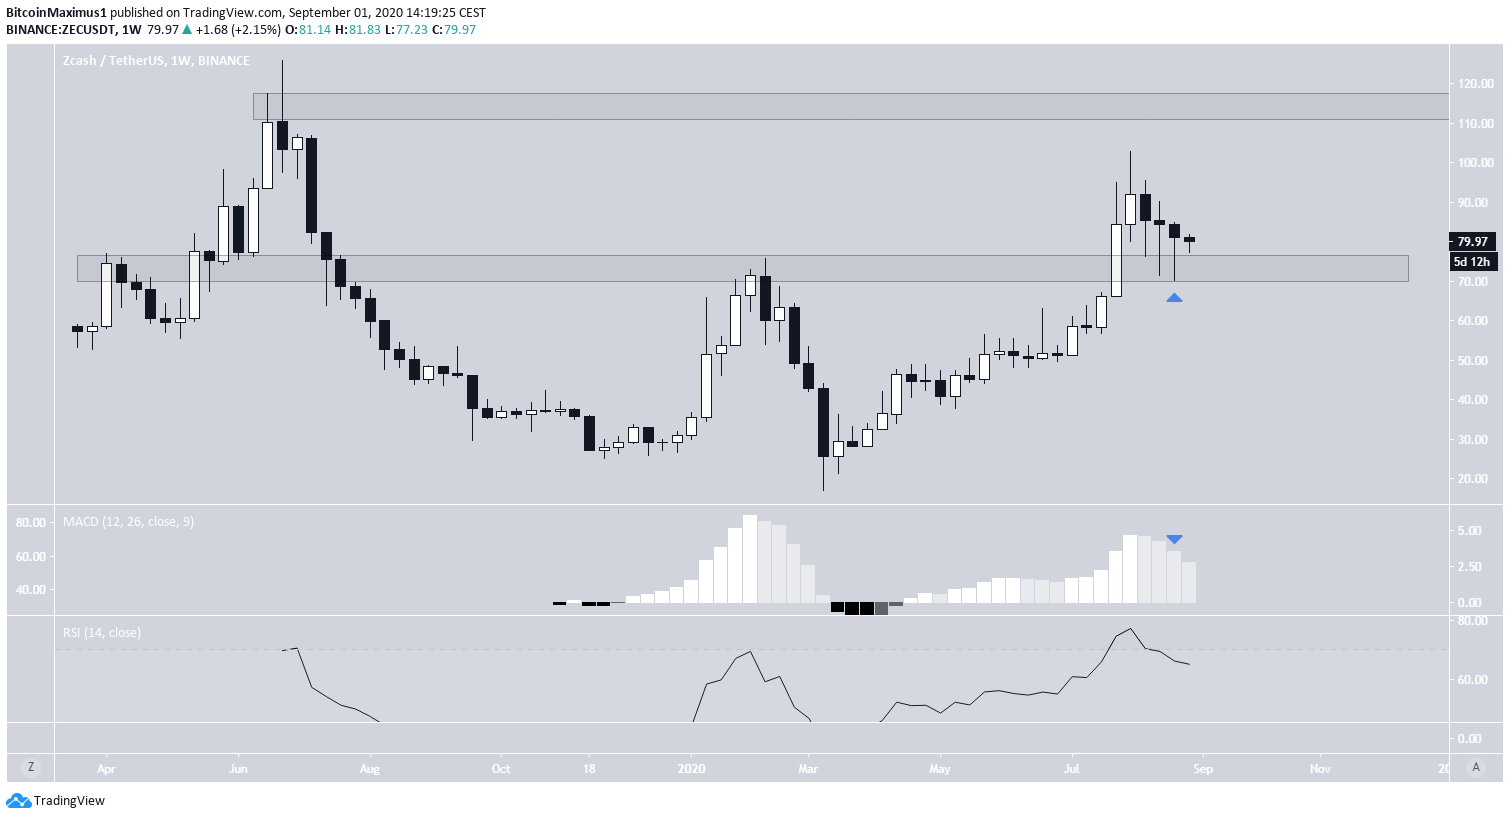
The weekly chart shows that ZEC has broken out above the $77.50 resistance area and validated it as support afterward, creating numerous long lower wicks. The same area acted as the top during the March move. If the price continues moving upwards, the next resistance area is found at $115.
Technical indicators provide a mixed outlook. While both the MACD and RSI are increasing, the former is giving a bearish signal. There is, however, no bearish divergence nor is the RSI overbought.
Breakout From Resistance
Cryptocurrency trader @TheCryptoDog stated that the ZEC price has broken out, and due to the upcoming halving, is likely to move upwards quickly.
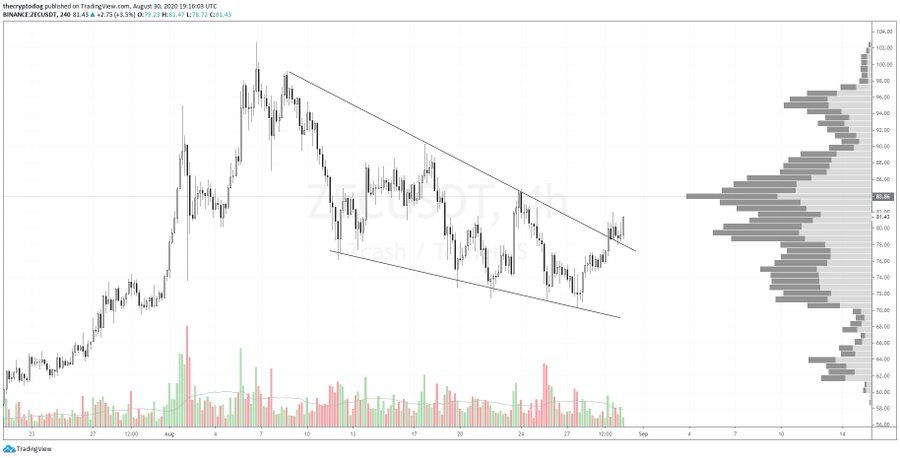
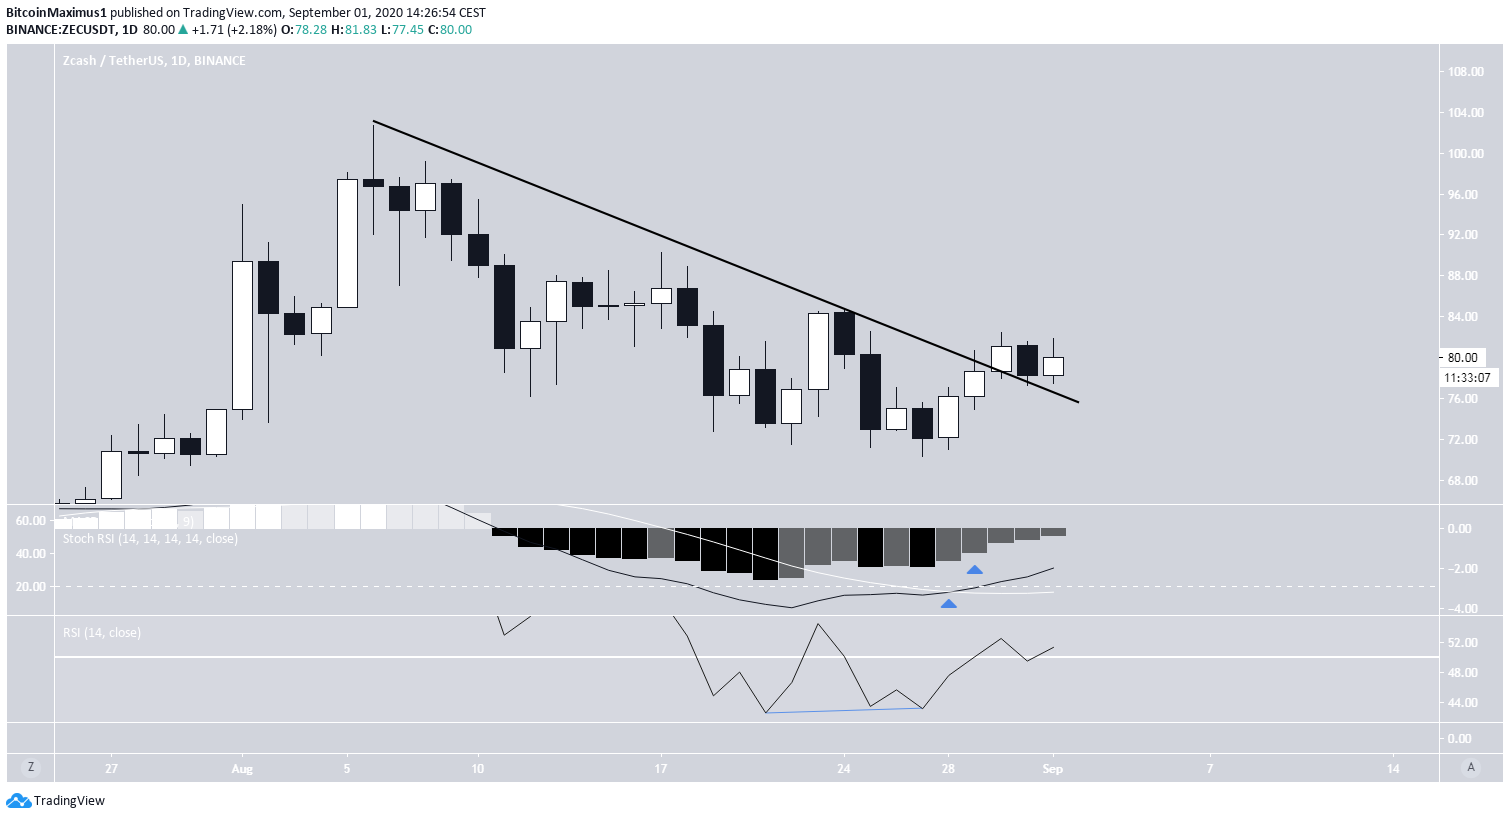
Indeed, ZEC has broken out from a descending resistance line that had been in place since the August 6 highs and validated it as support afterward.
Technical indicators are bullish. There is bullish divergence on the daily RSI, and the stochastic RSI has made a bullish cross and moved above the oversold region. Furthermore, the MACD has given a bullish reversal signal.
These are signs that the price is likely to continue moving upwards towards the previous resistance area.
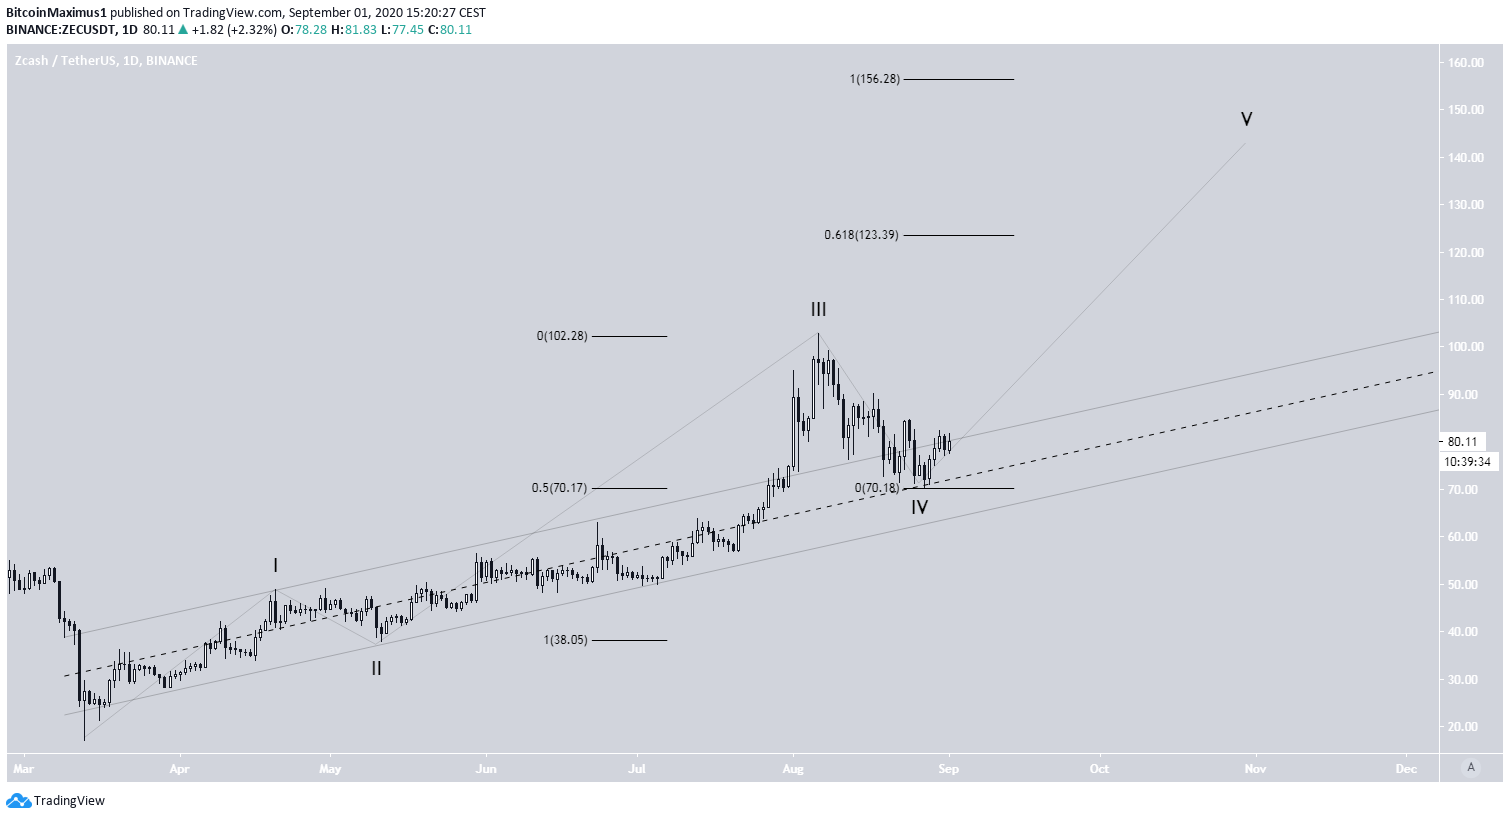
ZEC Wave Count
The ZEC price has likely begun an upward formation on March 13 and has currently completed wave 4. The $70.29 bottom on August 17 is very likely to be the bottom since it’s both the 0.5 Fib level of wave 3 and the middle of a parallel channel connecting the top and bottom of waves 1 and 2, respectively.
The two most common targets for the top of the fifth wave are the 0.618 and 1 Fib levels of waves 1 and 3, falling at $123 and $156, respectively.
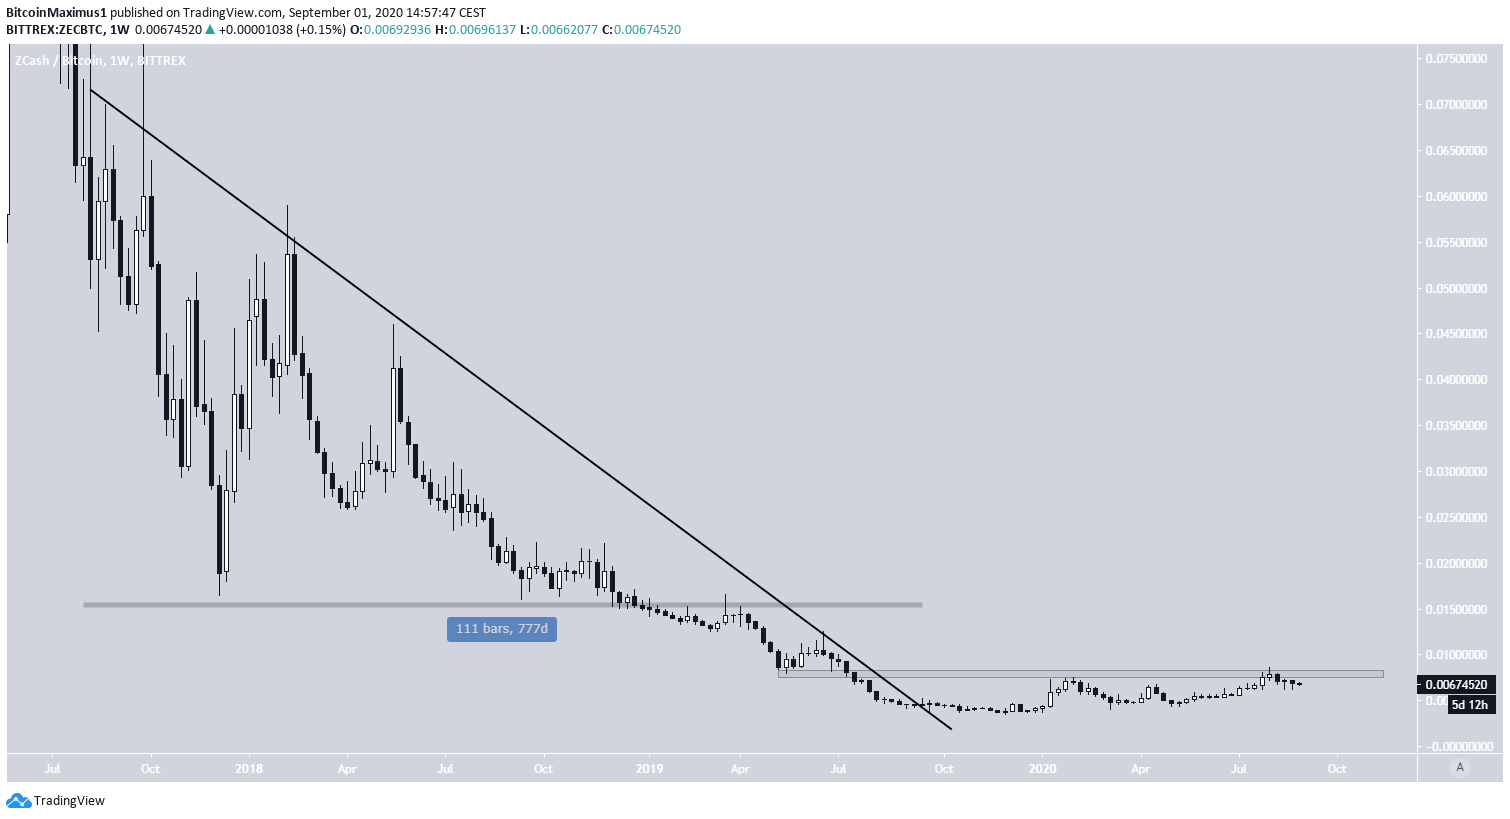
ZEC/BTC
The ZEC/BTC chart is also bullish. The price previously broke out from a descending resistance line that had been in place for 777 days. After consolidation for a period of time, ZEC is in the process of making its second breakout attempt from ₿0.0078.
If the price is successful in doing so, it should move upwards at an accelerated rate.