


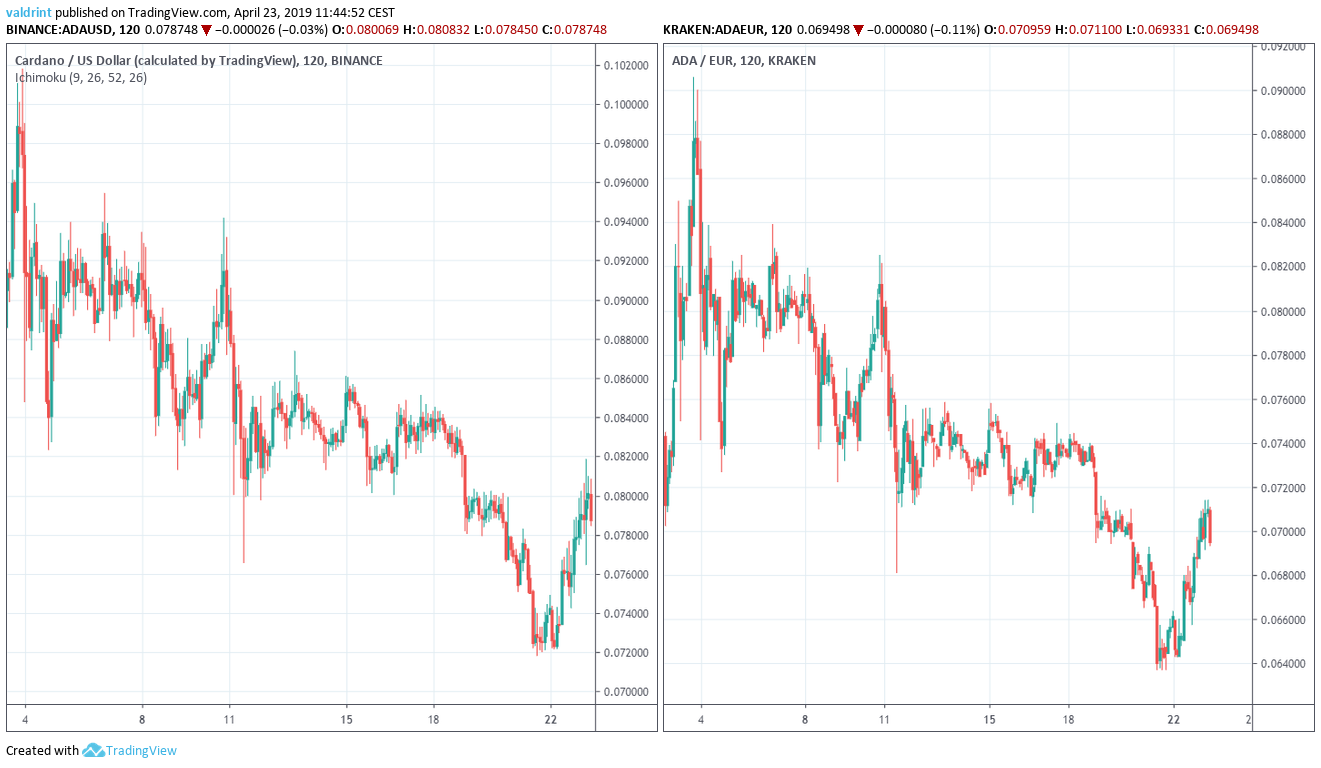
On Apr 2, Cardano initiated a rapid upward movement. By the end of the following, highs of over $0.1 and €0.09 had been reached.
A gradual decrease ensued with lows of $0.072 and €0.064 reached on Apr 22. Since the lows were reached, Cardano appears to have initiated another upward movement in both dollars and euros:
Let’s find out:
Cardano (ADA): Trends and Highlights for Apr 23, 2019
- Cardano reached a high on Apr 3 and has been on a downtrend since.
- It is trading inside a descending channel.
- Bearish divergence is developing in the RSI and the MACD.
- There is support near $0.075 and €0.065.
Descending Channel
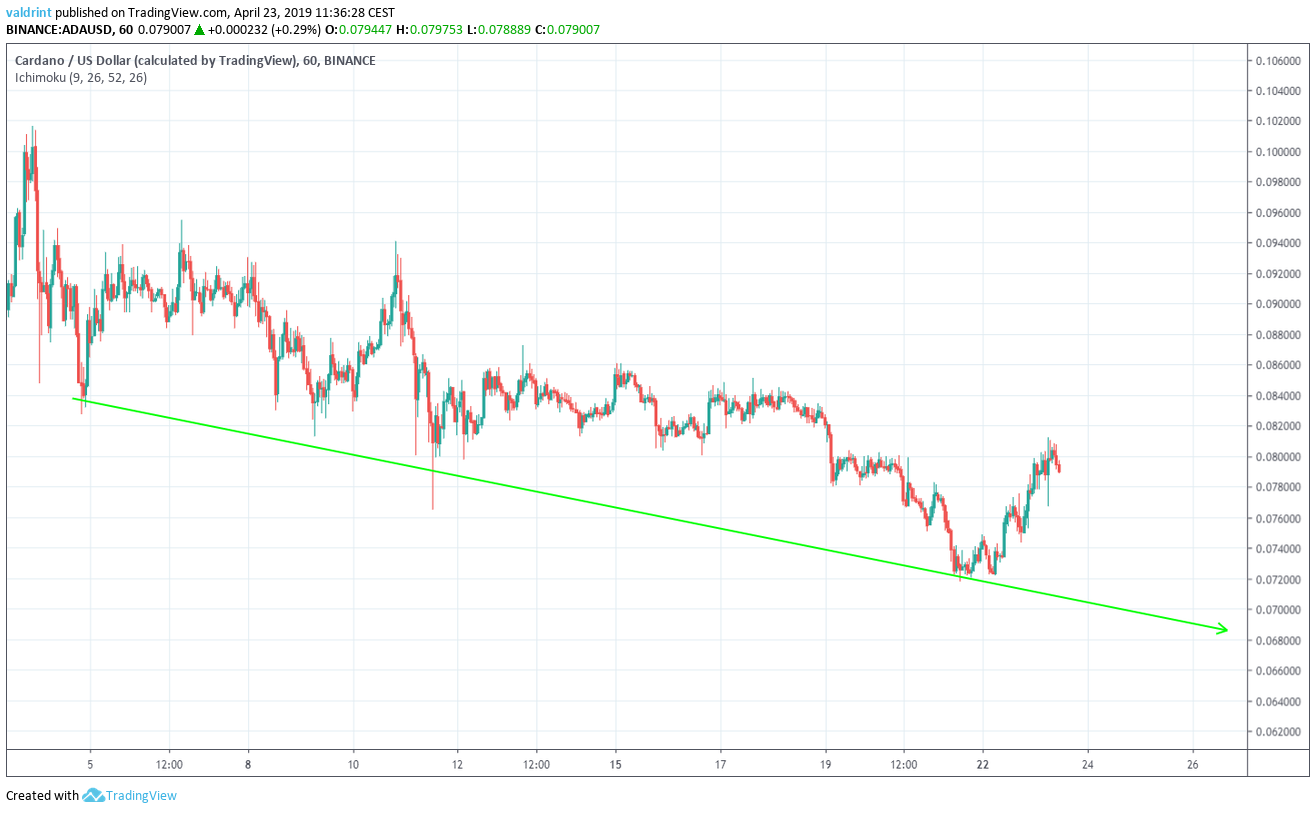
On Apr 4, the price reached a low of $0.082. Several market cycles have been completed since. The price has continuously created lower lows.
Tracing these lows gives us a descending support line:
On Apr 4, the price made a high of $0.1017. A gradual drop was followed by a gradual increase. The price has reached several lower highs.
Tracing these highs gives us a descending resistance line. The resistance and support lines combine to create a descending channel:
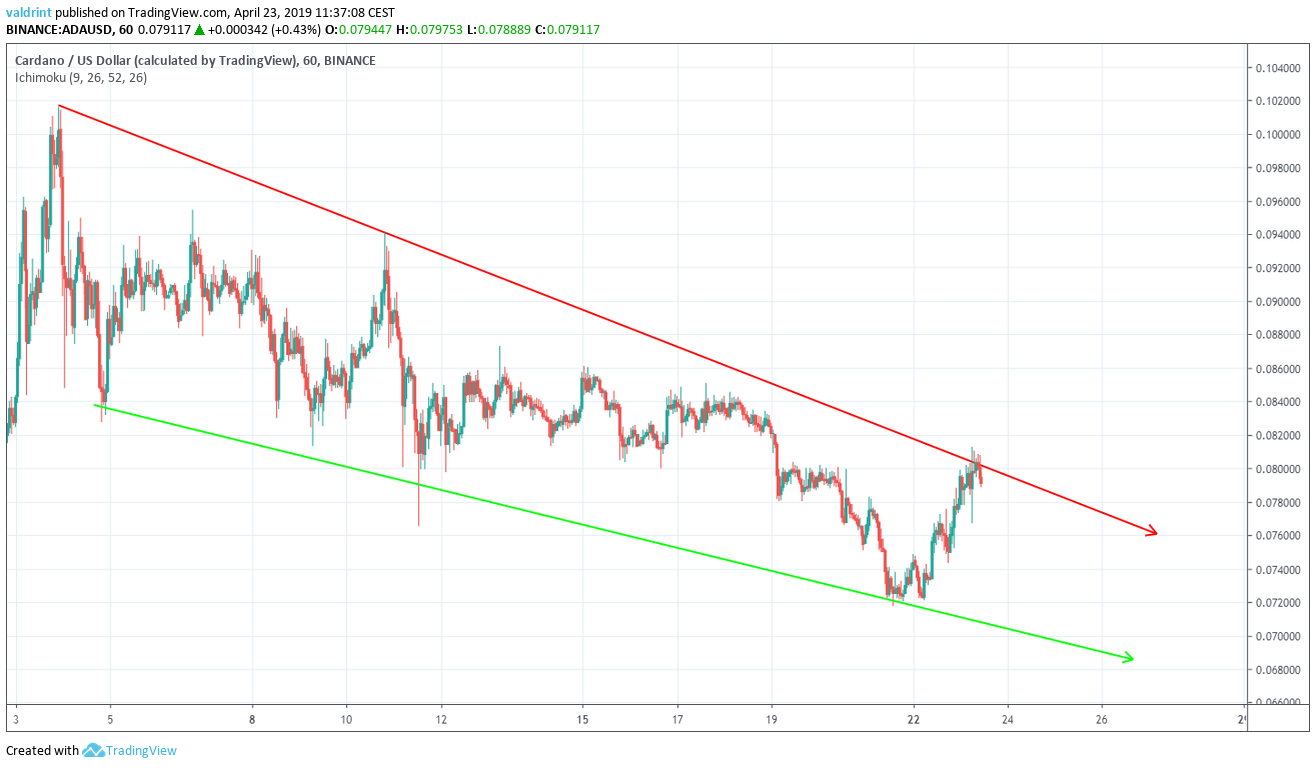
It is likely that the price will keep trading inside the confines of this channel until a decisive move occurs.
In order to figure out the direction of the move, we need to take a look at a longer time-frame combined with technical indicators.
What Do the Technical Indicators Reveal?
In this section, we analyze the price of ADA at one-hour intervals from Apr 19 to Apr 23 alongside the RSI and the MACD.
The relative strength index (RSI) is an indicator which calculates the size of the changes in price in order to determine oversold or overbought conditions in the market.
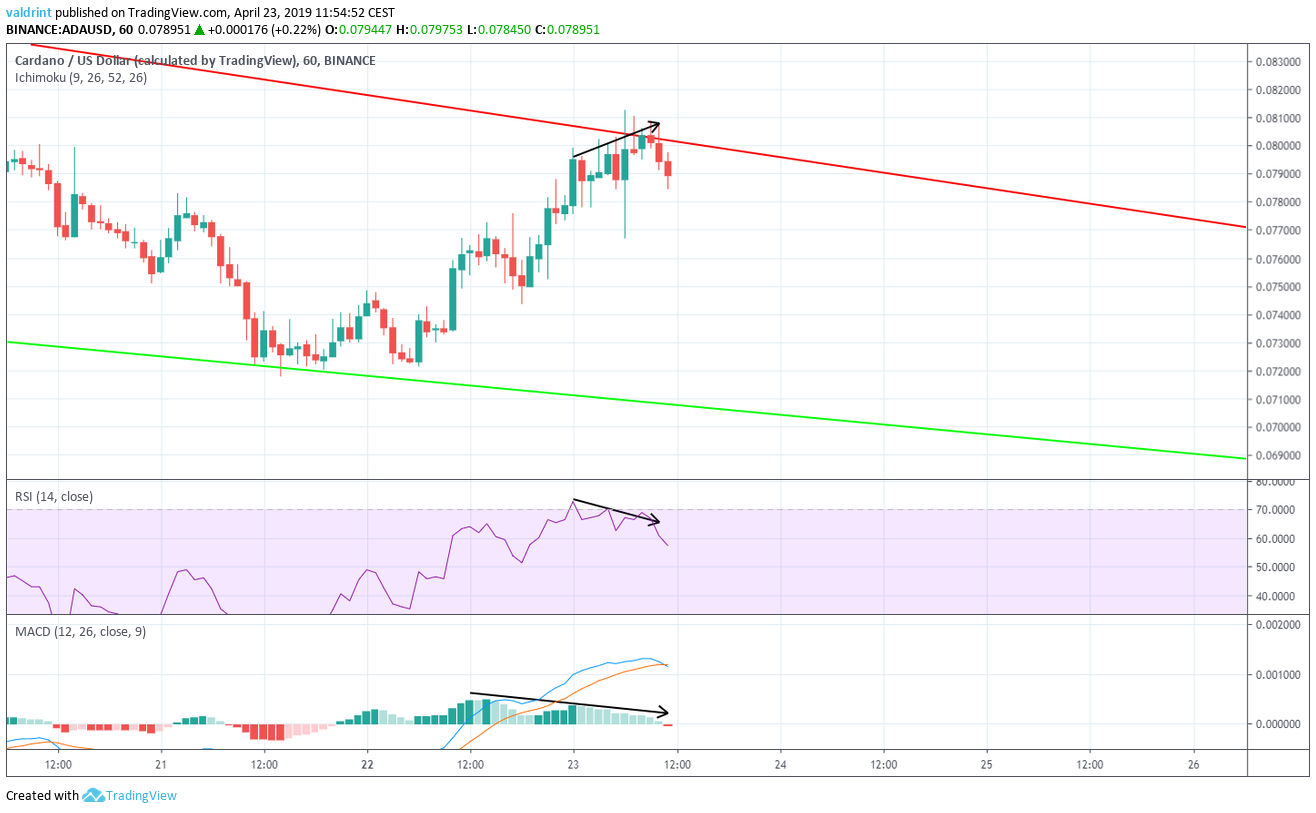
On Apr 22, the price of ADA reached a high of $0.079. It continued to increase and reached another high of $0.081 on Apr 23.
Similarly, the MACD and the RSI made the first high on Apr 22. However, they have continued to generate lower values since. This is known as bearish divergence and often precedes price decreases.
The use of these indicators suggests that price decreases towards the support line of the channel are to be expected.
Future Movements
To better where the price of Cardano might land following price decreases, we include support areas into our analysis.
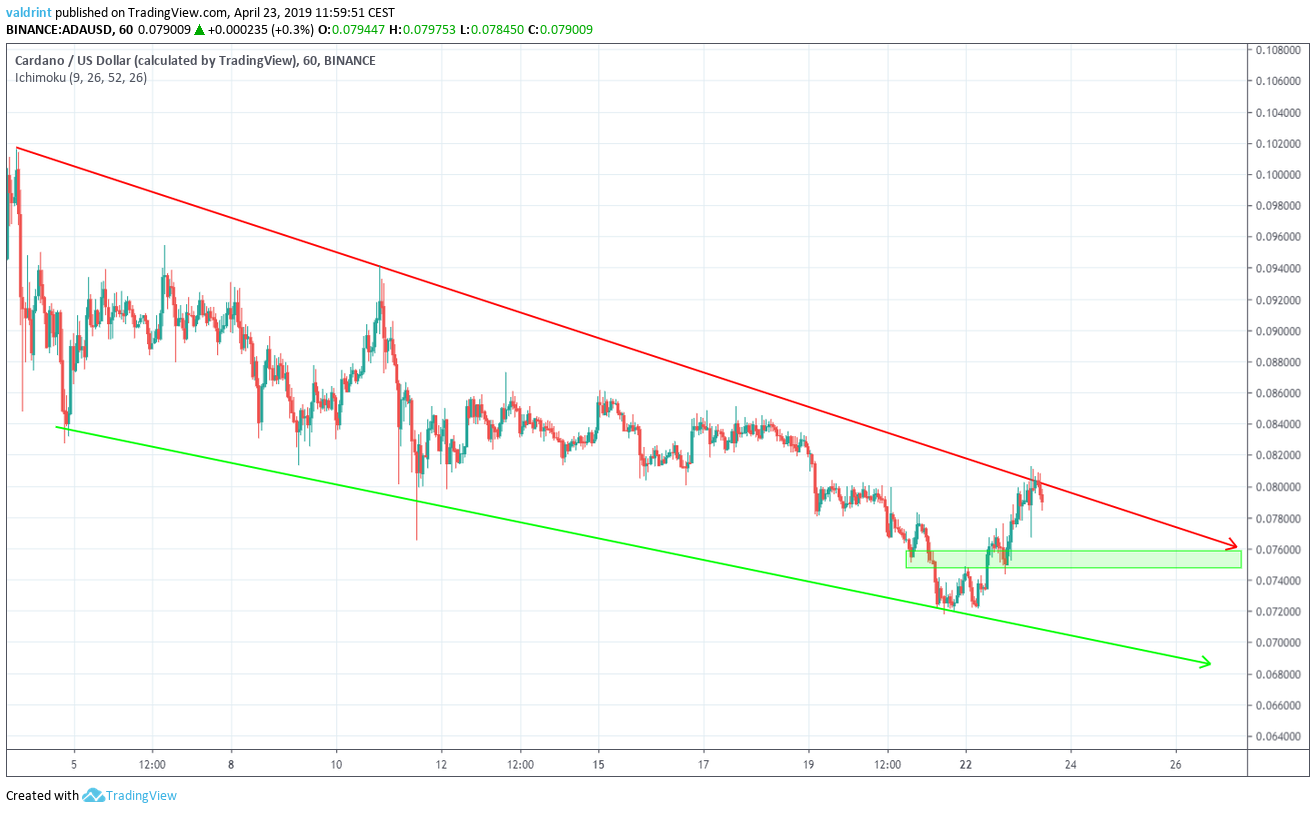
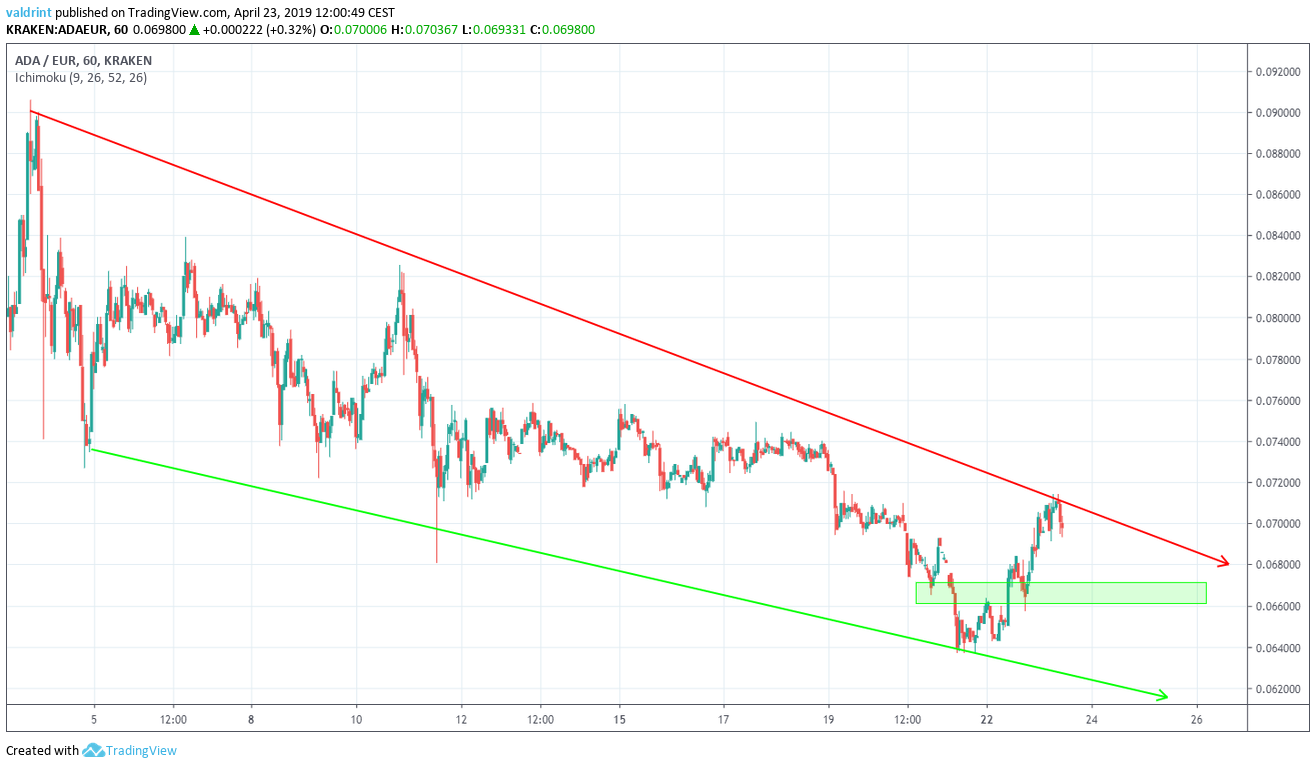
The closest support area is found near $0.075 and €0.065. We believe the price will reach this area.
Summary of Analysis
Based on our analysis, the price of ADA will likely reach the support area outlined above. It is possible that it will drop further and reach the support line of the channel.
Do you think the price of ADA will begin to decrease? Let us know in the comments below.
To learn more about Cardano click on the button below. We’ve even included price predictions for 2019 and 2020!
Disclaimer: This article is not trading advice and should not be construed as such. Always consult a trained financial professional before investing in cryptocurrencies, as the market is particularly volatile.


