


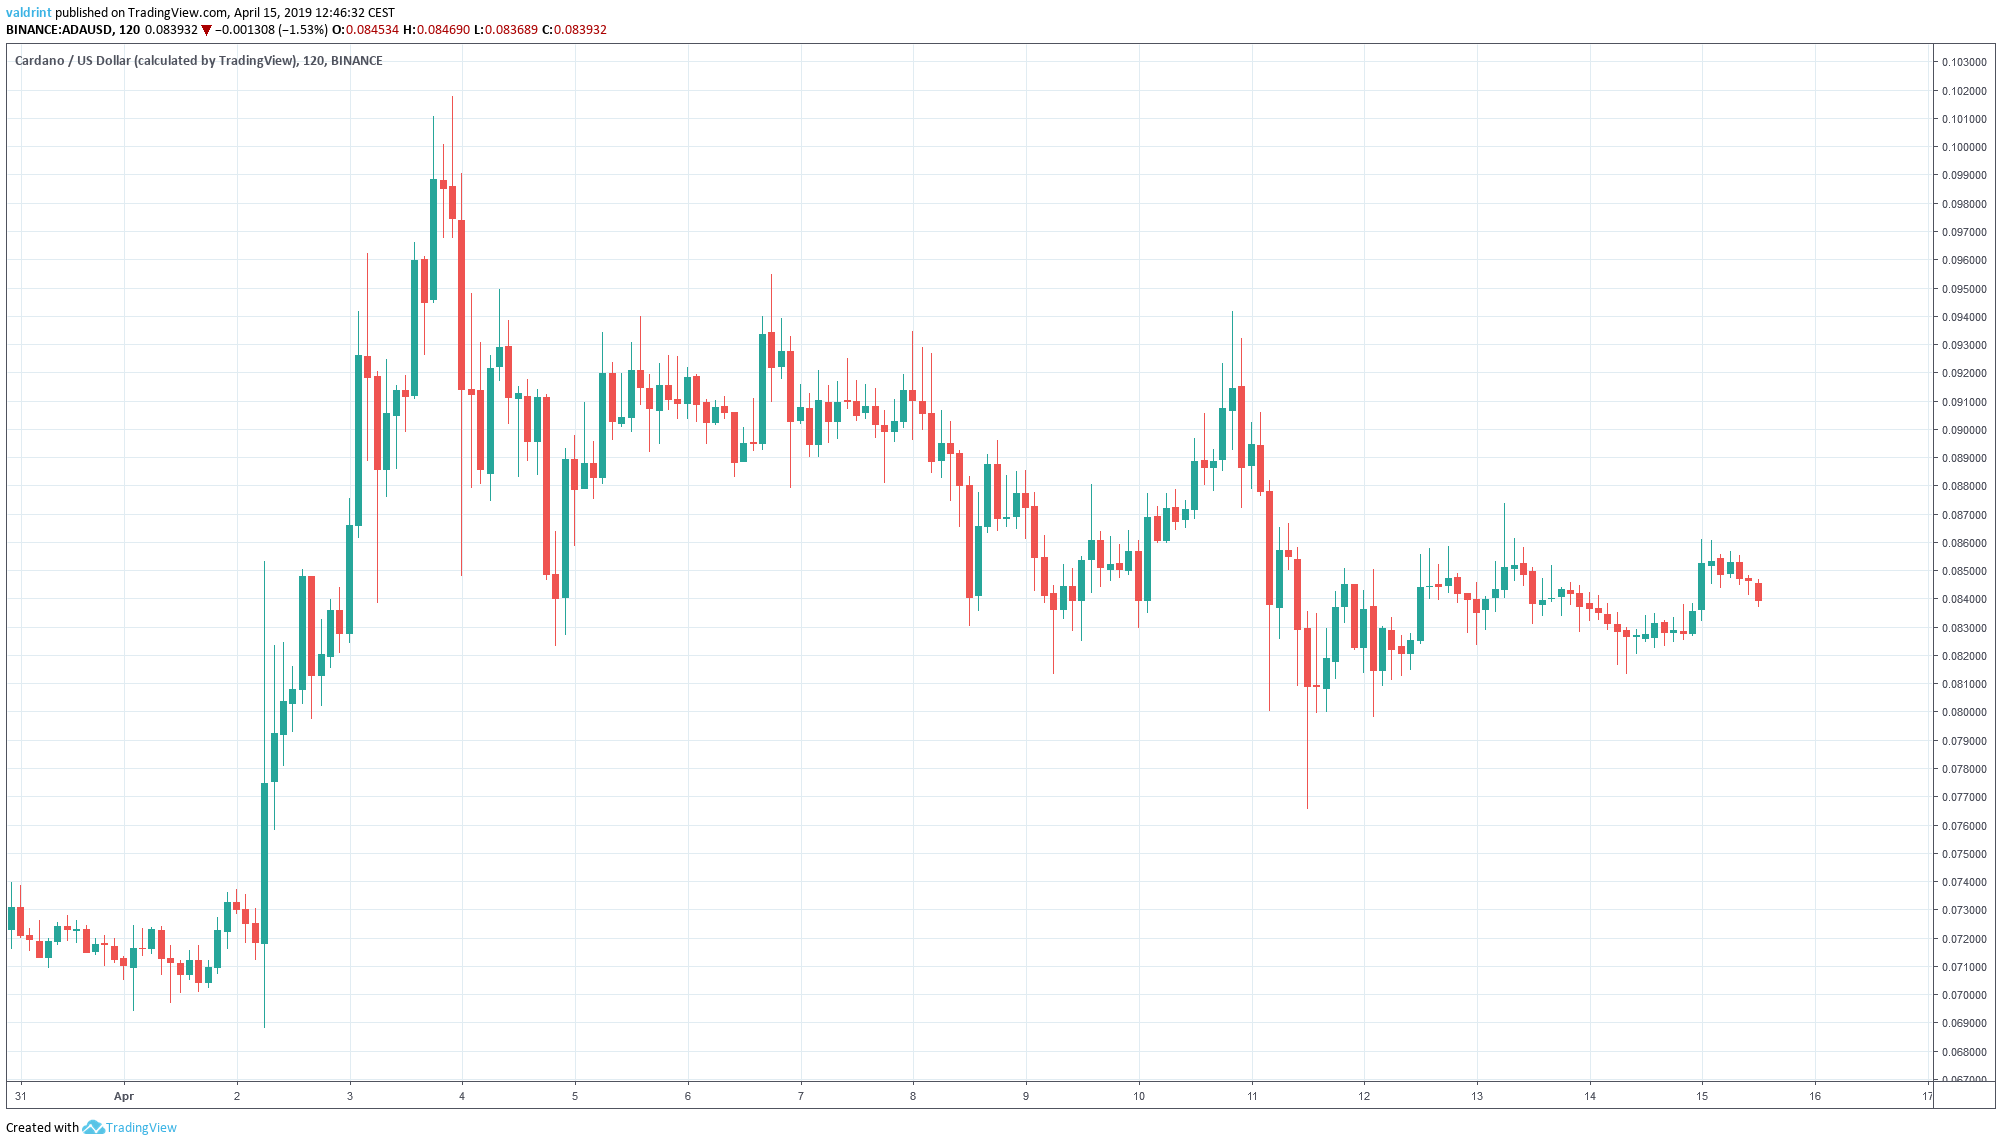
On Apr 2, Cardano initiated a rapid move. By the end of Apr 3, it had reached a high of over $0.1.
Cardano has since been on a gradual downtrend. It reached a low around $0.80 on Apr 11.
Let’s find out:
Cardano (ADA): Trends and Highlights for Apr 15, 2019
- Cardano reached a high on Apr 3 and has been on a downtrend since.
- ADA/USD is trading inside a descending channel.
- Bullish divergence is developing in the RSI and the MACD.
- There is resistance near $0.01.
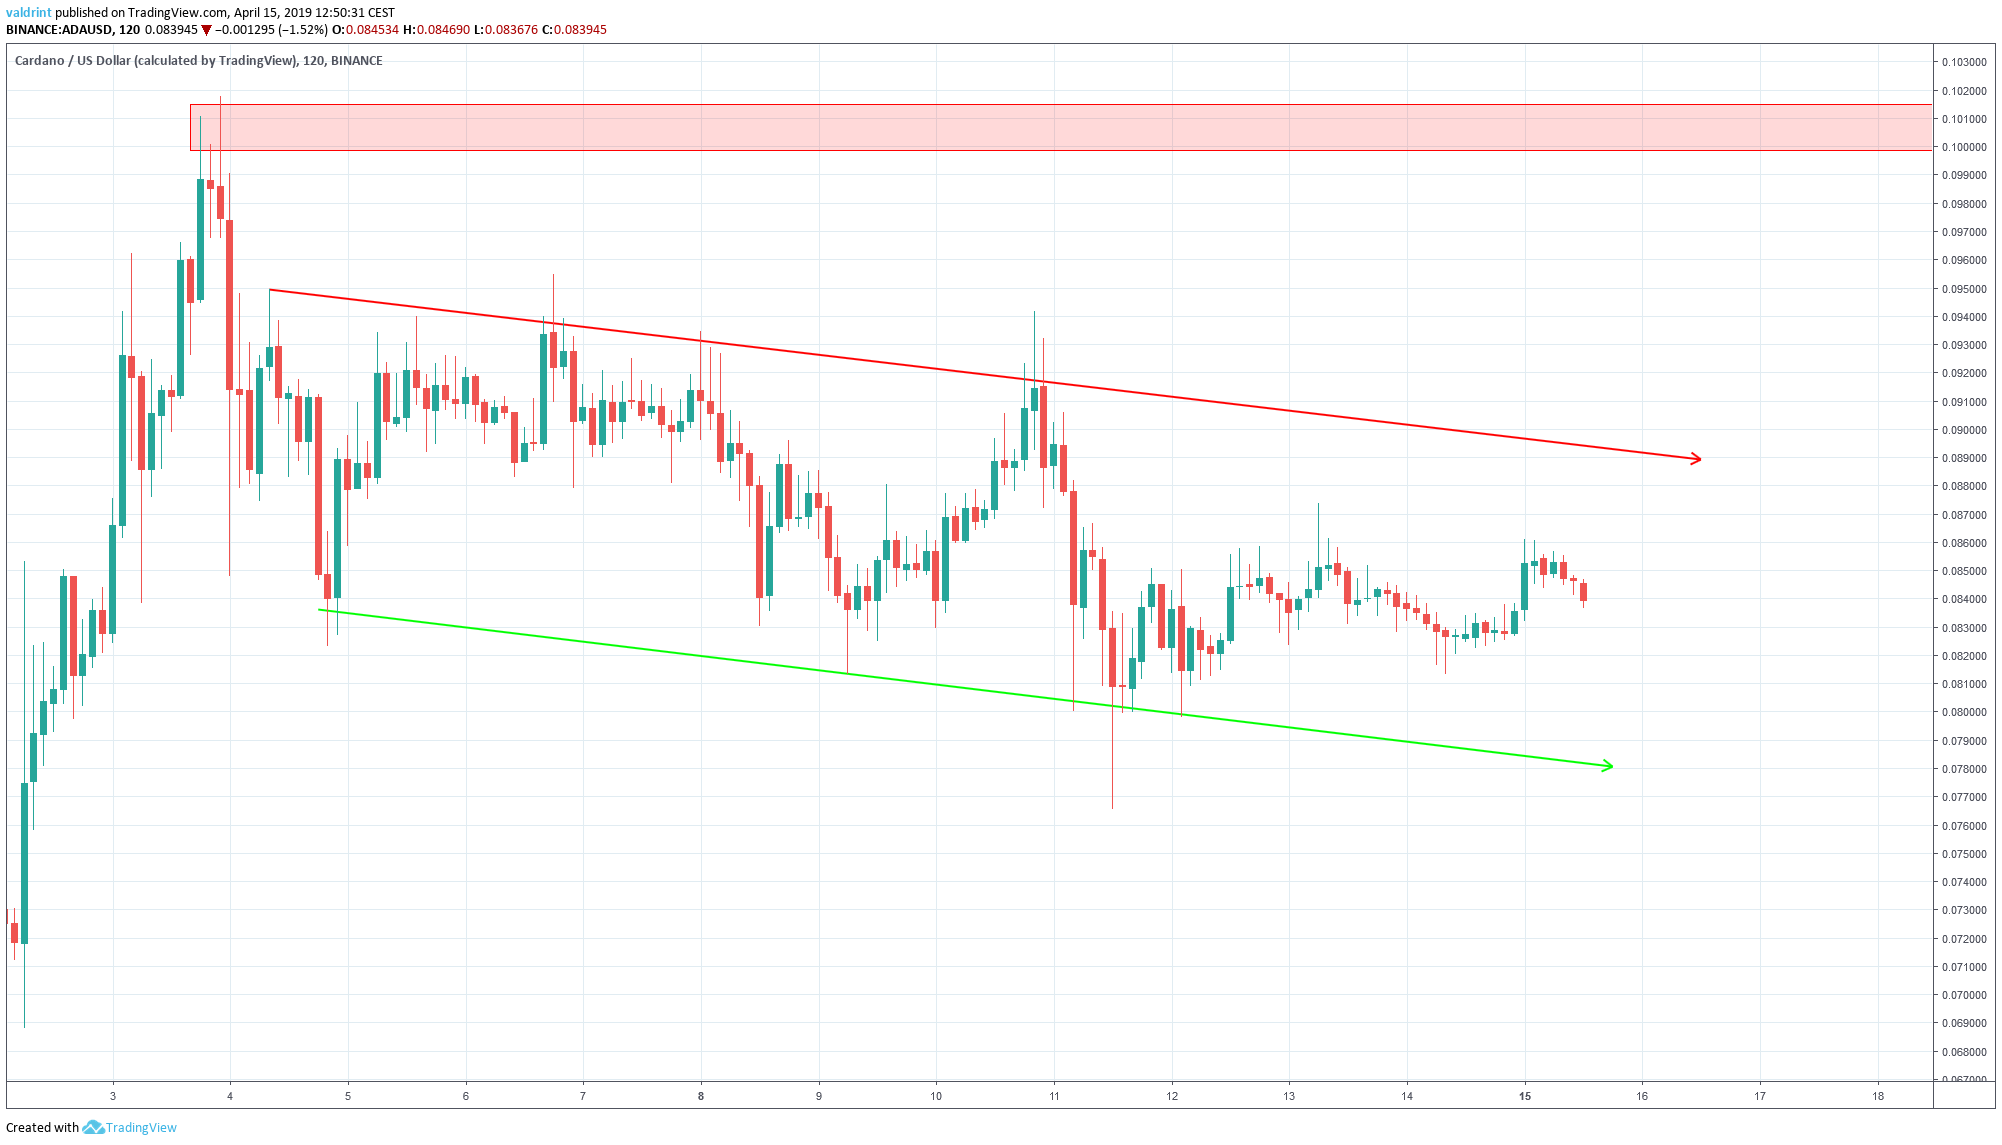
Descending Channel
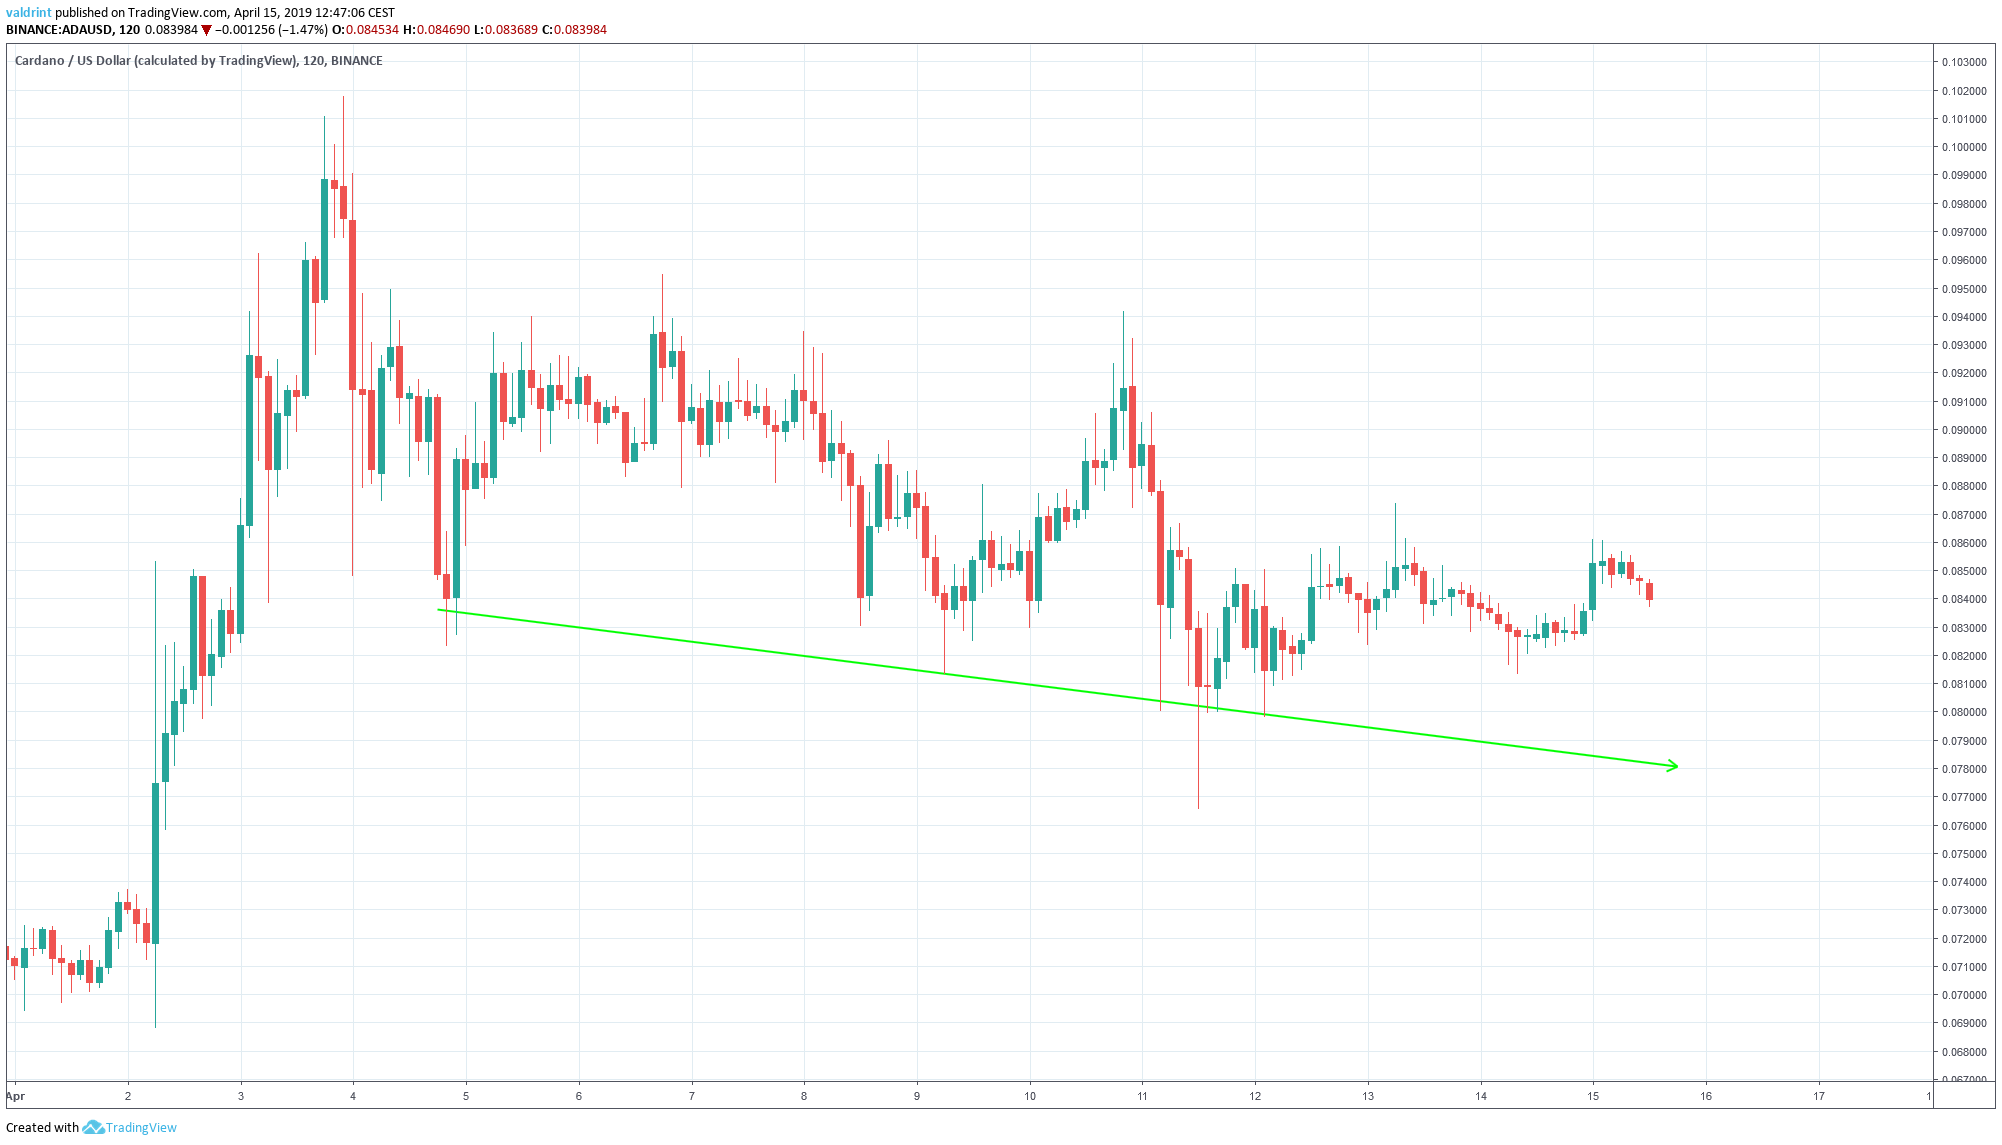
On Apr 4, the price reached a low of $0.0823. Several market cycles have been completed since. The price has made lowers lows each time.
Tracing these lows gives us a descending support line:
On Apr 4, the price made a high of $0.0947. A gradual drop was followed by a gradual increase. The price has reached several lower highs.
Tracing these highs gives us a descending resistance line. The resistance and support lines combine to create a descending parallel channel:
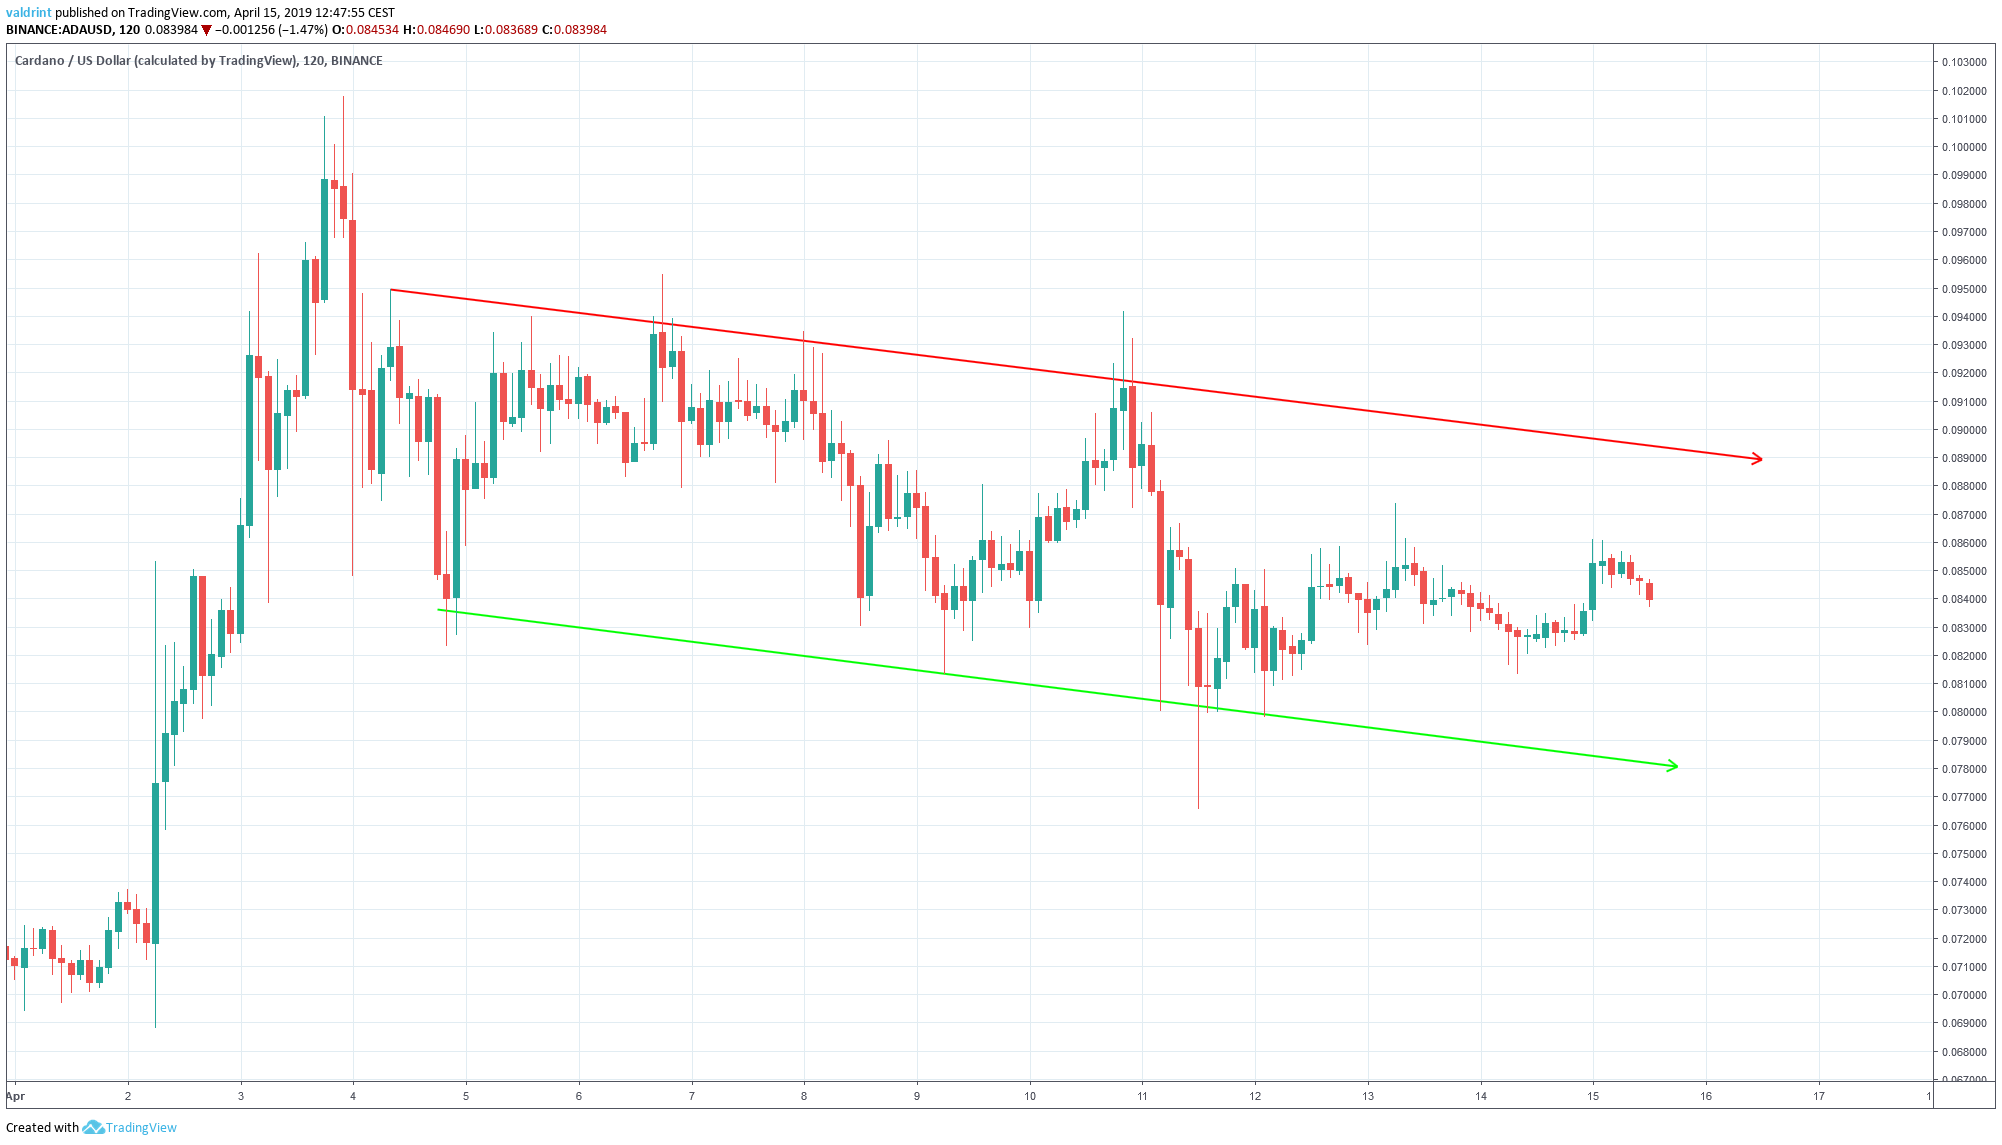
It is likely that the price keeps decreasing at the rate predicted by the channel until a decisive move occurs.
In order to figure out the direction of the move, we need to take a look at the technical indicators.
Relative Strength Index
We begin by incorporating RSI and MACD into our analysis:
The relative strength index (RSI) is an indicator which calculates the size of the changes in price in order to determine oversold or overbought conditions in the market.
Combining MACD and RSI bullish/bearish divergence with support/resistance essentially predicts price fluctuations.
The technical indicators are shown alongside price and the current trading pattern below:
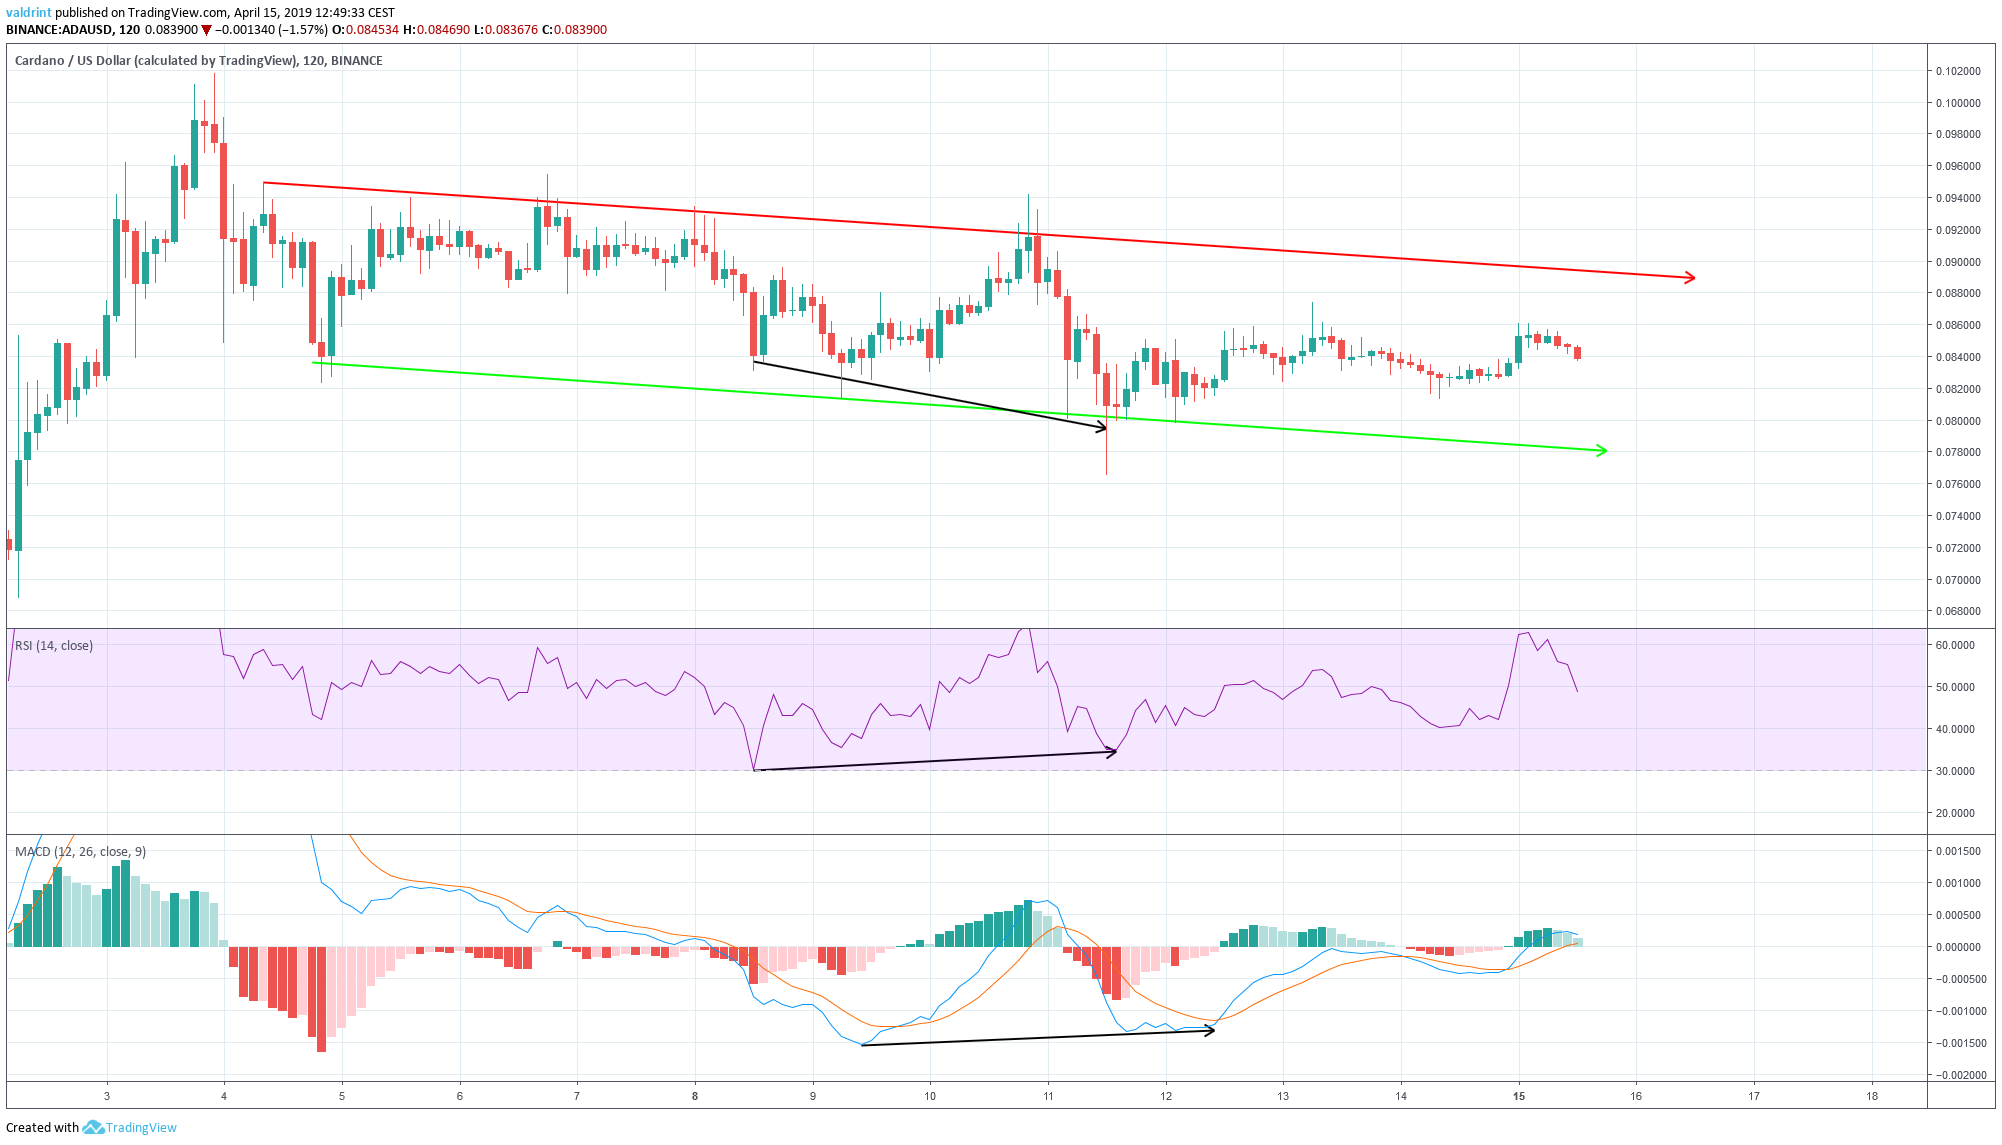
On Apr 8, the price reached a low of $0.83. It made another low of $0.76 on Apr 11.
Similarly, the RSI made the first low on Apr 8. The MACD did on Apr 9. However, they both have proceeded to generate higher values.
This is known as bullish divergence and often precedes price increases.
Furthermore, we can see that the price has been following an ascending support line (dashed) since Mar 22.
The use of these indicators suggests that price increases towards the resistance line of the channel are to be expected.
Future Movements
The first resistance area is found near $0.01, coinciding with the recent high of Apr 3. If the analysis in our previous section proves to be correct, the price could eventually reach this area.
Summary of Analysis
Based on our analysis, the price of ADA will likely move towards the resistance line of the channel. A breakout remains possible.
Do you think the price of ADA will eventually break out from the channel? Let us know in the comments below.
To learn more about Cardano click on the button below. We’ve even included price predictions for 2019 and 2020!
Disclaimer: This article is not trading advice and should not be construed as such. Always consult a trained financial professional before investing in cryptocurrencies, as the market is particularly volatile.


