


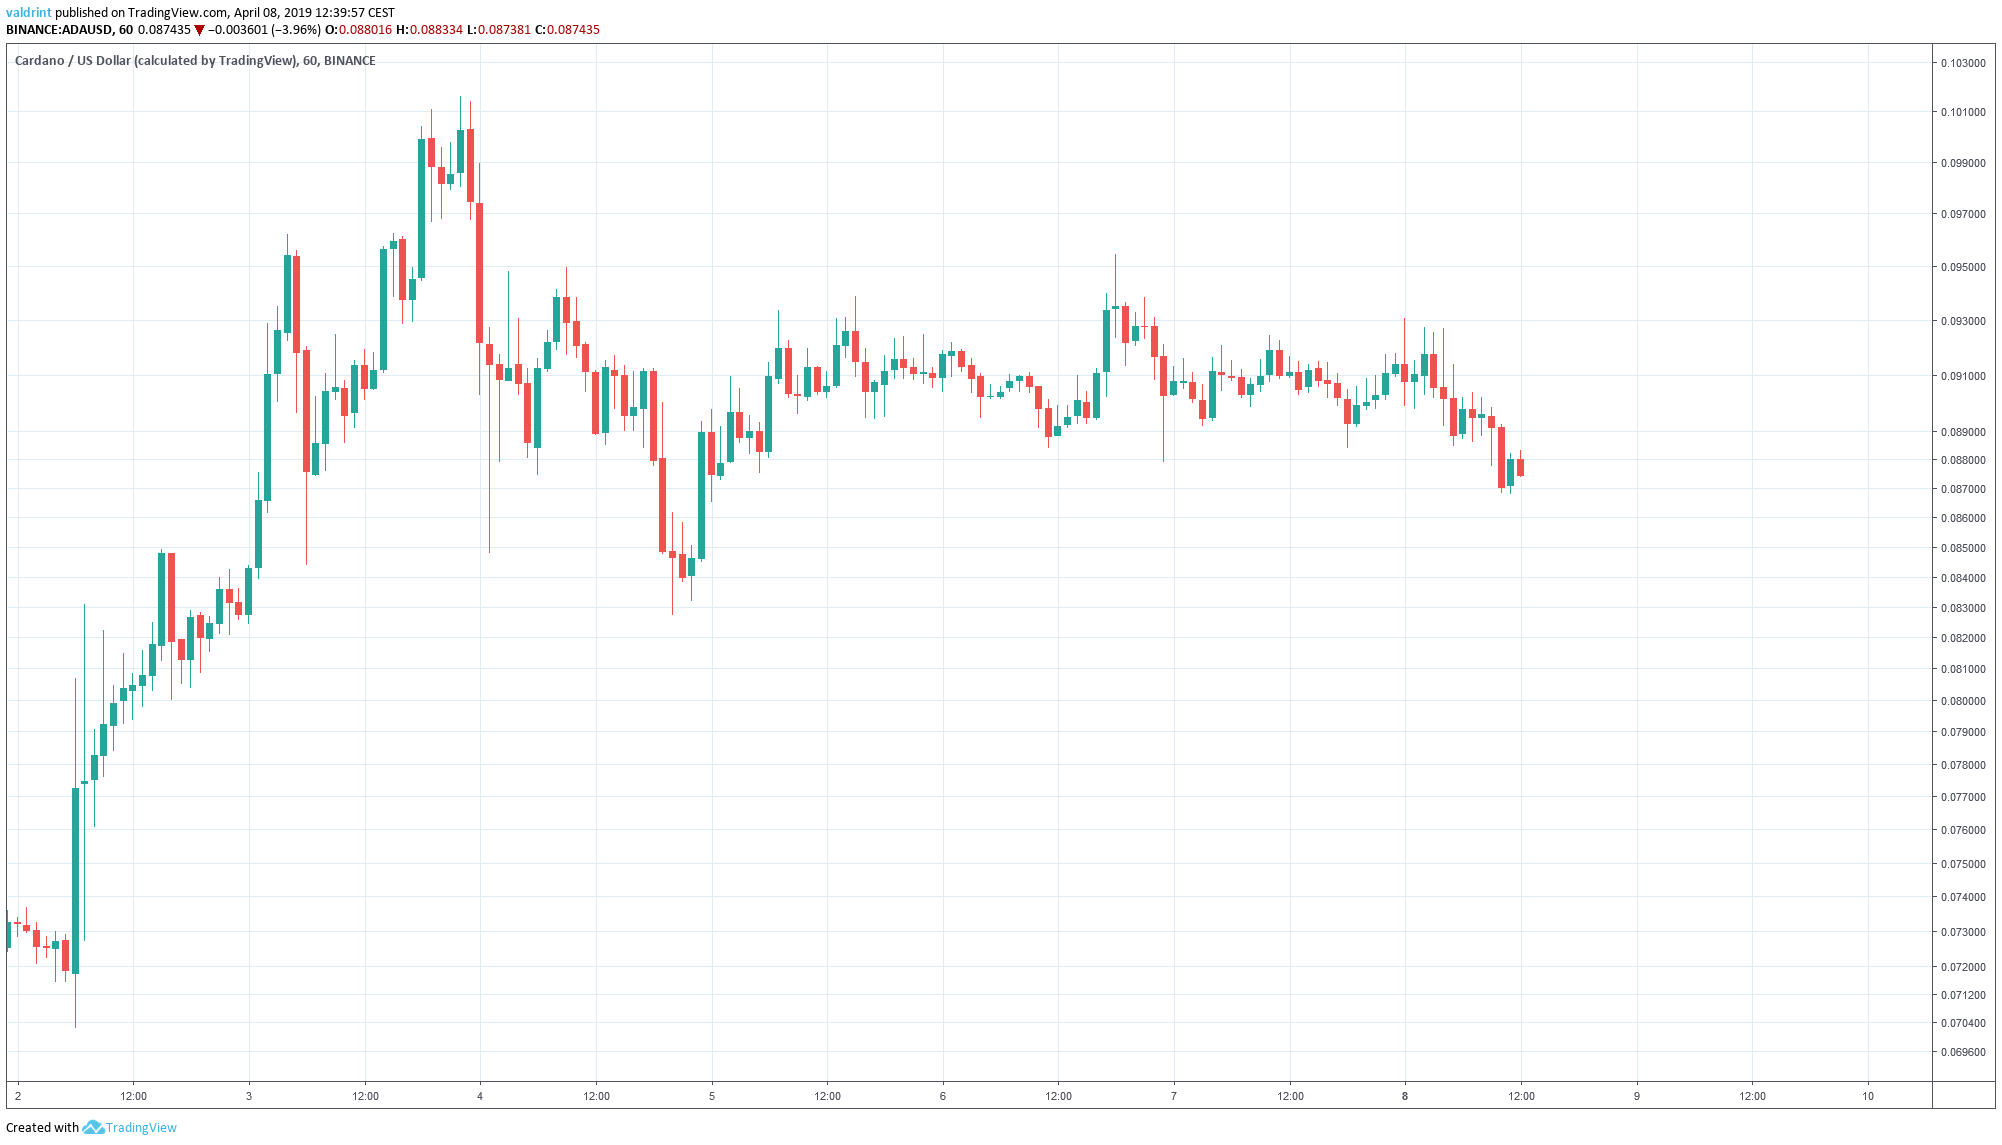
On Apr 2, Cardano initiated a rapid move. By the end of Apr 3, it had reached a high of over $0.1.
A significant downtrend followed with a low of under $0.083 reached on Apr 4. Prices slightly rise and plateaued throughout the next several days.
Currently, ADA/USD is trading closer to the lows of Apr 4 than the highs of Apr 3:
Will Cardano reclaim new highs or fall to lower lows?
Let’s find out:
Cardano (ADA): Trends and Highlights for Apr 8, 2019
- Cardano reached a high on Apr 3 and has been on a downtrend since.
- ADA/USD is trading inside a symmetrical triangle
- It is trading below the lower bollinger band.
- There is support near $0.08 and resistance near $0.01.
Ascending Triangle
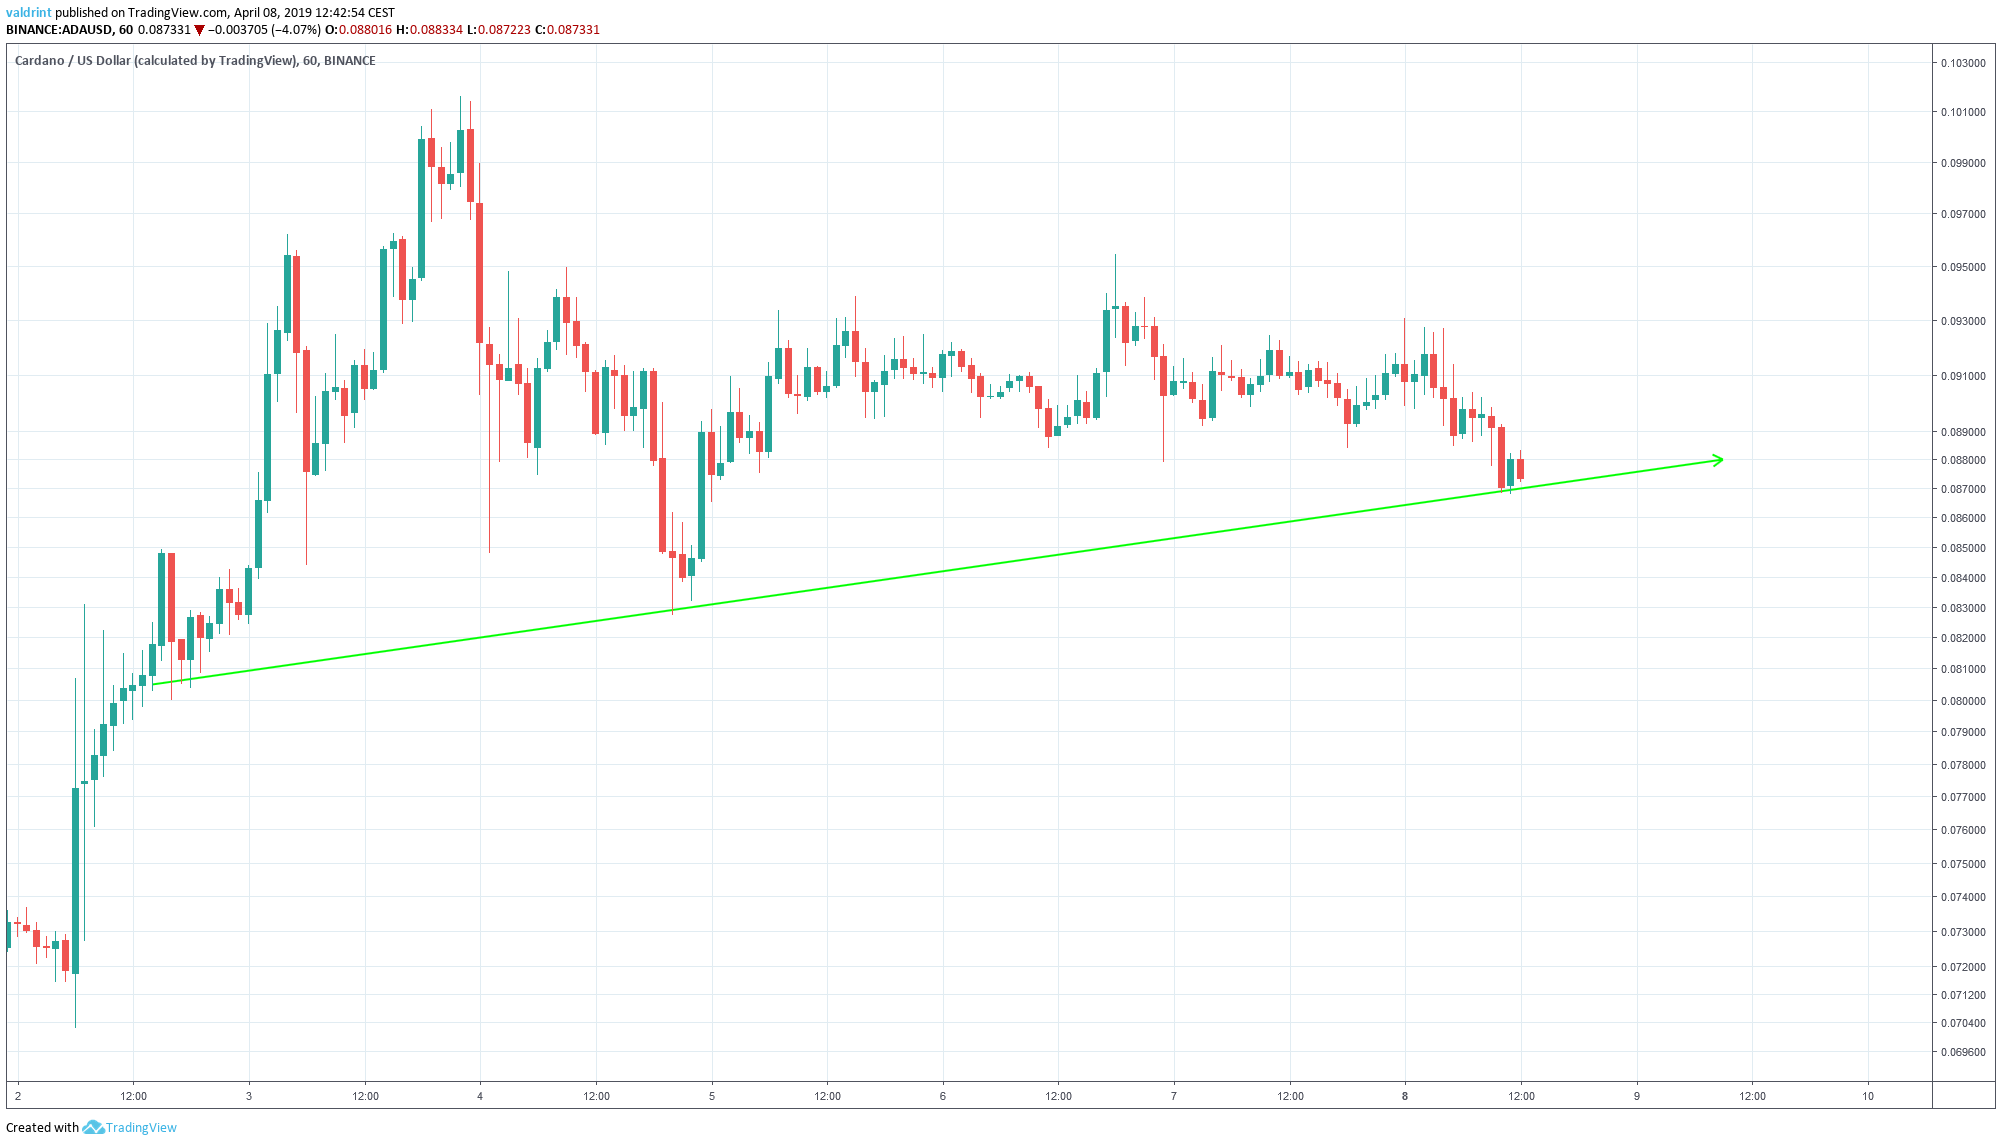
On Apr 2, the price reached an hourly low of $0.079. Several market cycles have been completed since. The price has made several higher lows.
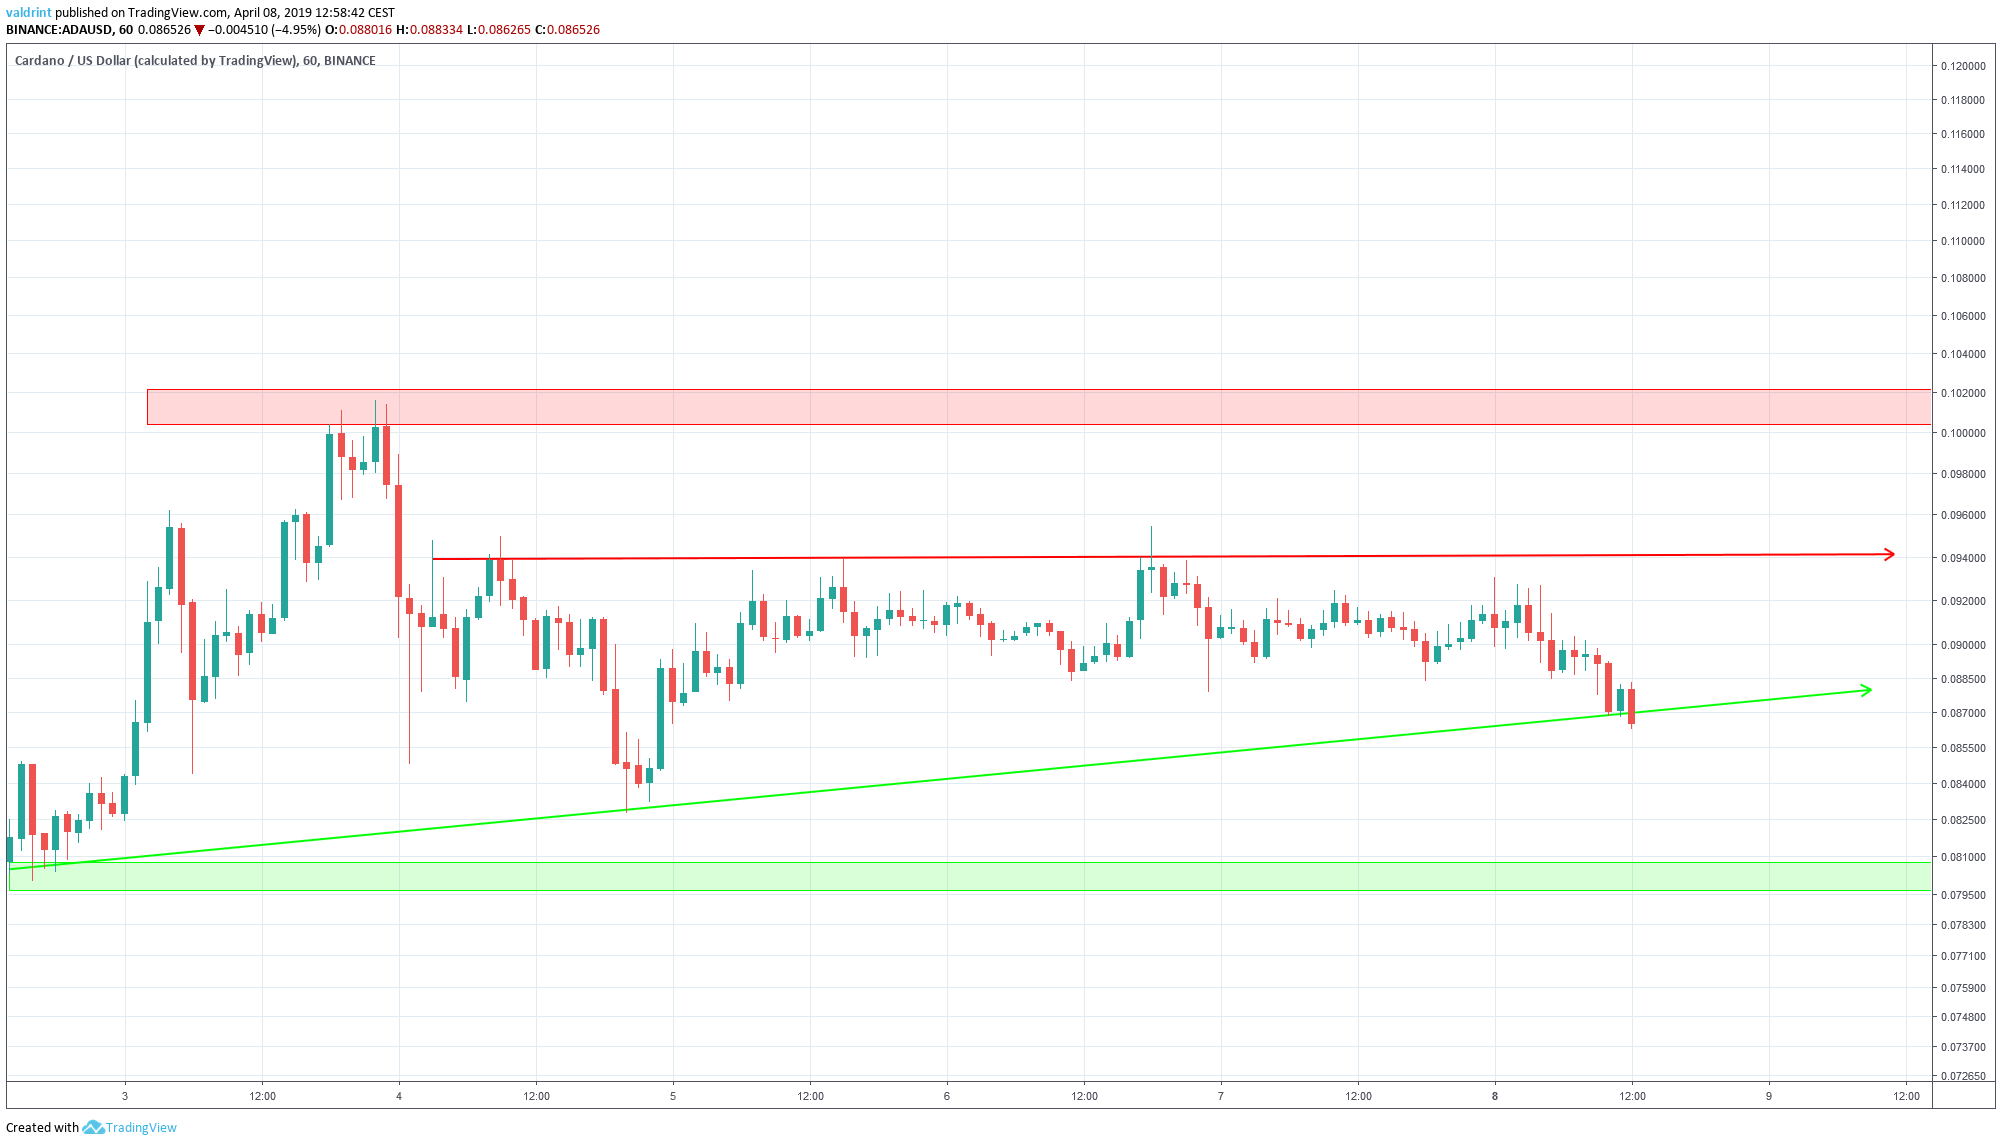
Tracing these lows gives us an ascending support line:
On Apr 4, the price made a high of $0.0947. A gradual drop was followed by a gradual increase. The price has reached the same level four times.
Tracing these highs gives us a horizontal resistance line.
The resistance and support lines combine to create an ascending triangle:
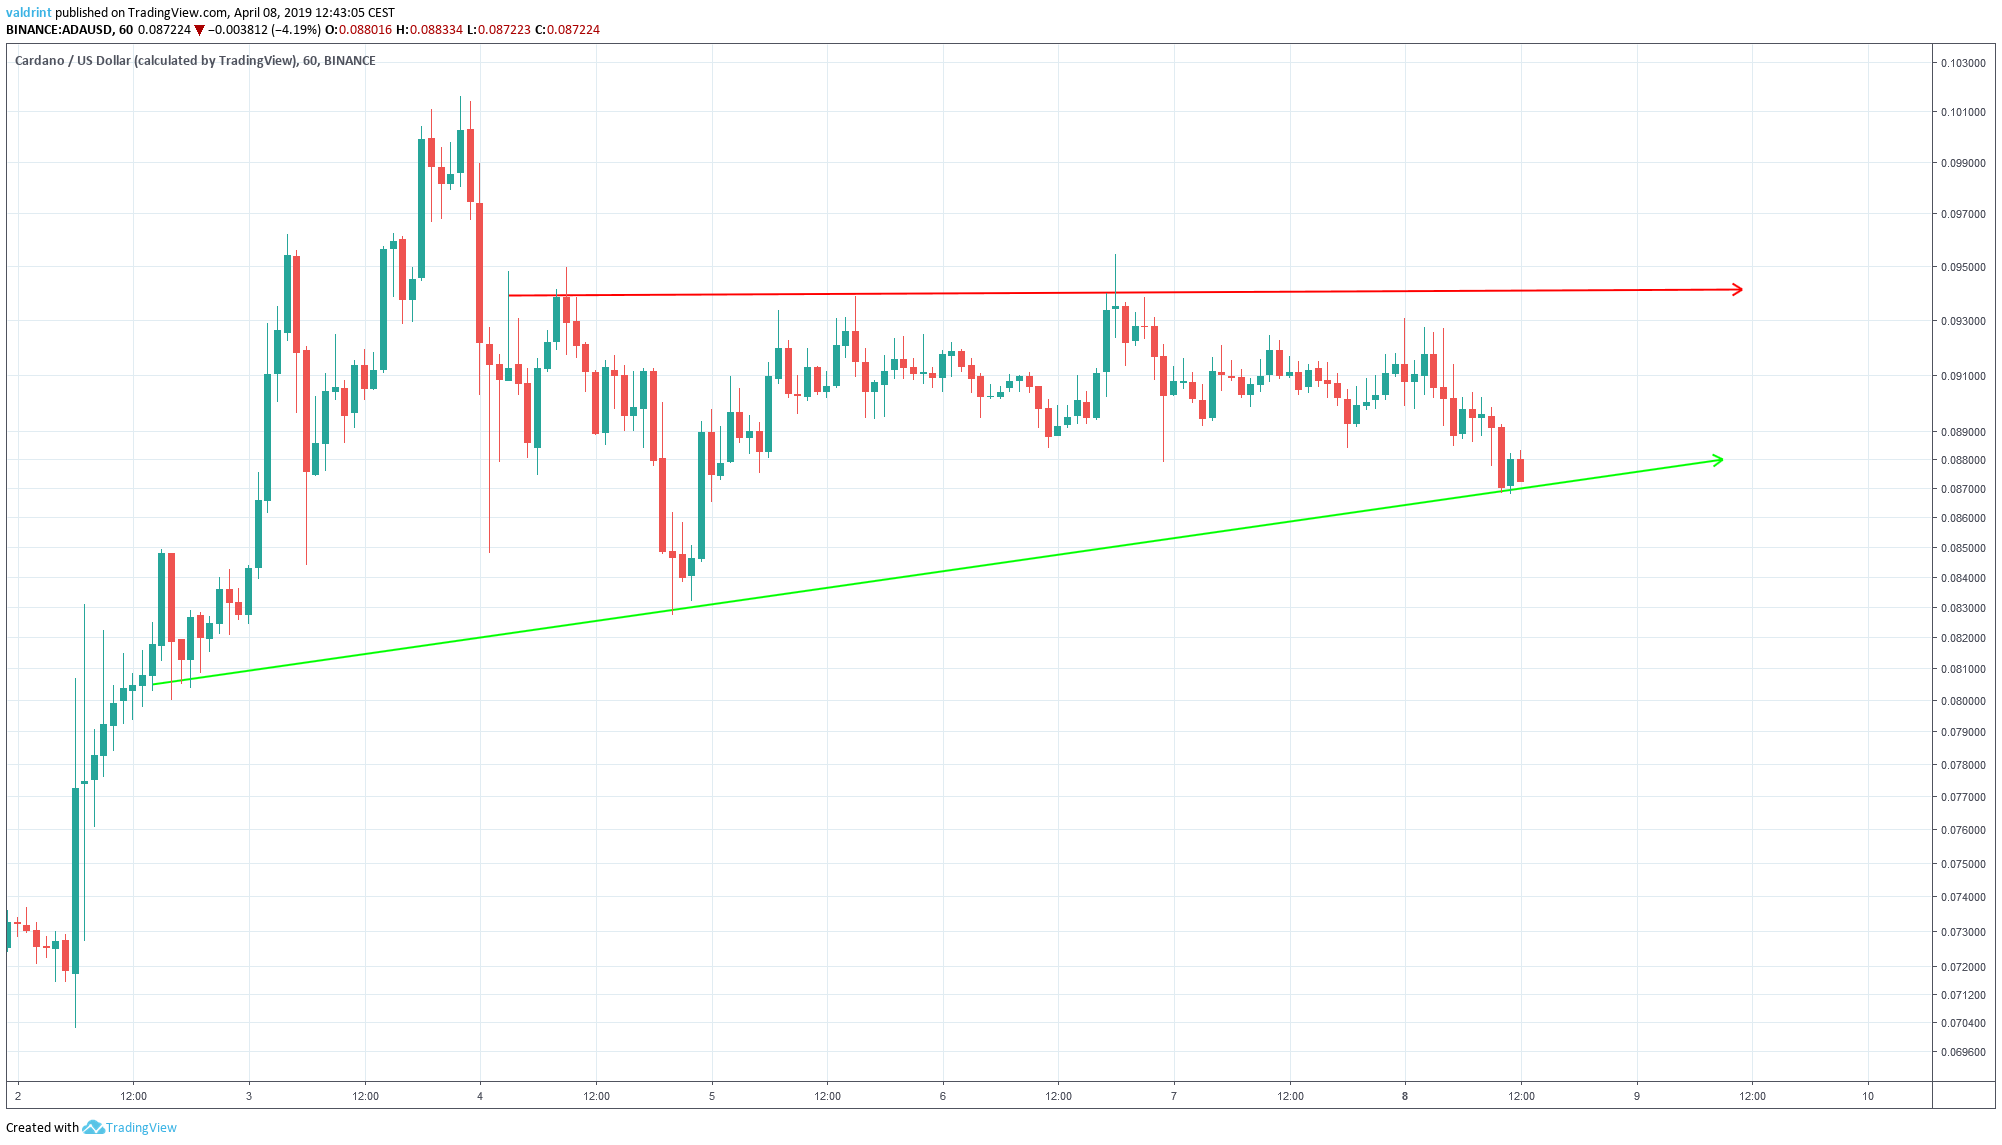
It is likely that the price moves within the confines of this triangle until a decisive move occurs. The ascending triangle is a bullish pattern. This mean prices increases—including a possible breakout above resistance—is more likley than price decreases.
In order to figure out whether or not price increases or breakout is imminent, need to apply a few technical indicators.
Bollinger Bands
We begin by incorporating Bollinger Bands into the analysis.
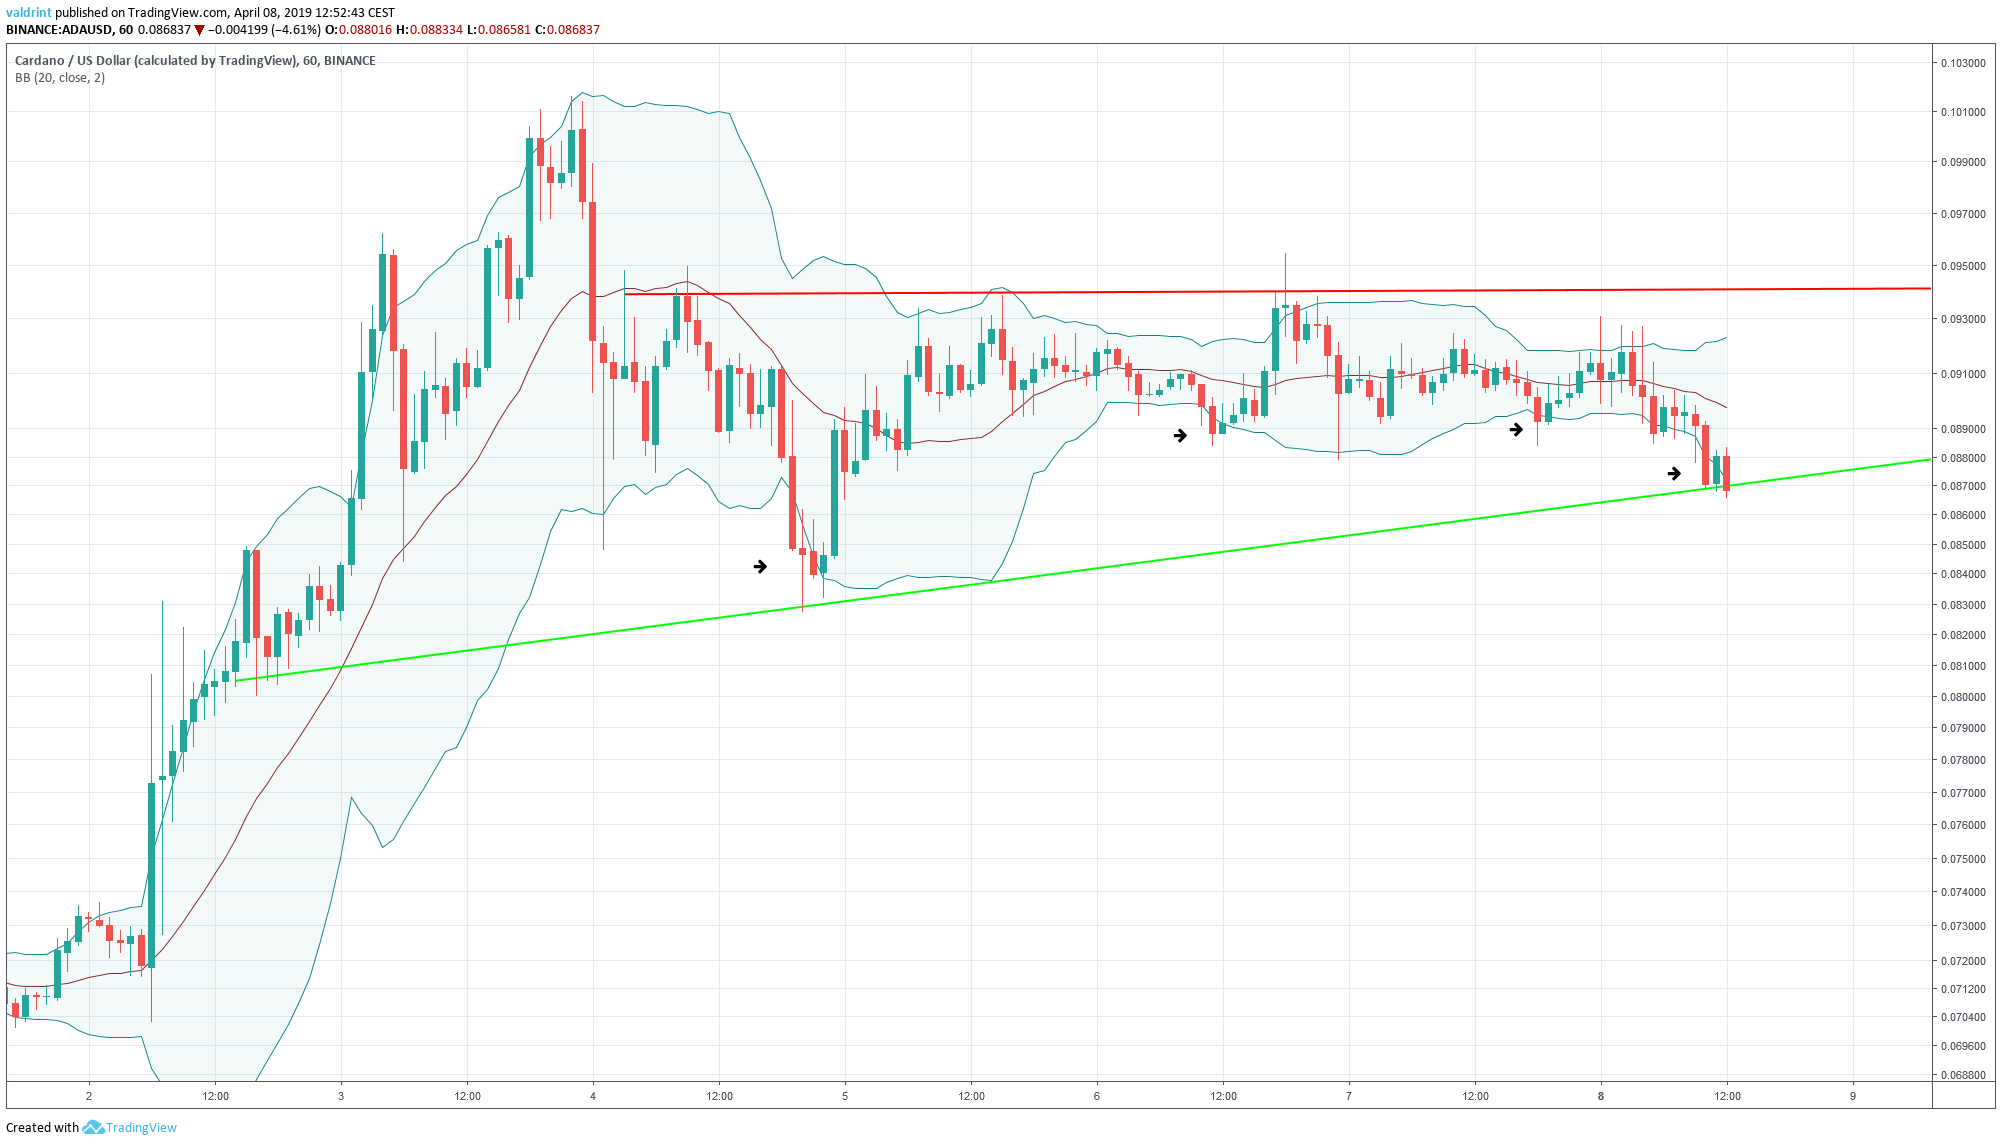
On Apr 8, the price reached a low of $0.863. This caused it to trade below the lower bollinger band.
We can see that the previous three times this occurred, a price increase ensued.
Using this indicator suggests price increases toward the resistance line of the triangle in the near future.
Future Movements
The price of ADA on Binance is analyzed at two-hour intervals from Mar 31 to Apr 5 in order to better assess resistance and support areas.
The first resistance area is found near $0.01, coinciding with the recent high of Apr 3. If the analysis in our previous section proves to be correct, the price could eventually reach this area.
The closest support area is found near $0.08. We currently do not believe that Cardano will reach this area in the near future.
Summary of Analysis
Based on our analysis, the price of ADA will likely move inside the confines of the ascending triangle. Price increases are likely with a possible breakout.
Do you think the price of ADA will break out or break down from the triangle? Let us know in the comments below.
Disclaimer: This article is not trading advice and should not be construed as such. Always consult a trained financial professional before investing in cryptocurrencies, as the market is particularly volatile.


