


Cardano (ADA) has broken out from a short-term descending resistance line. However, it is still trading inside a longer-term symmetrical triangle. A breakout from the latter could send the price to 690 satoshis.
The short-term breakout was outlined by well-known cryptocurrency trader @CryptoNTez, who tweeted an ADA chart showing that the price has already broken out from a symmetrical triangle.
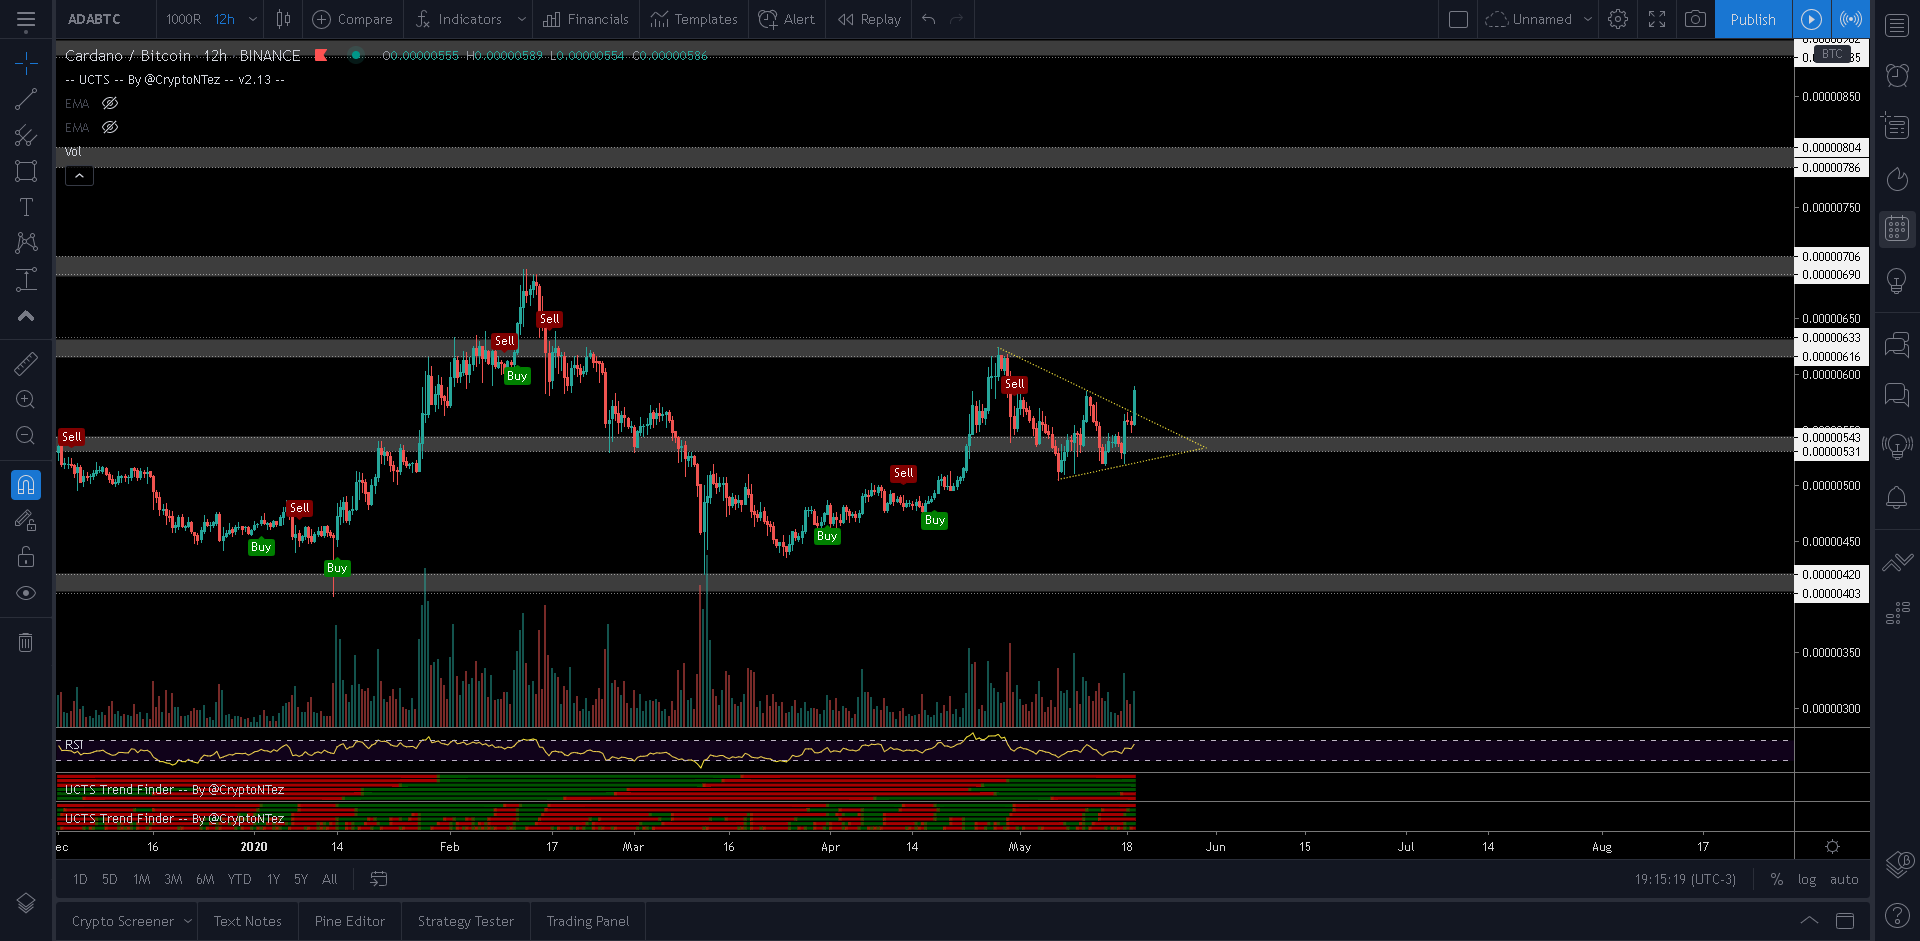
However, he believes a retest is necessary in order to enter the trade:
Breakout to the upside followed by spike in Volume making a new HH Aiming for ~610sats as 1st target from here, if you didn’t take an entry already, wait for a potential retest of the just crossed trend-line.
Symmetrical Triangle
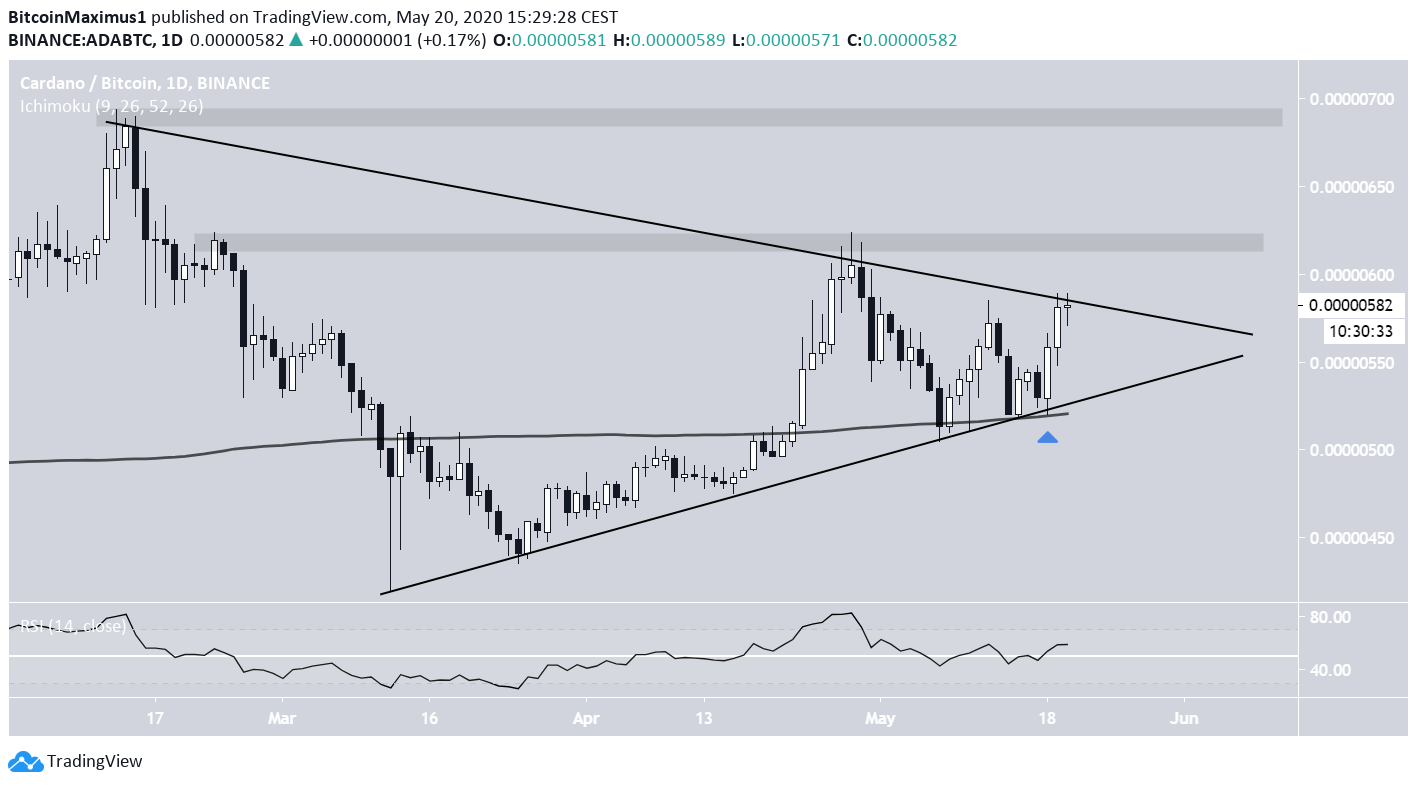
The ADA price has been trading inside a long-term symmetrical triangle, in place since March 16. At the time of writing, the price was in the process of validating the resistance line for the third time.
The current upward movement began on May 18, once the price bounced at both the ascending support line and 200-day moving average (MA). Furthermore, the daily RSI has moved back above 50, a sign that the price could possibly break out.
If it does, the closest resistance levels are found at 615 and 690 satoshis.
Current Breakout
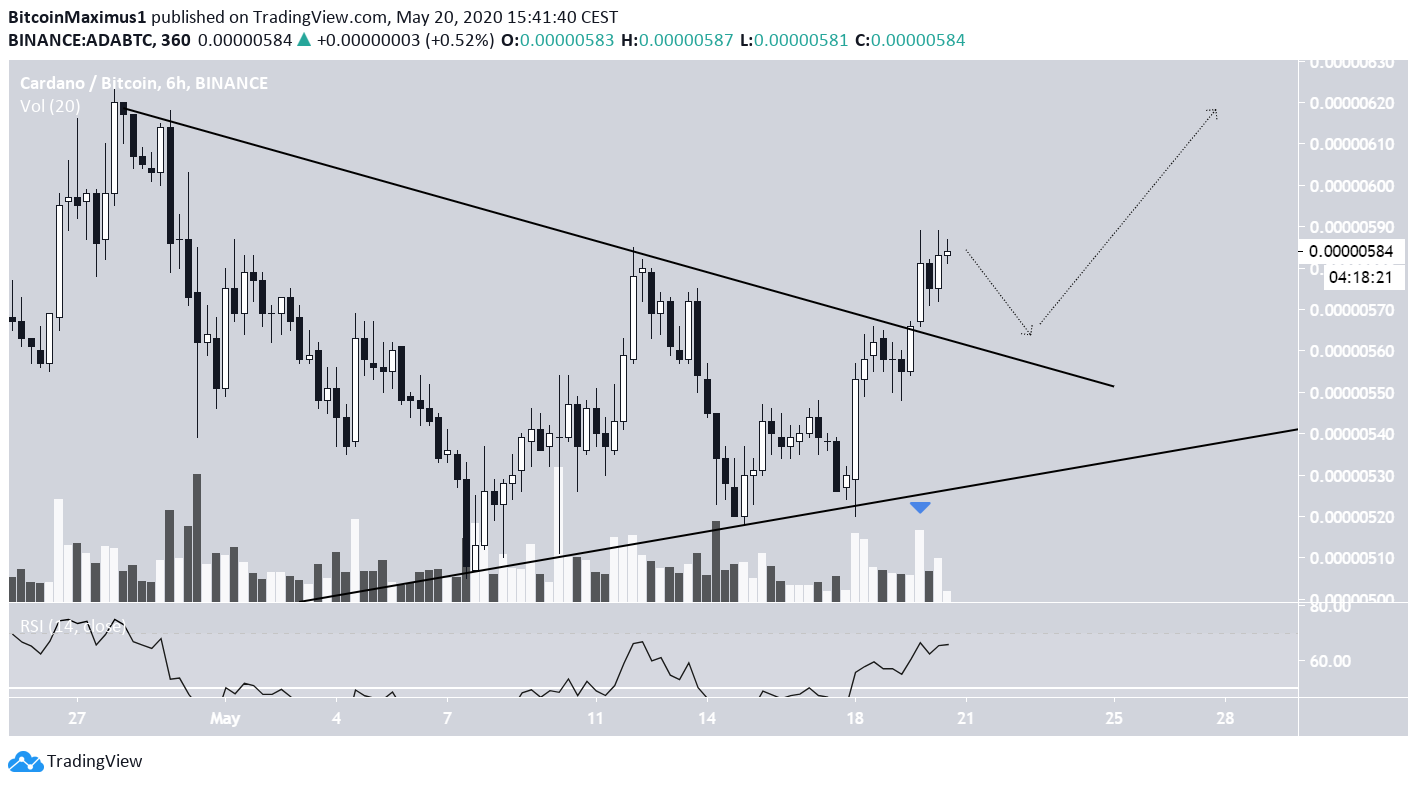
The breakout outlined in the tweet occurred over a shorter-term descending resistance line that the price had been following since the beginning of May. The breakout occurred with decent volume, increasing its legitimacy.
While it is possible that the price will initially decrease and validate this line before heading higher, there is no bearish divergence in the RSI yet, so it is possible that the price continues moving upwards without retracing.
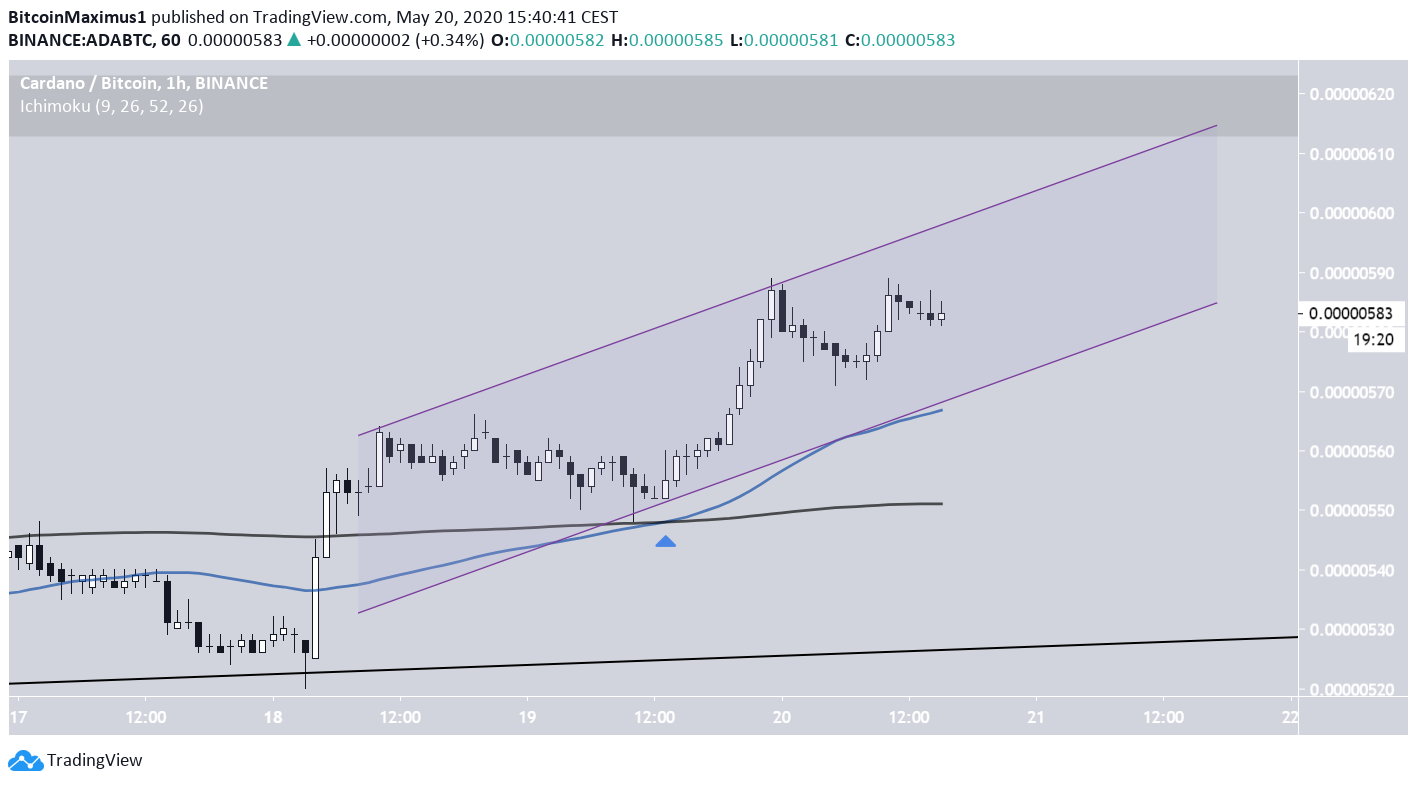
In the hourly chart, a golden cross has transpired, and the price is trading above both the 50- and 200-hour MAs. In addition, the price is possibly trading inside an ascending channel, even though the support line has not been validated sufficient times.
If the price continues increasing inside this channel, it will reach the first resistance area at 615 satoshis some time tomorrow.
To conclude, the ADA chart has broken out above a short-term resistance line and has been increasing since. It is likely to continue doing so until it reaches one of the resistance areas outlined above.


