


ADA has been decreasing since reaching an all-time high price on Feb. 27.
Despite the drop, ADA has bounced after re-testing the previous all-time high as support. Both technical indicators and the price action support the continuation of the upward move.
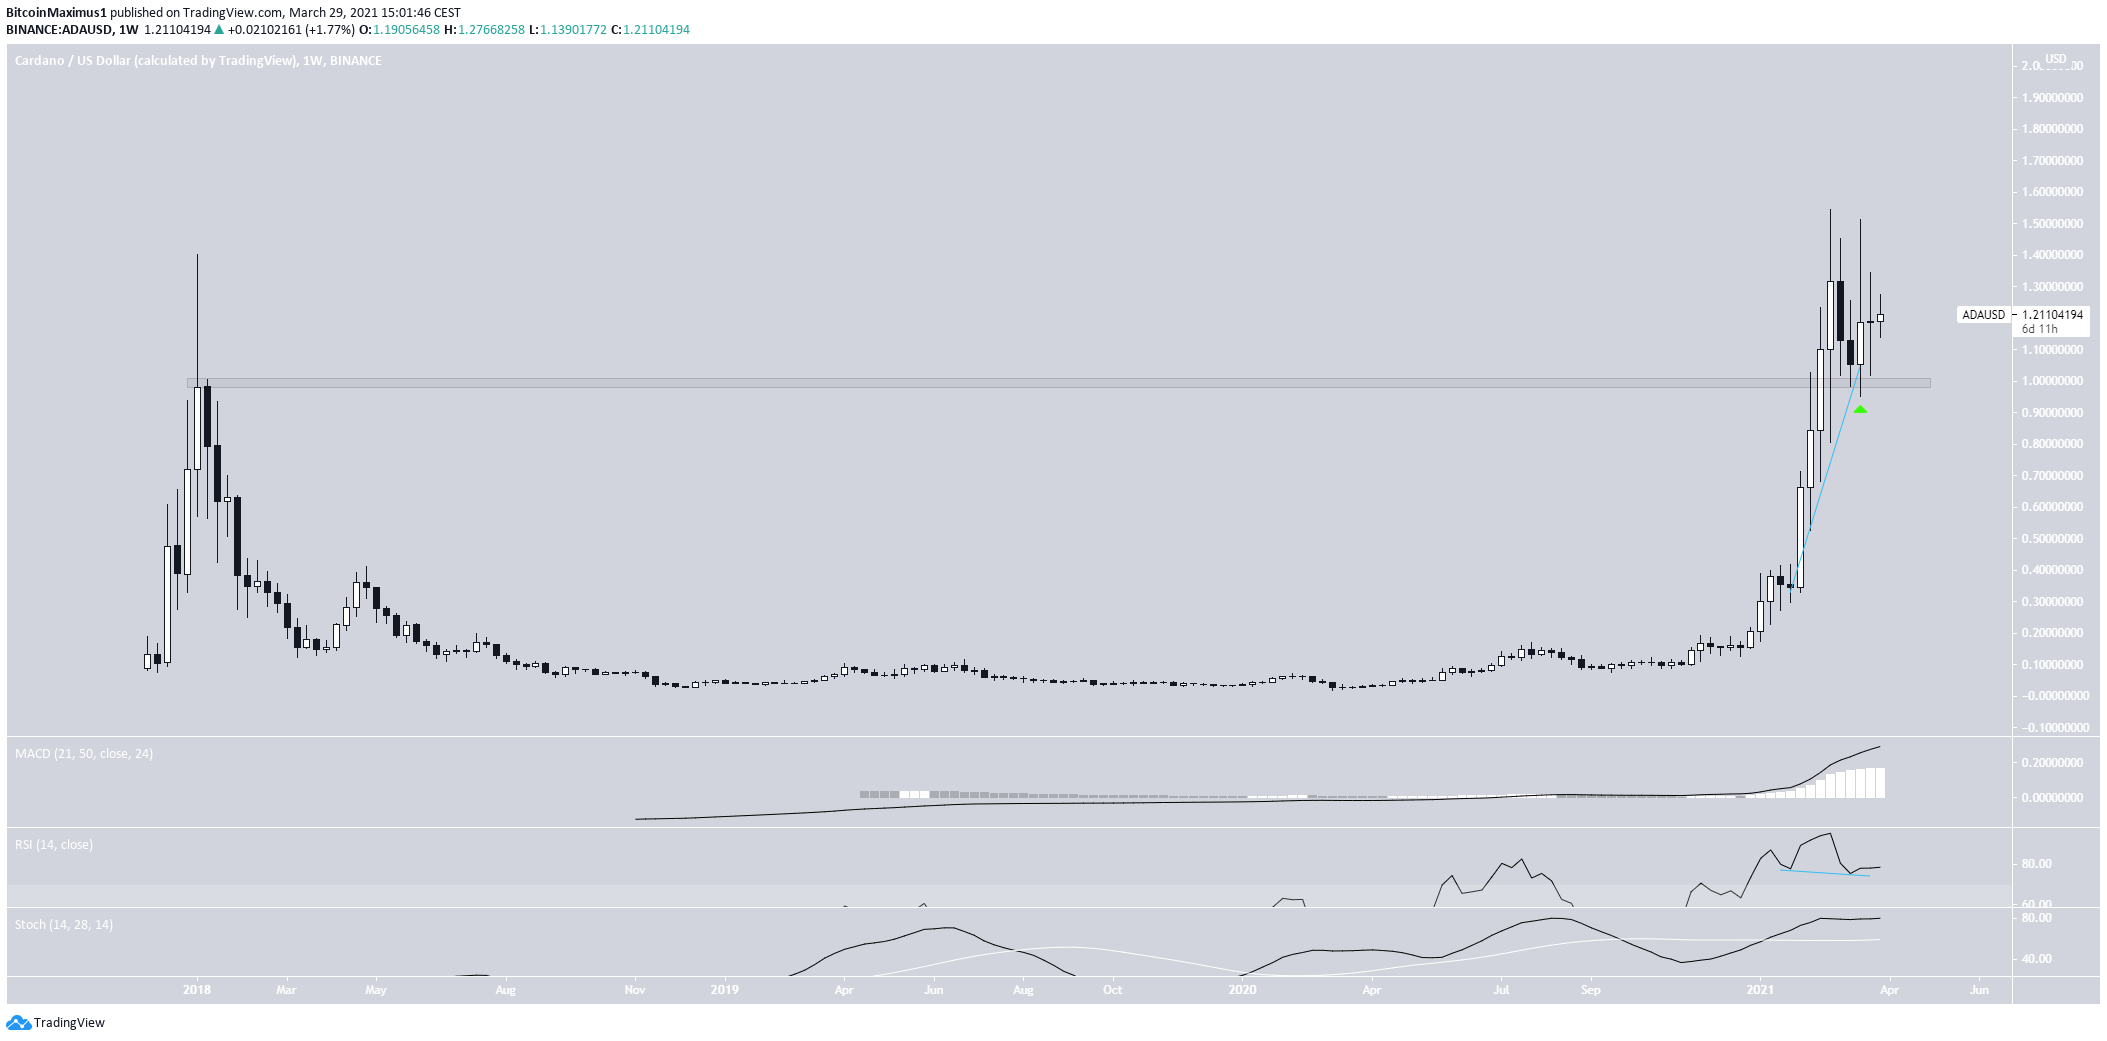
All-Time High for ADA
On Feb. 27, the token reached a new all-time high price of $1.54. It dropped almost immediately afterward, but this only served to validate the previous all-time high level of $1 as support (green arrow). Since then, the token has been moving upwards.
Technical indicators in the weekly time-frame are bullish. The MACD & Stochastic oscillator are both increasing, the latter having made a bullish cross.
The RSI has generated hidden bullish divergence, a strong sign of trend continuation.
As long as the price does not close below $1, which seems extremely unlikely right now.
Future Movement
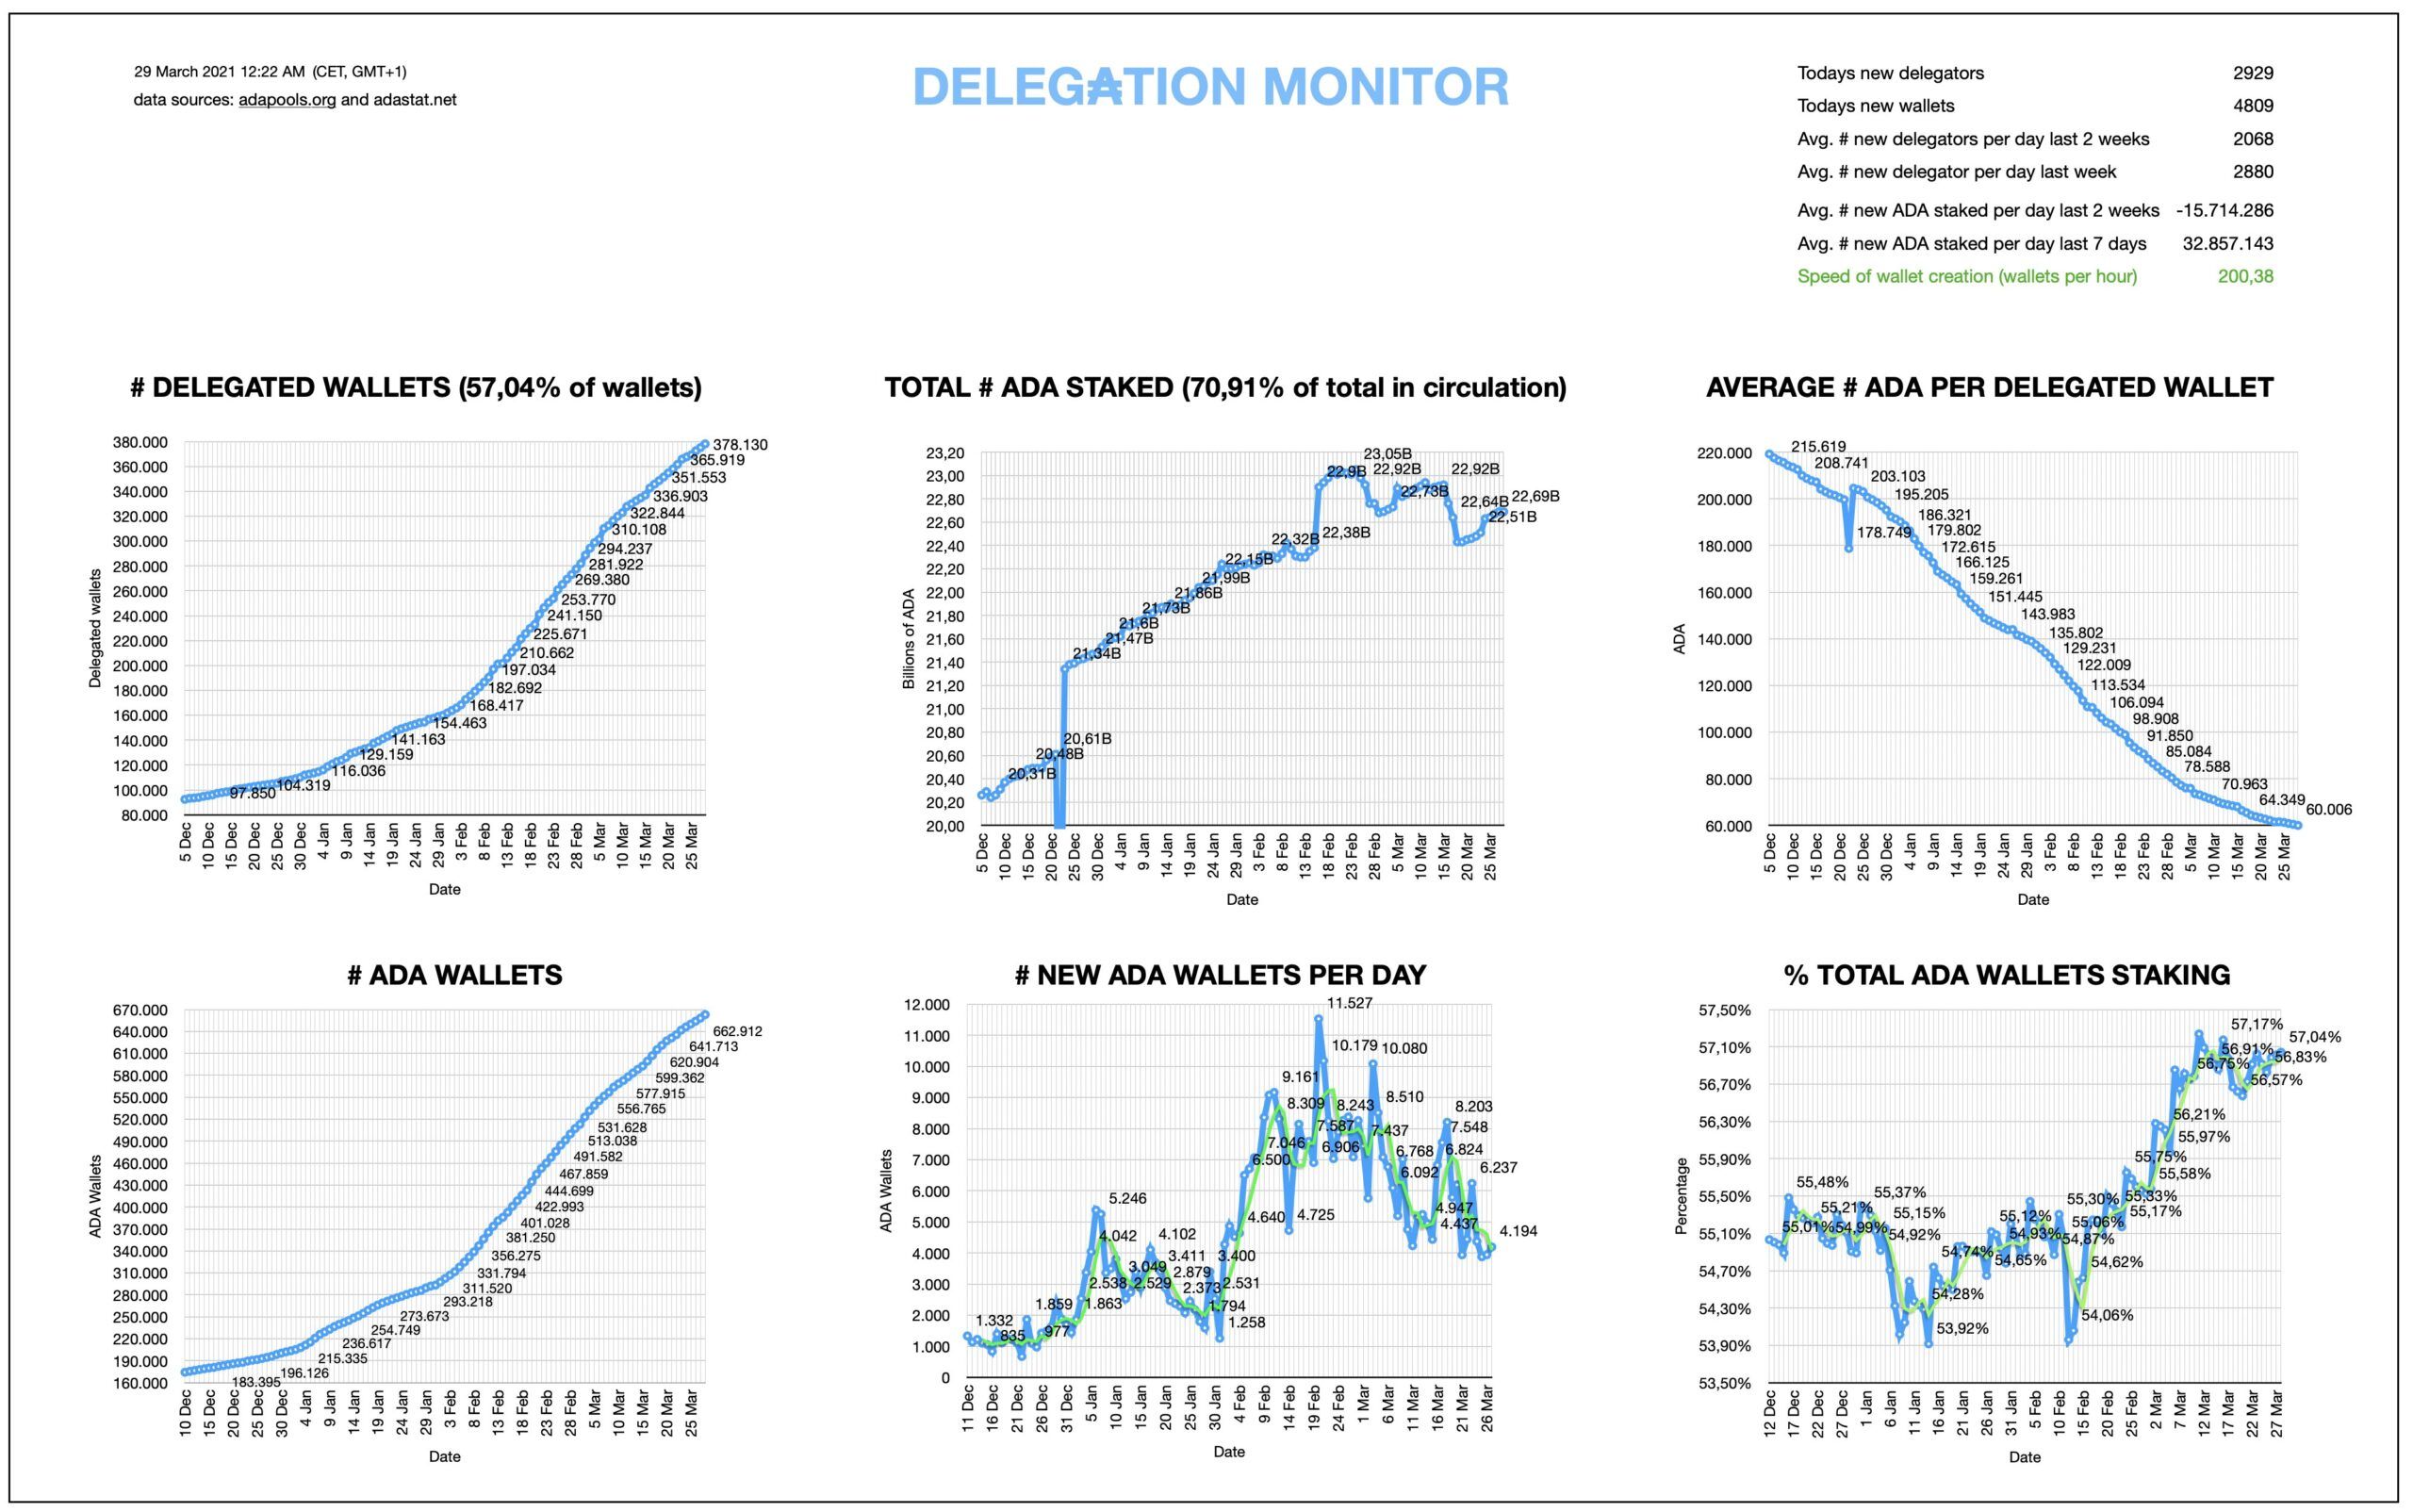
Cryptocurrency enthusiast @nierop_pieter tweeted an image, which shows both the number of ADA wallets and staked coins increasing considerably. This inherently means that more people join the network and are holding for the long-term due to their staking.
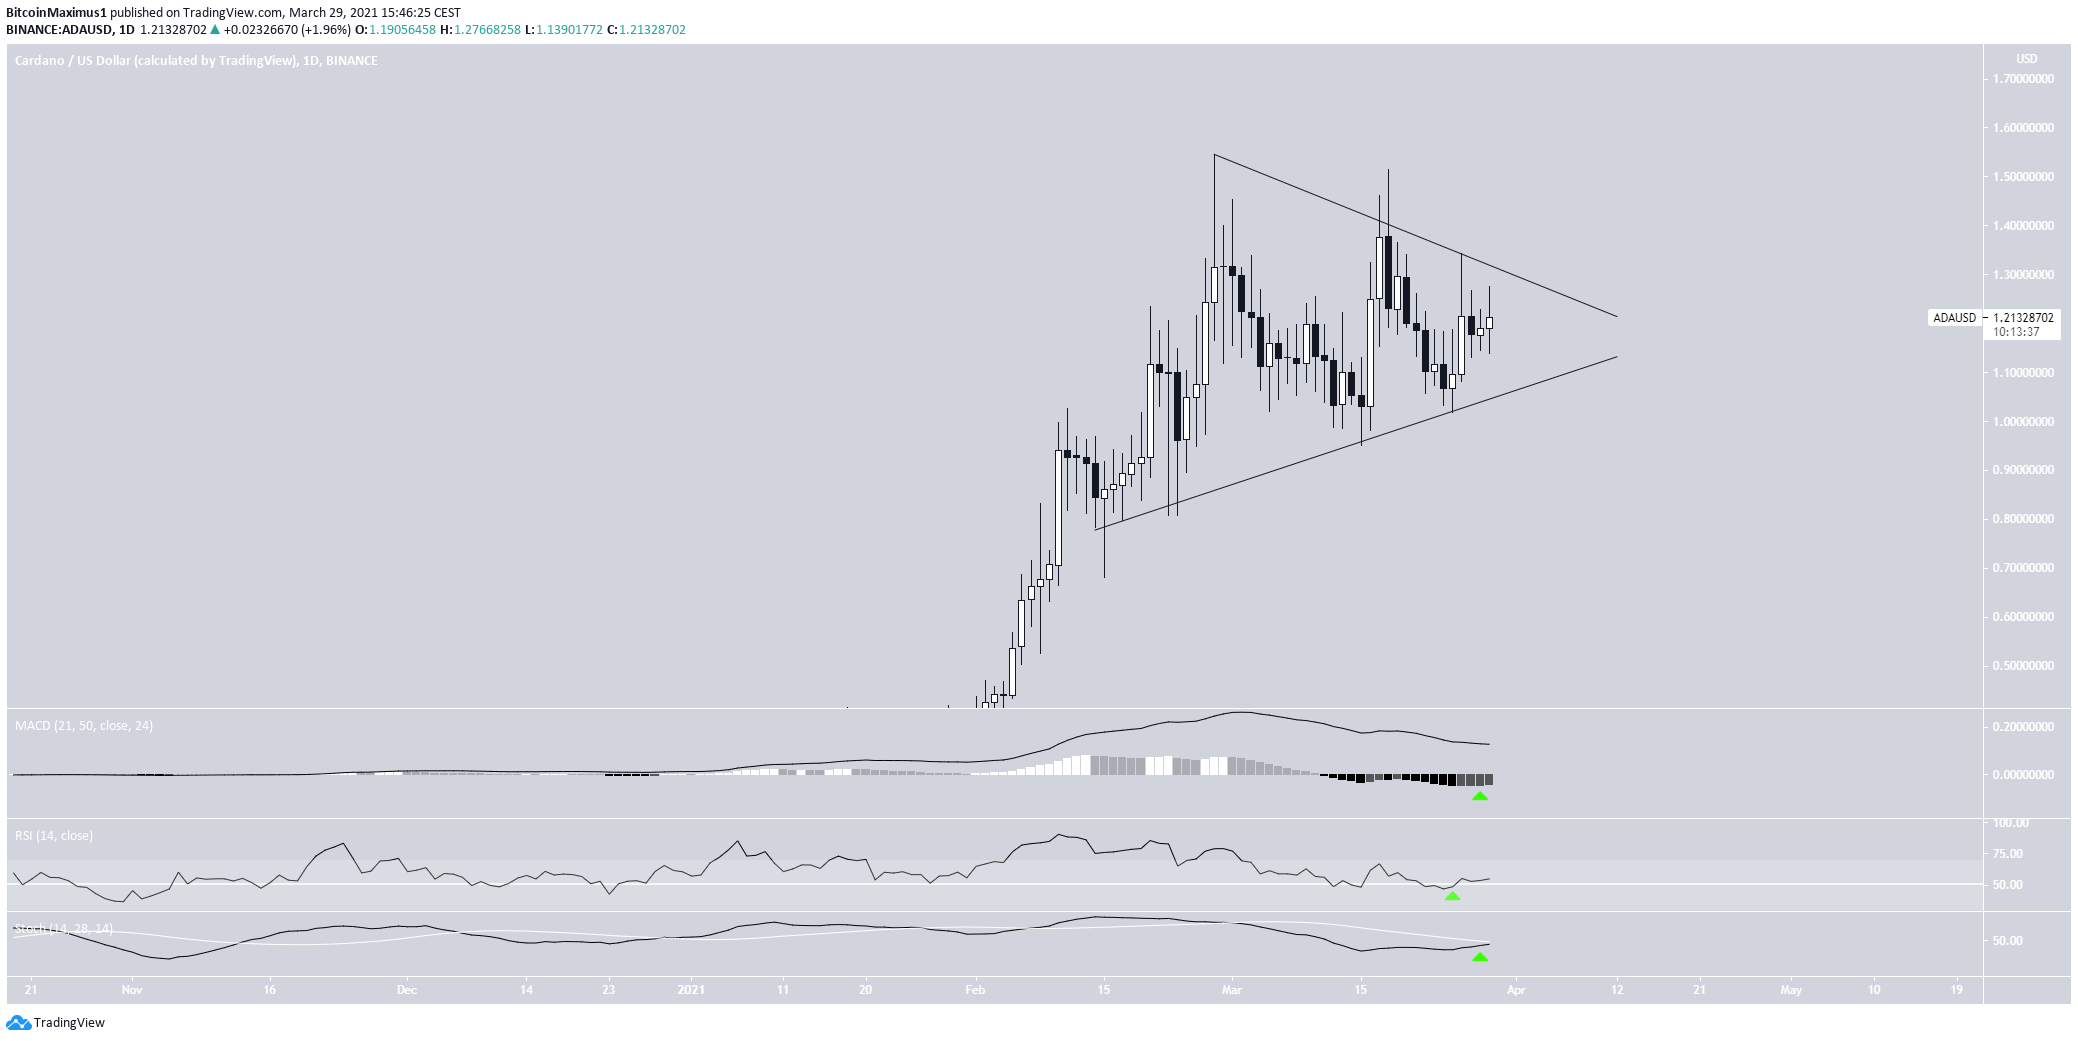
The daily chart also shows bullish signs.
The MACD has given a bullish reversal signal. The RSI has crossed above 50, and the Stochastic oscillator has made a bullish cross.
Therefore, it is likely that the token will break out from the current symmetrical triangle pattern.
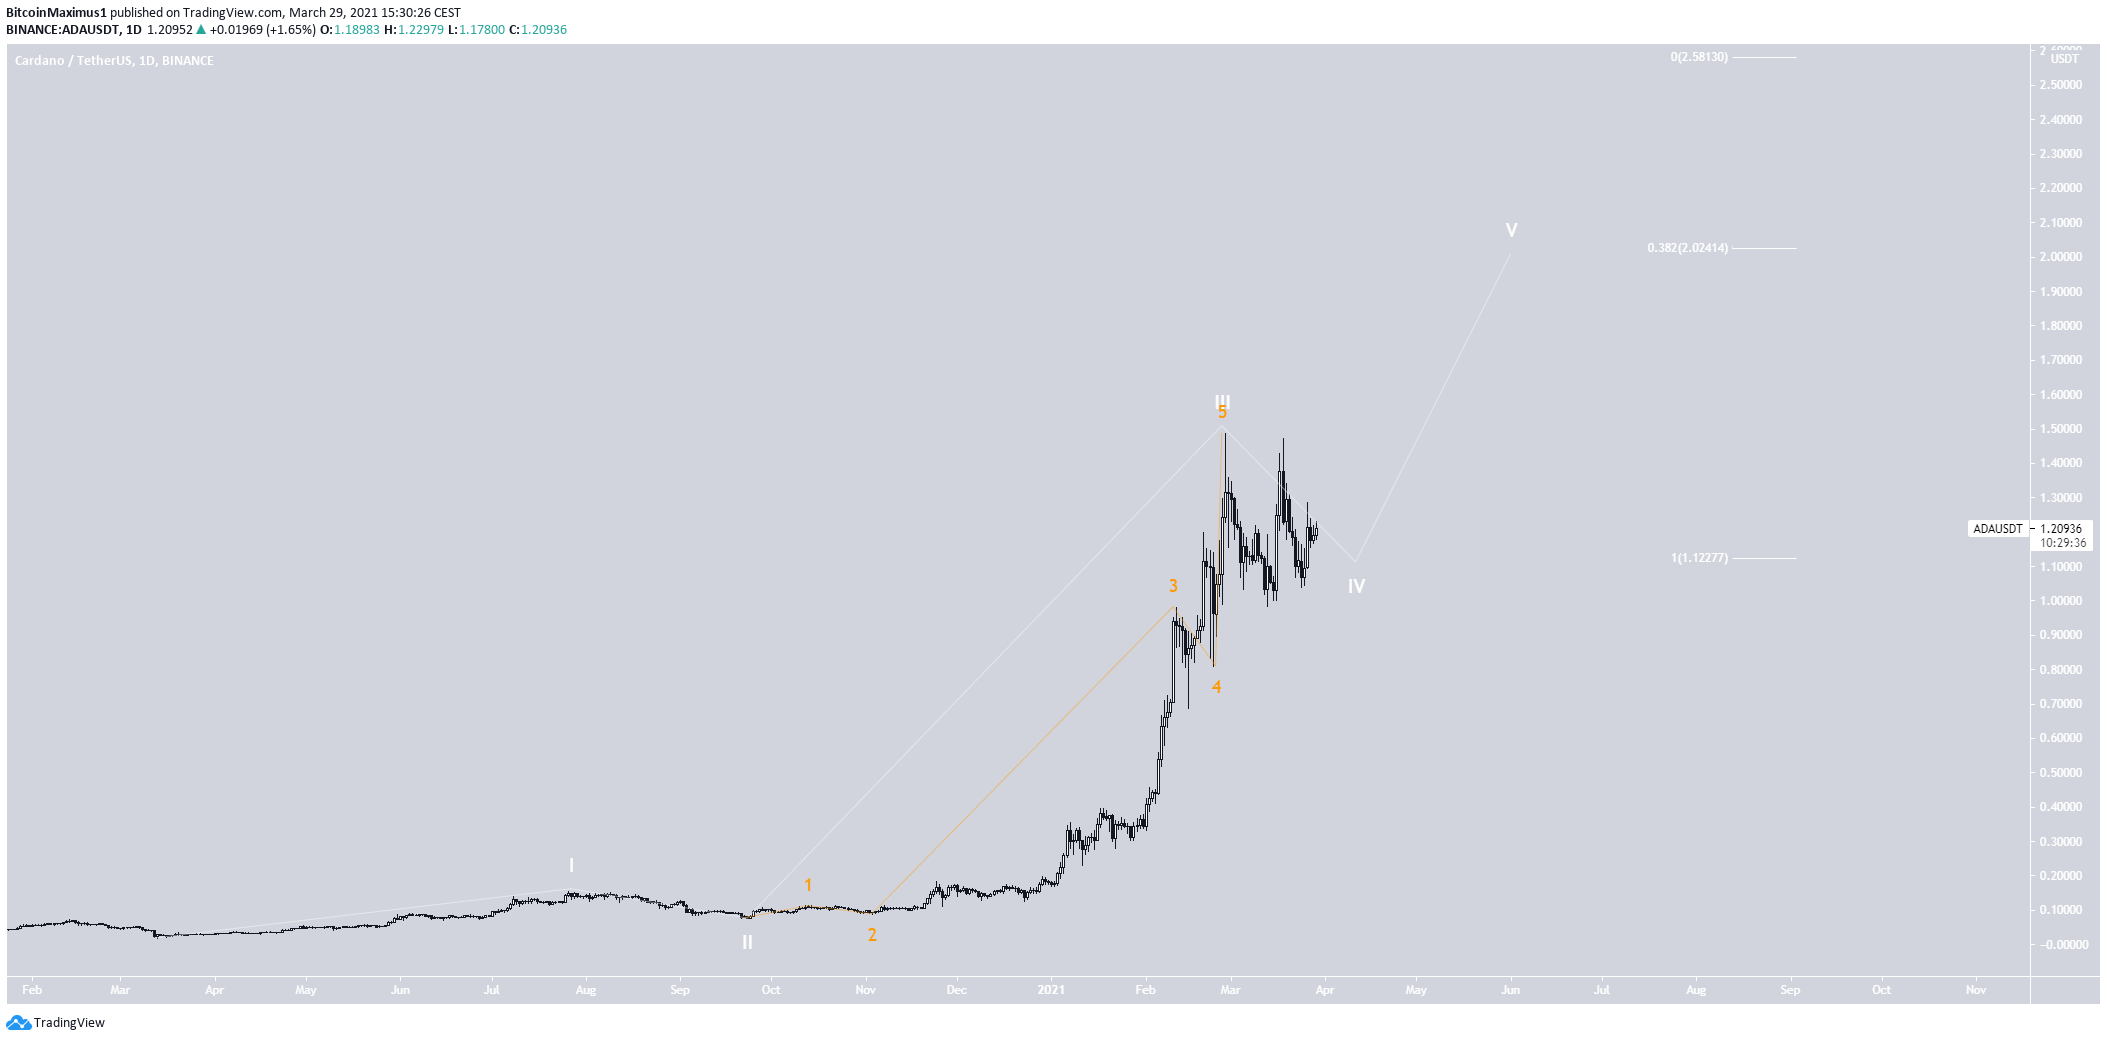
Wave Count For Cardano
The most likely wave count is that ADA is in wave four (white) of a bullish impulse that began on March 2020.
In this case, the price movement is potentially contained inside a symmetrical triangle as outlined in the previous section.
The two most likely targets for the top of the movement are located at $2.02 and $2.58, found by using a Fib projection on waves 1-3.
Conclusion
To conclude, cardano is expected to break out from the current symmetrical triangle pattern and gradually move towards a new all-time high price.
For BeInCrypto’s latest bitcoin (BTC) analysis, click here.


