
AB has emerged as today’s top gainer, climbing 7% in the past 24 hours despite a broader slowdown in trading activity.
While many digital assets have trended sideways or slipped over the past week, AB has bucked the trend with a steady rally. Up nearly 20% in the past seven days, the altcoin appears ready to keep climbing.
AB Outpaces the Market as Bulls Tighten Their Grip
On the daily chart, AB’s Aroon Up Line confirms the strength of its current rally. As of this writing, the metric is at 92.86%, indicating significant bull-side pressure in the market.
For token TA and market updates: Want more token insights like this? Sign up for Editor Harsh Notariya’s Daily Crypto Newsletter here.
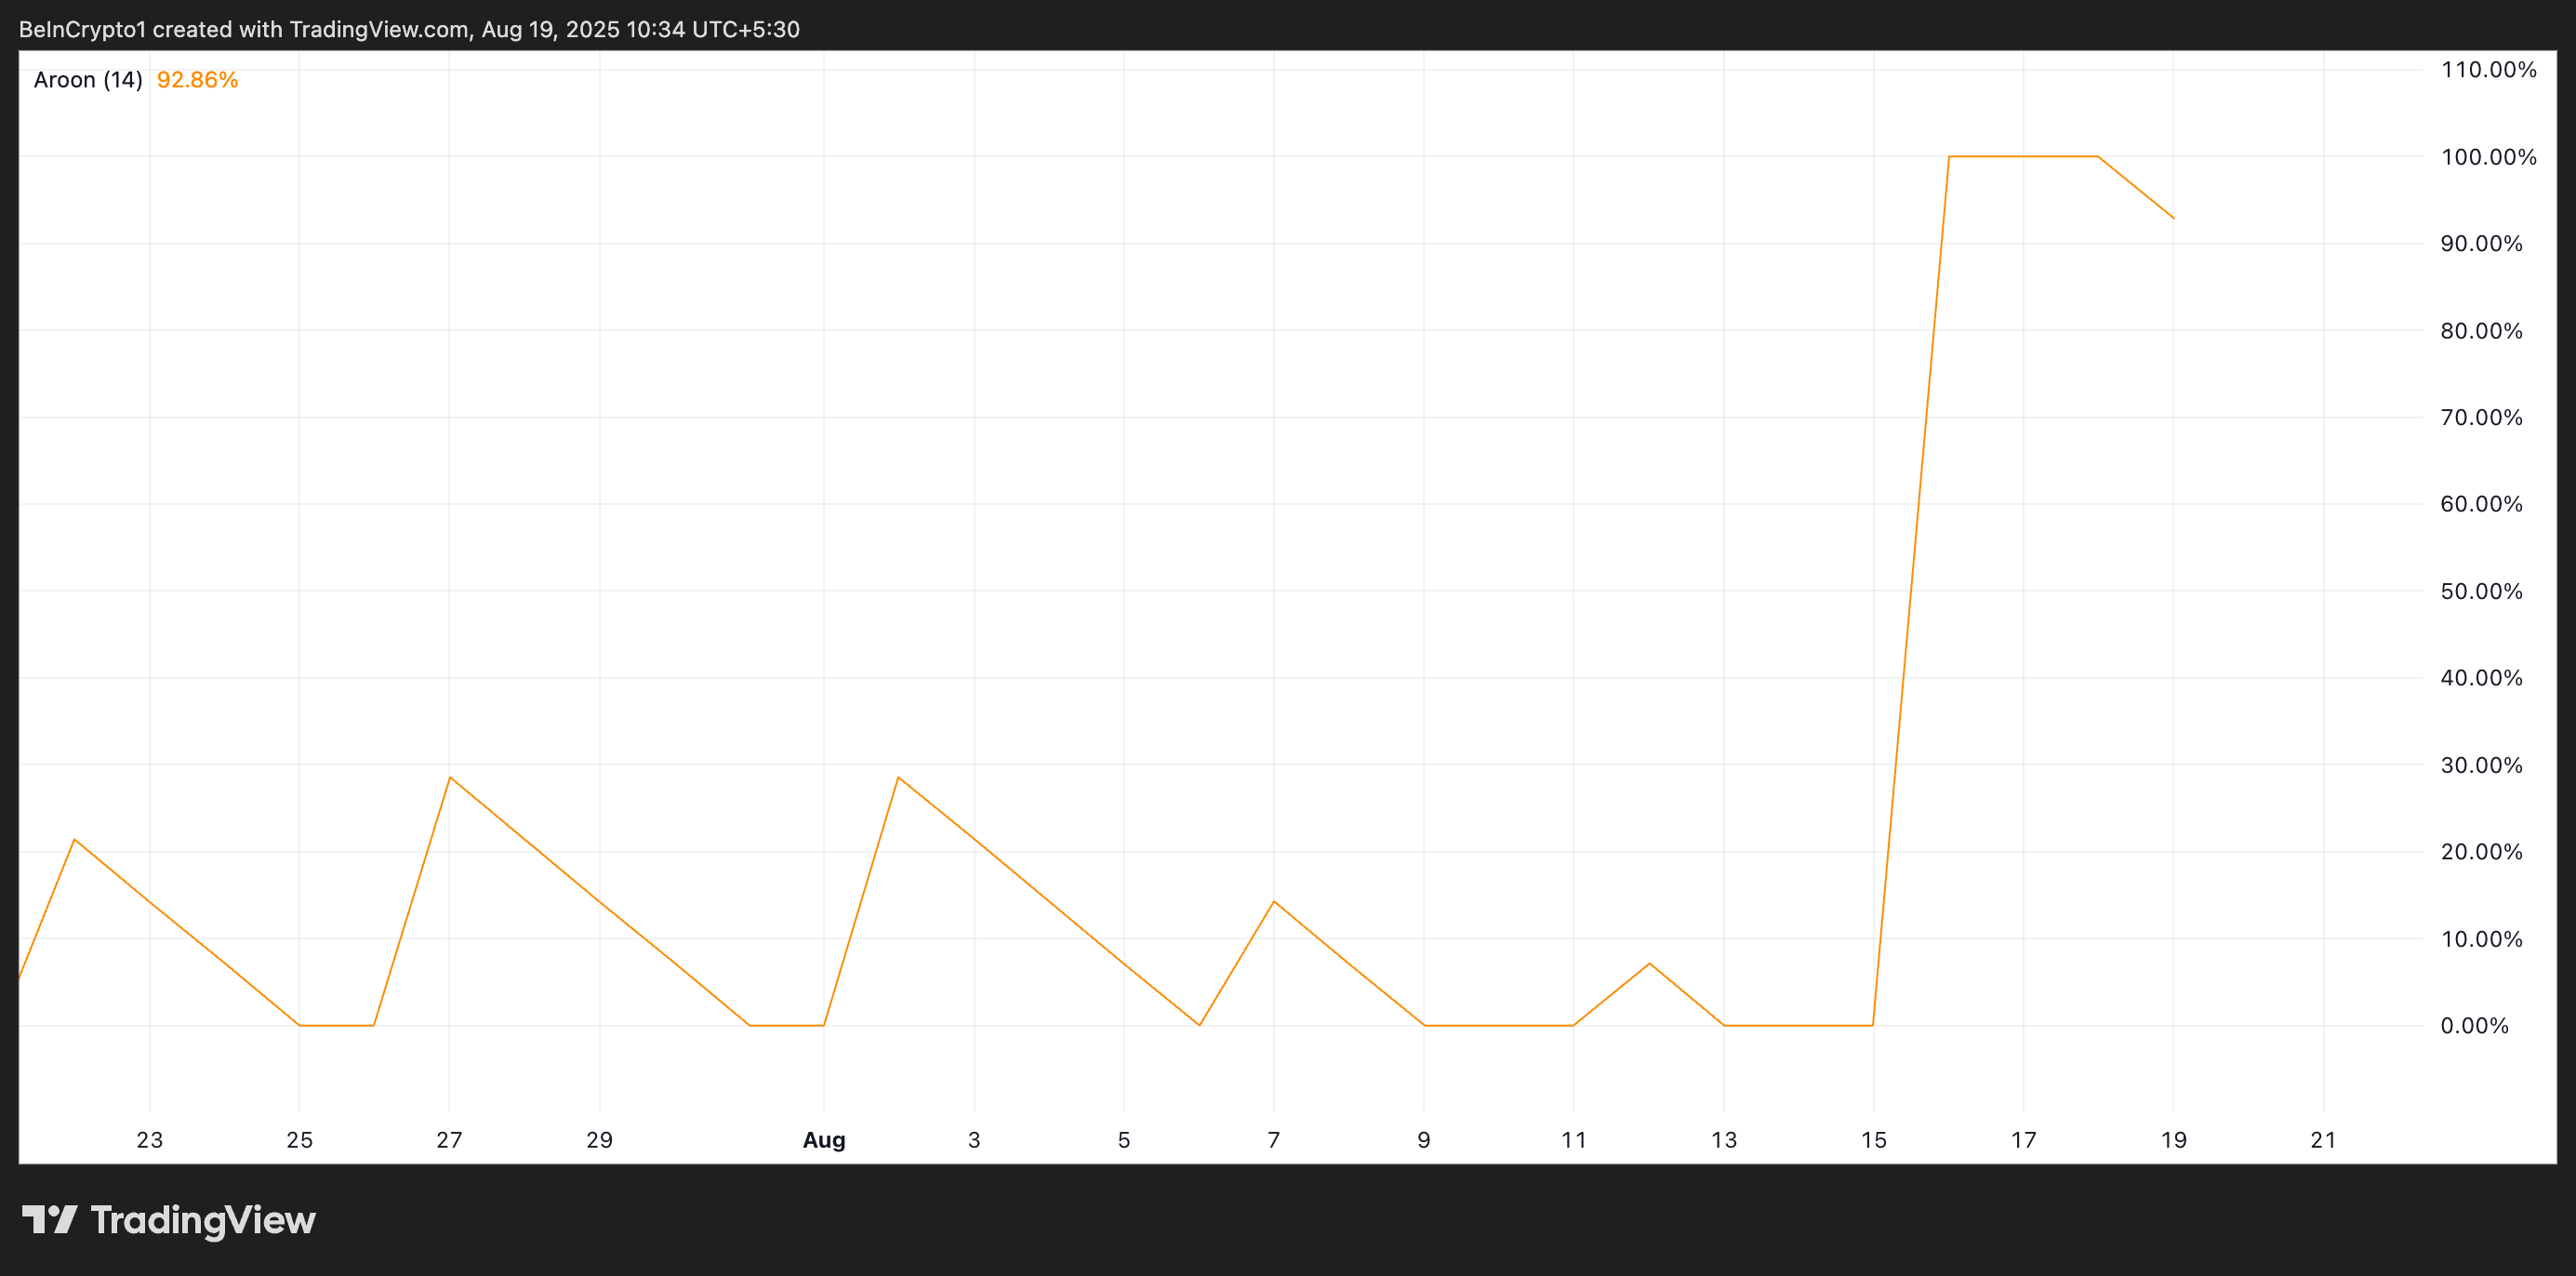
The Aroon indicator measures the strength and direction of a trend by analyzing the time since an asset’s recent highs (Aroon Up) and lows (Aroon Down).
When the Aroon Up line is at 100% or near it, an asset’s recent highs have become more frequent, strengthening the bullish momentum and the potential for a sustained uptrend. For AB, this validates its uptick in the past seven days and hints that its upward push may still have room to run.
Furthermore, readings from AB’s Directional Movement Index (DMI) support this bullish outlook. At press time, the token’s positive directional indicator (+DI; blue) rests above the negative directional indicator (-DI; blue), showing the bullish tilt in sentiment among AB holders.
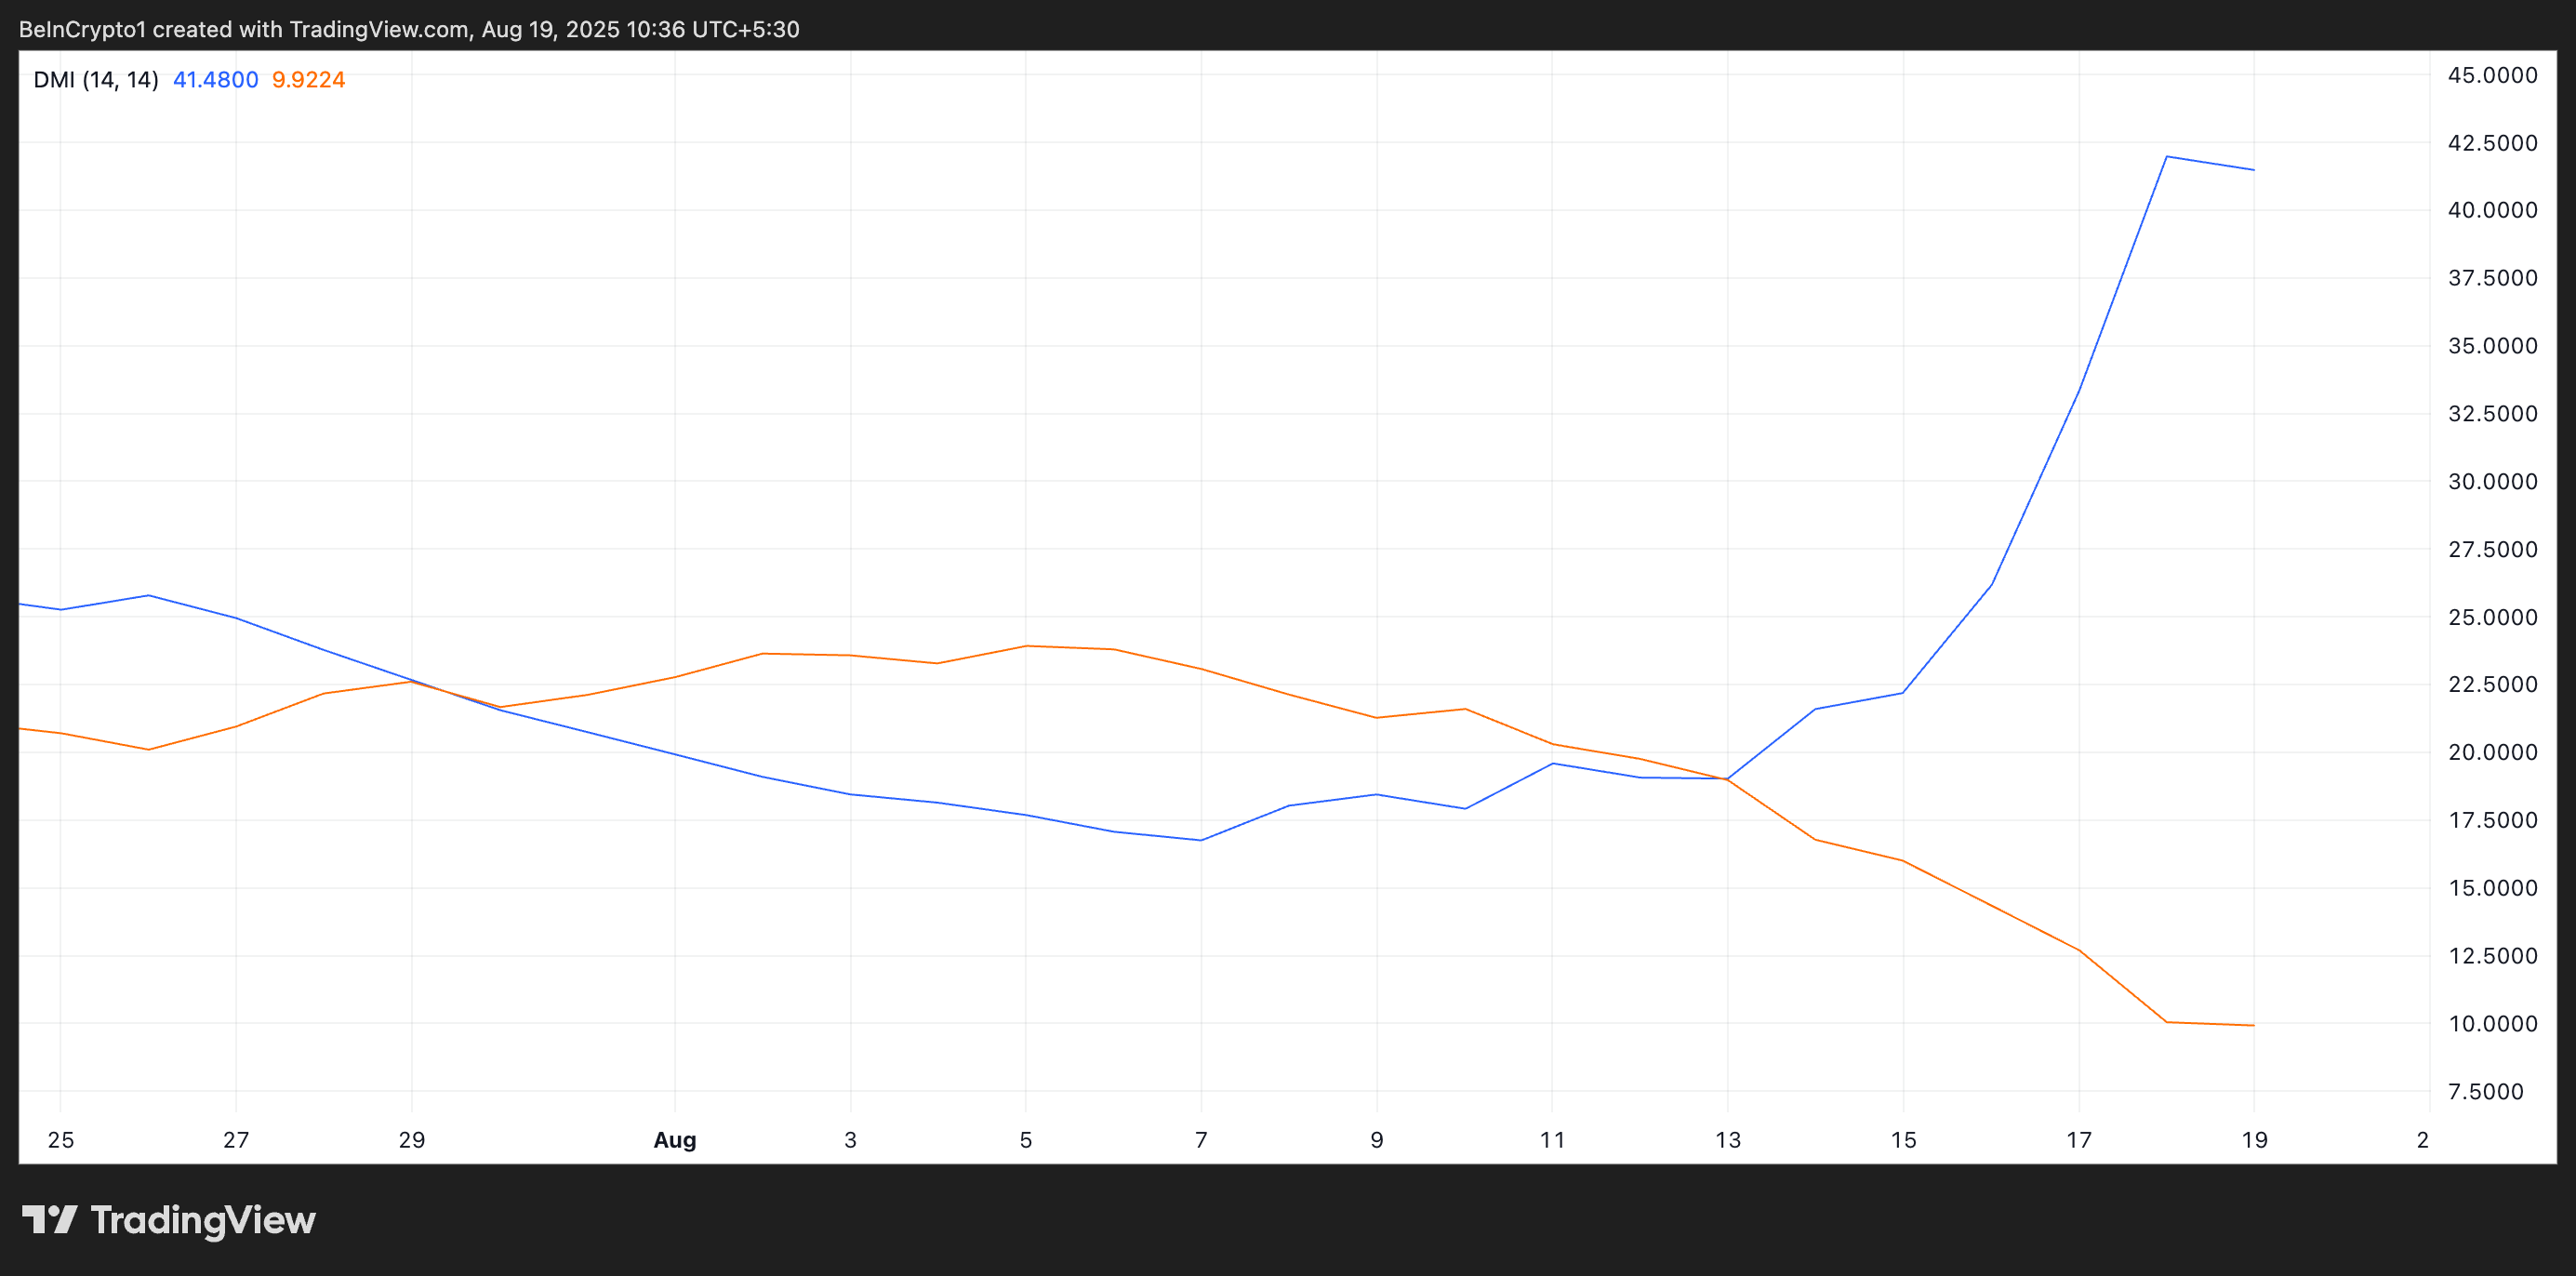
The DMI indicator measures the strength of an asset’s price trend. It consists of two lines: the +DI, which represents upward price movement, and the -DI, which means downward price movement.
When an asset’s +DI rests above its -DI, upward price movements are stronger than downward ones, indicating a bullish trend. The widening gap between the two lines on the AB/USD one-day chart confirms the stronger directional momentum in favor of the bulls.
AB Bulls Seek Breakout, Bears Lurk Below $0.0089
Sustained demand for AB could trigger an attempt to break above the long-term resistance at $0.0102. A successful breach of this barrier could open the door for a push toward $0.116.
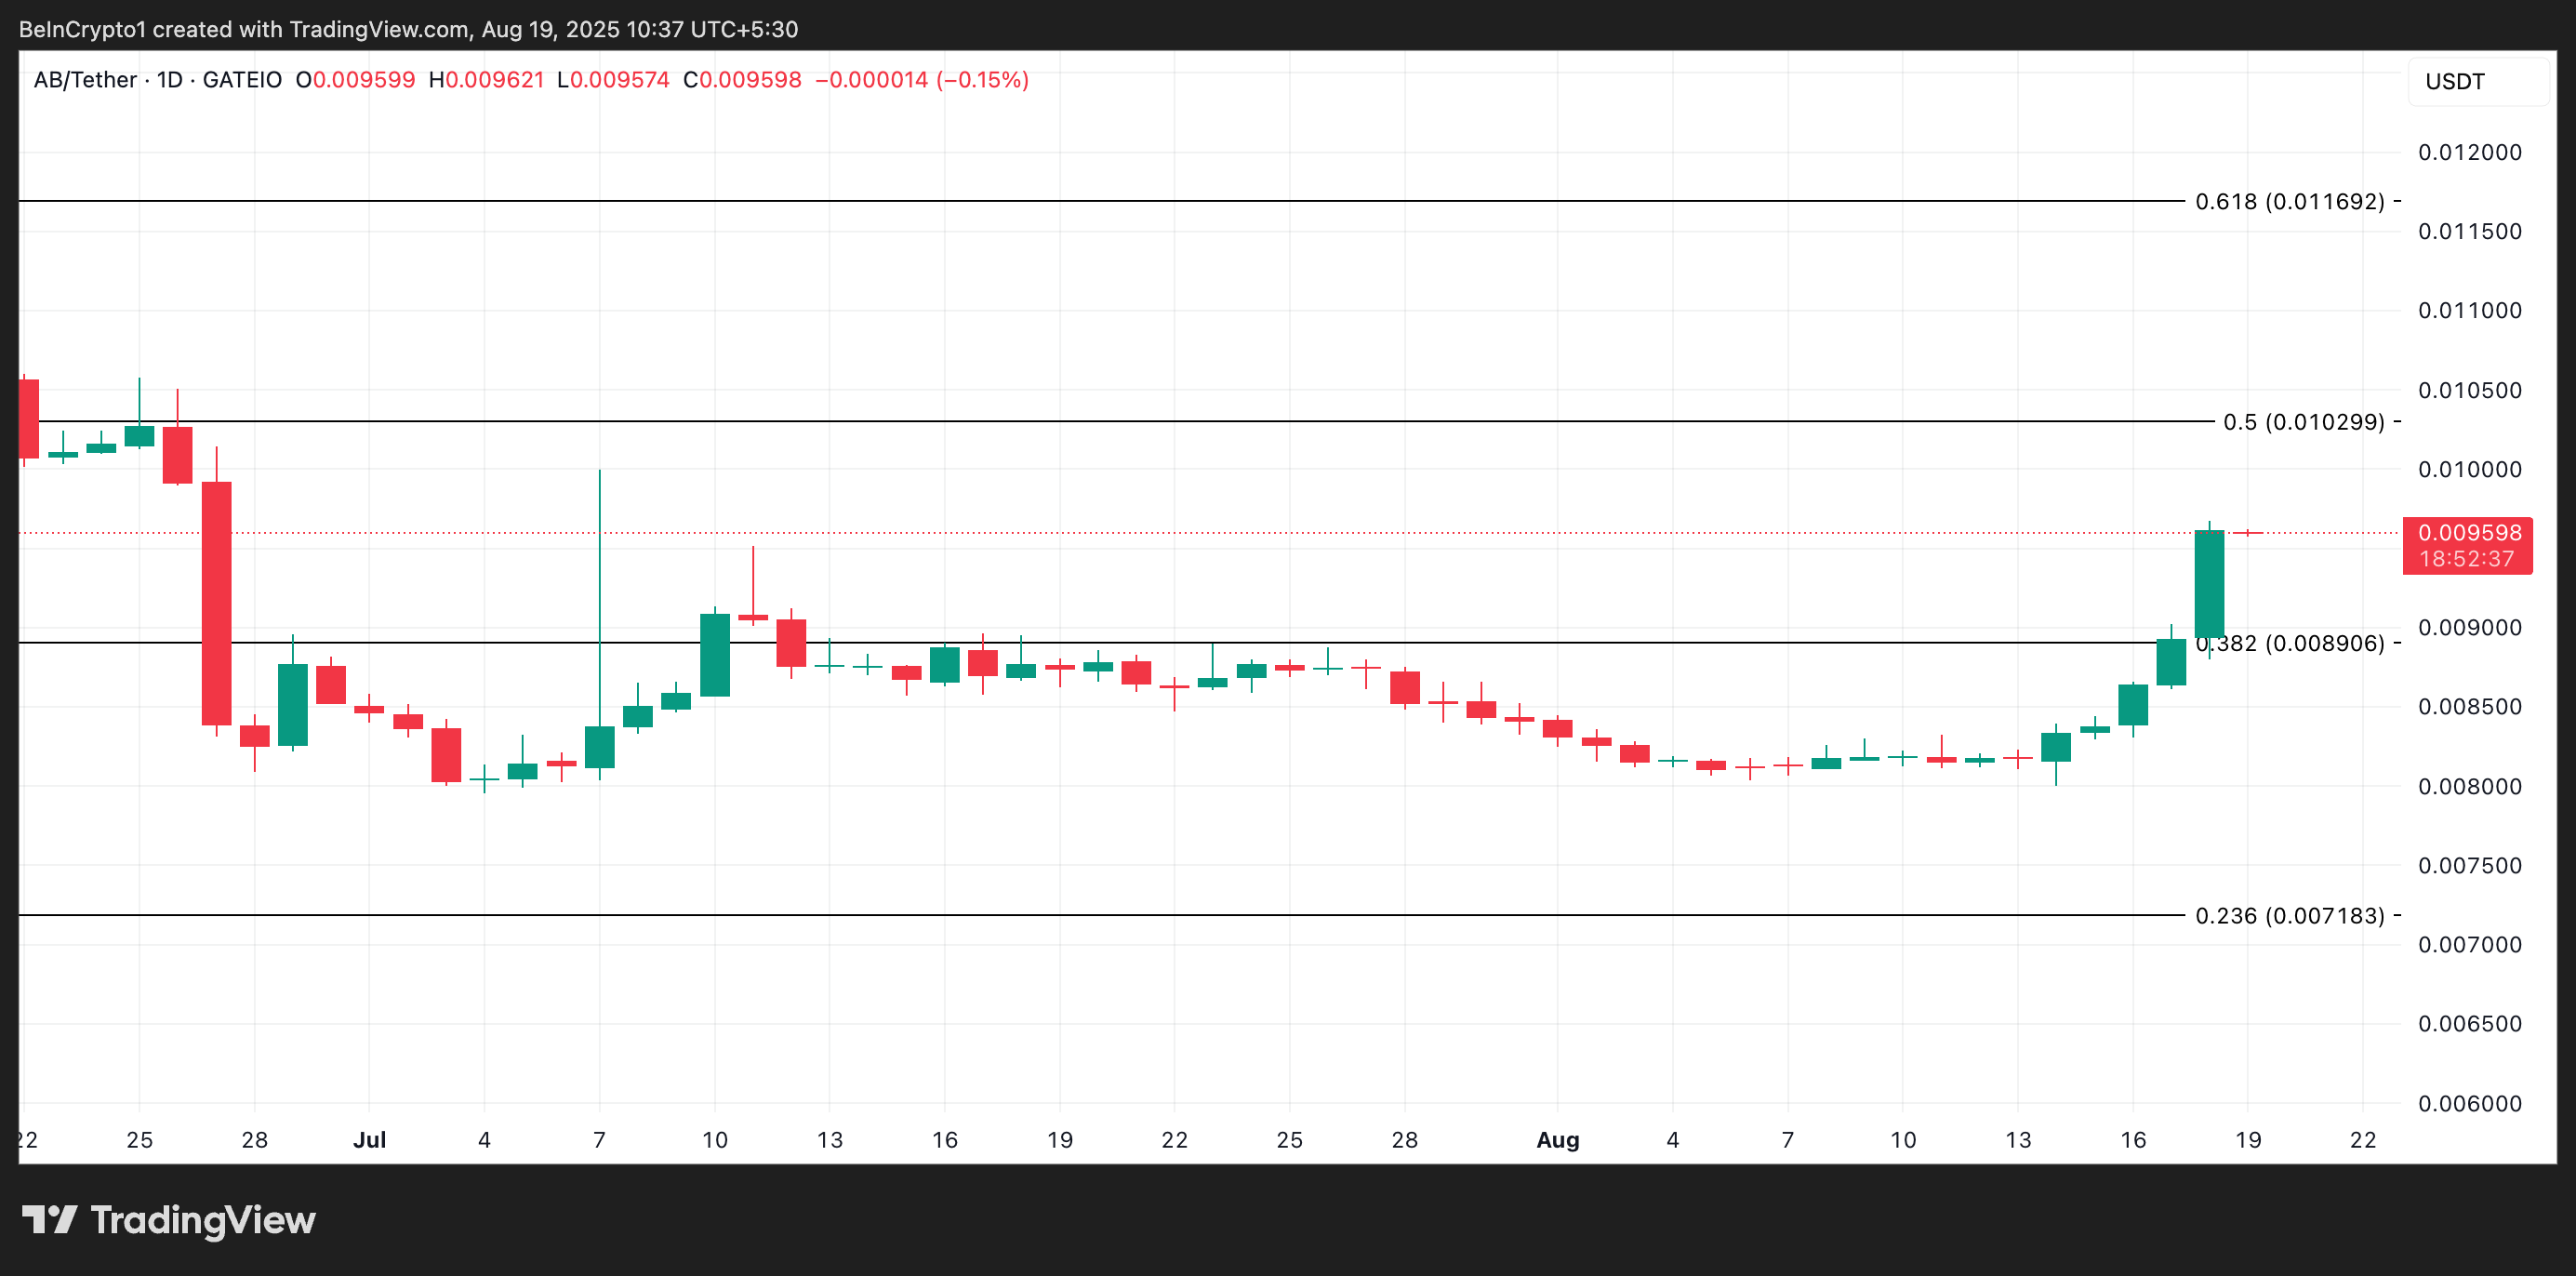
On the other hand, a decline in accumulation could drive a dip below $0.0089.
