


BeInCrypto looks at five altcoins that decreased the most from the entire crypto market last week, specifically from Dec. 23 – 30.
These digital assets have taken the crypto news and crypto market spotlight:
- Chain (XCN) price has decreased by 33.83%
- Solana (SOL) price has decreased by 22.87%
- Aptos (APT) price has decreased by 15.36%
- Axie Infinity (AXS) price has decreased by 15.00%
- The Sandbox (SAND) price has decreased by 14.68%
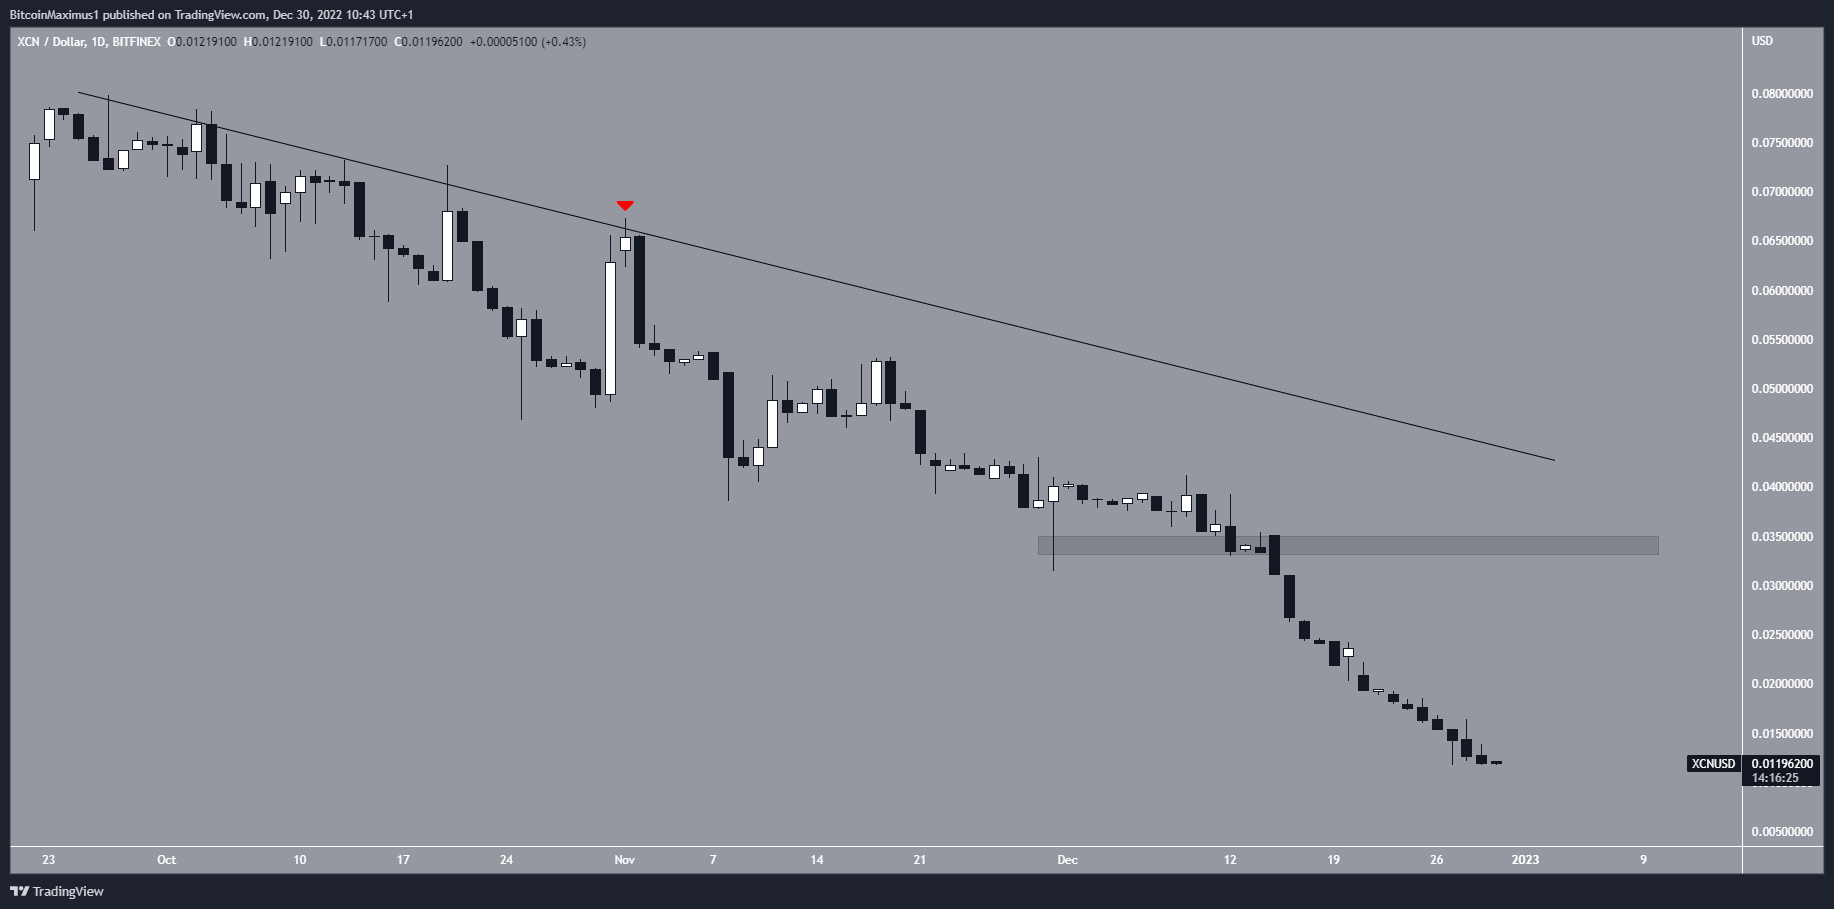
XCN is The Worst Performing Altcoin
The XCN price has fallen below a descending resistance line since Sept. 27. The line caused a rejection on Nov. 1 (red icon) leading to the acceleration of the downward movement. This led to a new all-time low of $0.011 on Dec. 30.
There are no reversal signs in place. As a result, the downward movement will likely continue. Reclaiming the $0.035 resistance area would indicate that a bullish reversal has begun instead.
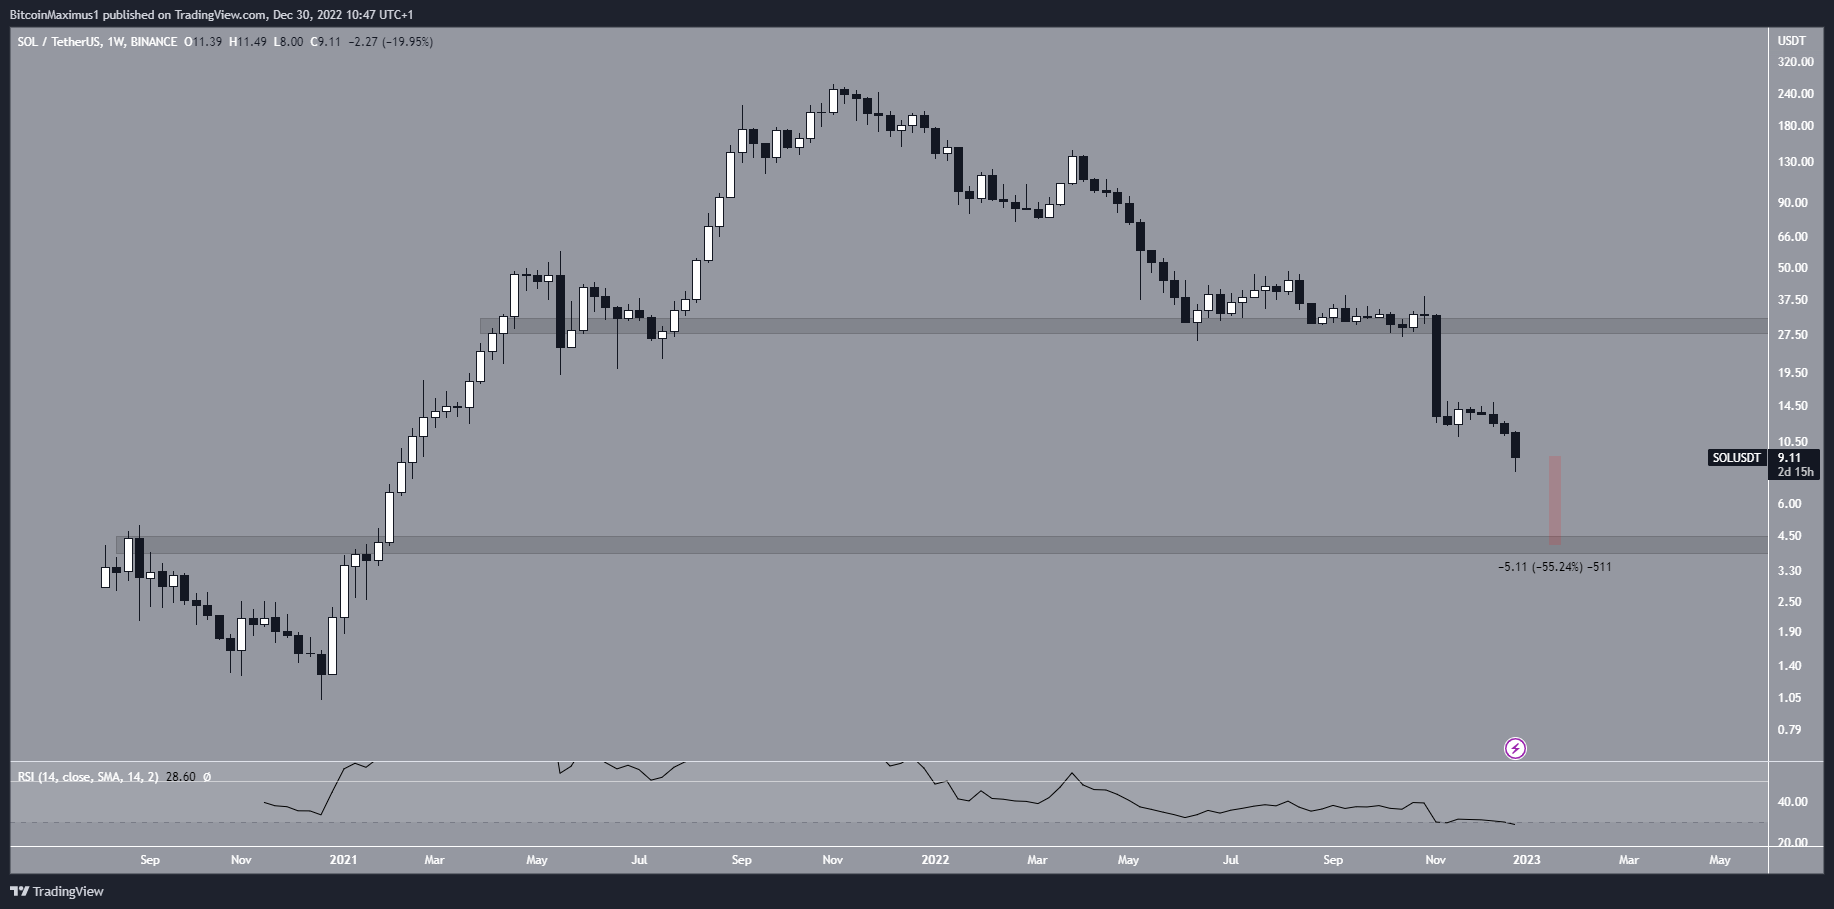
SOL Breaks Below Crucial Support
The SOL price broke down from the $30 horizontal support area during the first week of November. The downward movement has been swift, leading to a low of $8 on Dec. 30.
If the downward movement continues, the next closest support area is at $4.20, a 55% drop from the current price.
The weekly RSI has just dropped below 25 and has not generated any bullish divergence. This suggests that the trend is still bearish and makes the continuation of the downward movement likely.
The SOL price has to reclaim the $30 area in order for the trend to be considered bullish.
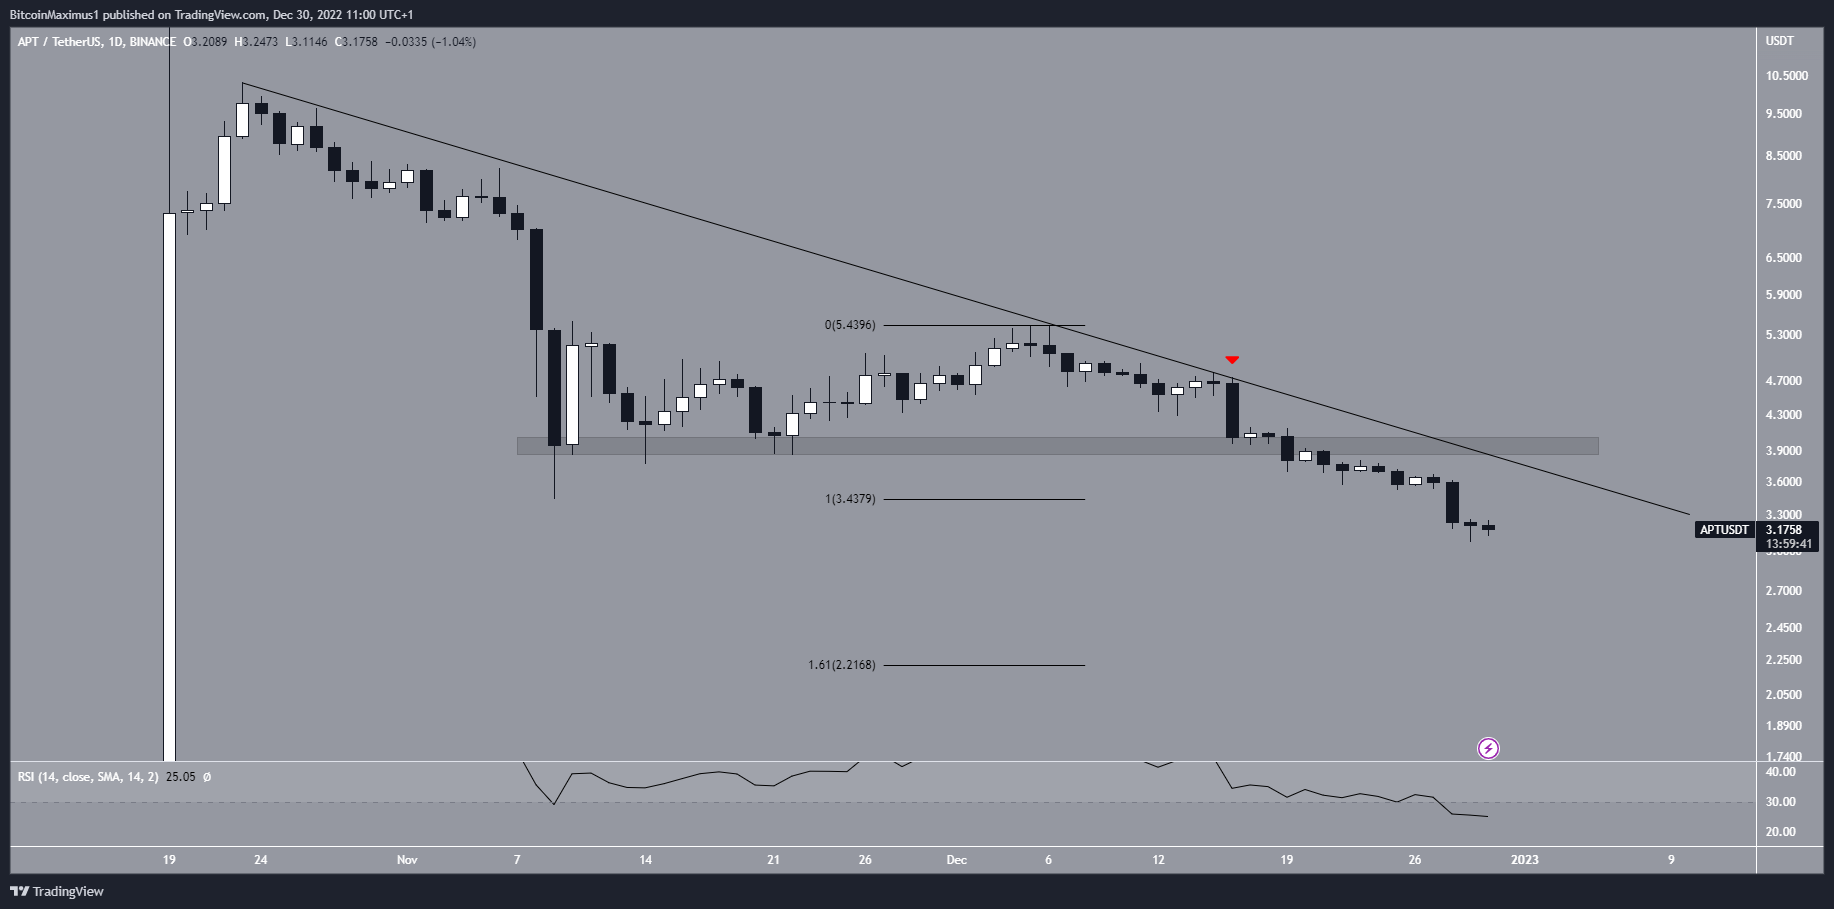
APT Resumes Downward Movement
The APT price has fallen below a descending resistance line since Oct. 23. More recently, the line caused a rejection on Dec. 16 (red icon) and broke down from the $3.95 support area the next day. This is an important development since the area had been in place since Nov. 8.
Similarly to SOL, the RSI fell below 30 and has not generated any bullish divergence.
If the downward movement continues, the closest support area would be at $2.22, created by the 1.61 external Fib retracement of the most recent bounce.
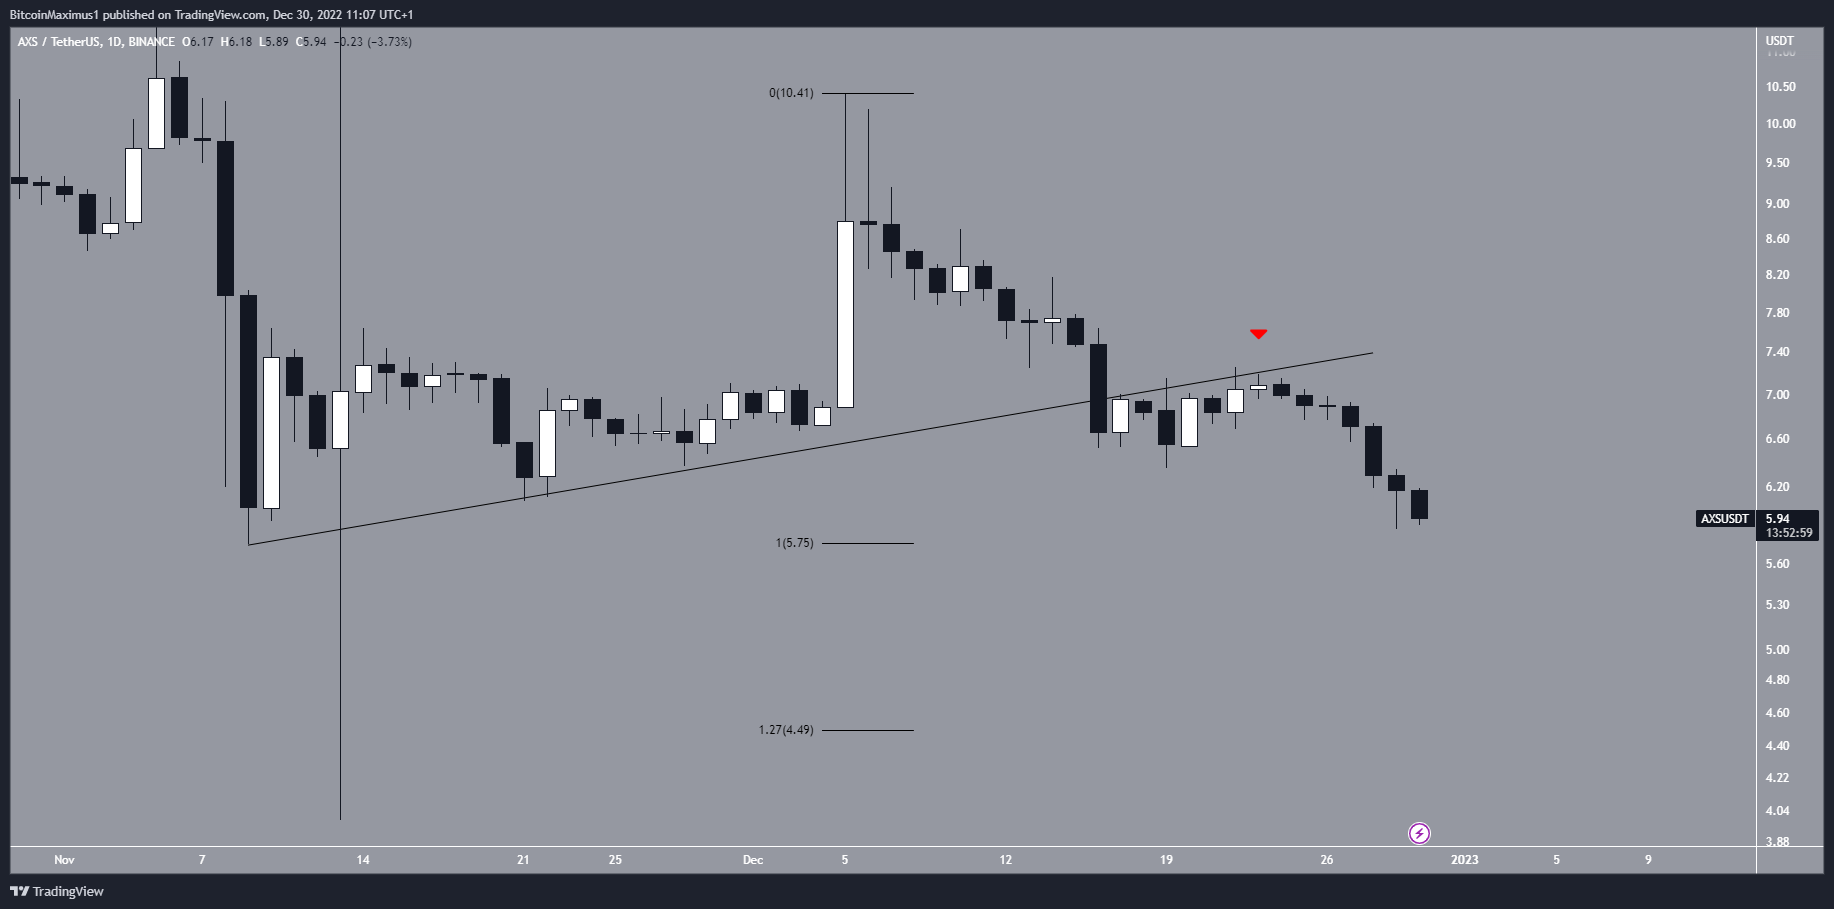
AXS Breaks Down From Ascending Support
The AXS price had increased alongside an ascending support line since Nov. 9. This upward movement led to a high of $10.40 on Dec. 5. However, the price has fallen since and broke down from the ascending support line on Dec. 16.
After validating it as resistance on Dec. 22 (red icon), the AXS price resumed its downward movement and is close to a new yearly low. If the decrease continues, the closest support area would be at $4.50, created by the 1.61 external Fib retracement of the most recent bounce.
Reclaiming the ascending support line would mean that the trend is bullish.
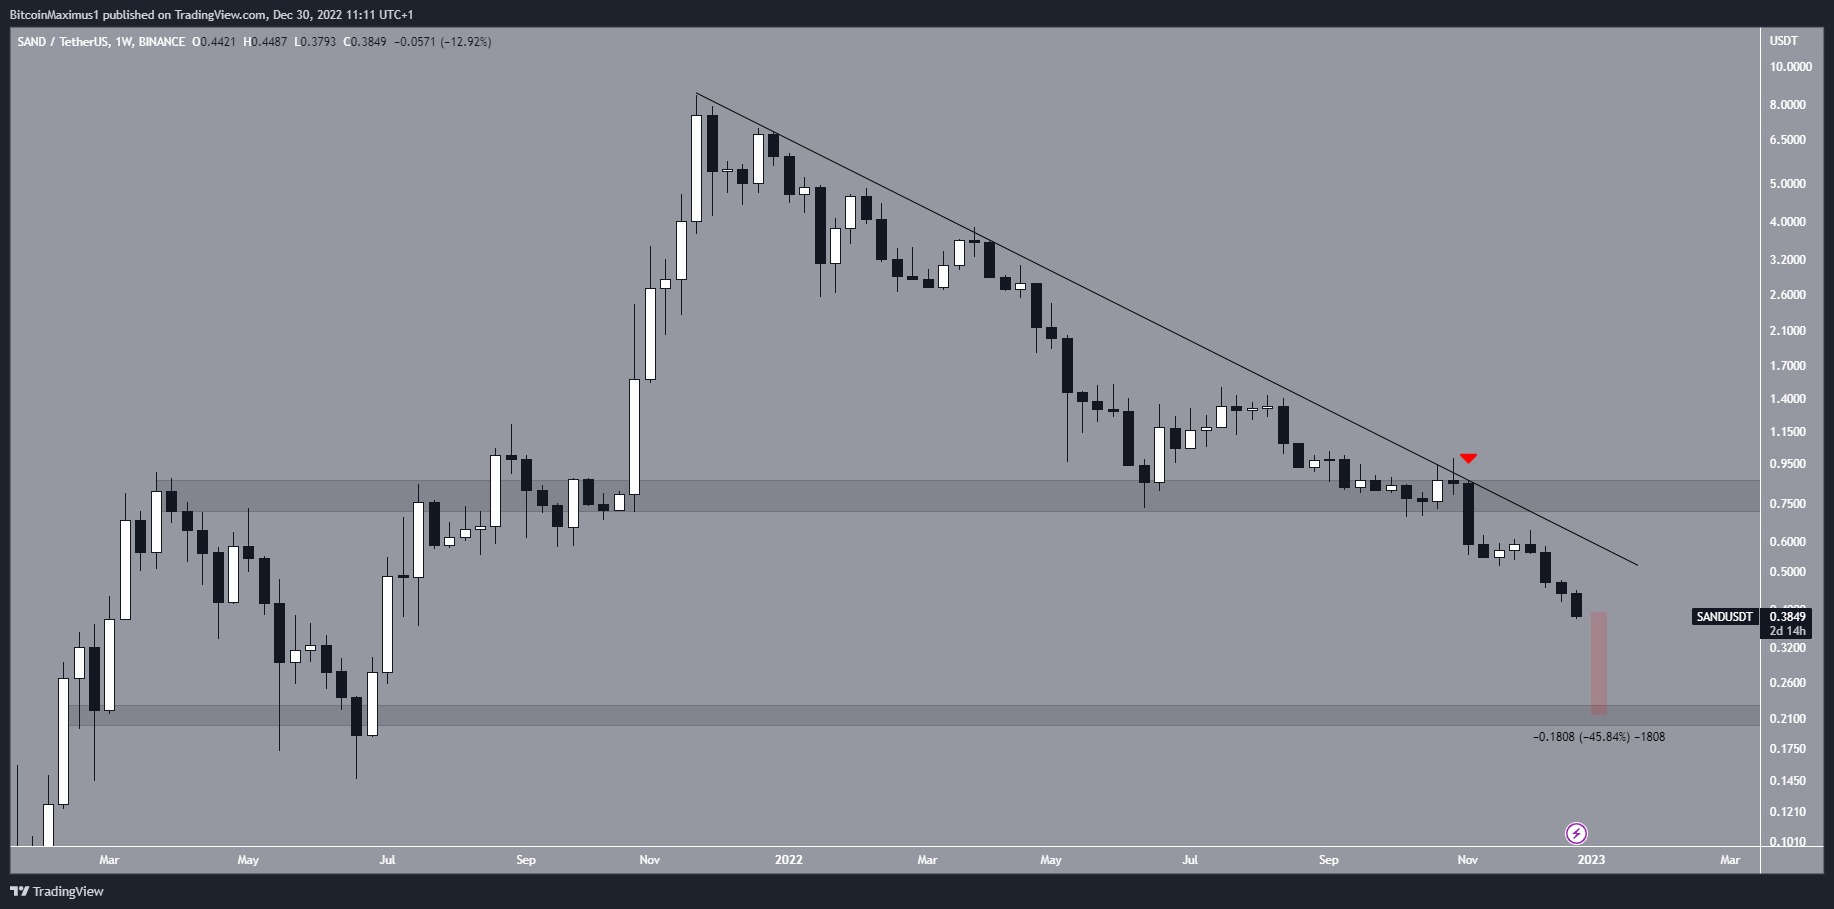
SAND Altcoin Could Fall by 45%
The SAND price has fallen below a descending resistance line since reaching an all-time high of $7.94 in Nov. 2021. The line caused a rejection in the first week of November (red icon), breaking down from the $0.80 horizontal support area in the process. This led to a low of $0.38 on Dec. 29.
If the downward movement continues, the closest support area would be at $0.21, a drop of 46% from the current price.
On the other hand, reclaiming the $0.80 resistance area would mean that the trend is bullish instead.
For BeInCrypto’s latest crypto market analysis, click here.


