
The final week of March 2026 is drawing attention to the meme coin sector. Select tokens are showing chart structures that stand apart from the broader market pullback.
BeInCrypto has analysed three such meme coins that investors should watch heading toward the end of March.
Siren (SIREN)
Siren (SIREN) is trading at $2.44, after surging 163% from its March 21 base in just two days. The all-time high at $4.72 sits roughly 90% above the current price, and a measured move annotation on the chart targets that level.
The CMF, however, reads -0.10 — and has been negative since March 20, through the entire rally. The meme coin’s price made new highs. Money flow did not follow. That divergence is the defining feature of this trade.
Want more token insights like this? Sign up for Editor Harsh Notariya’s Daily Crypto Newsletter here.
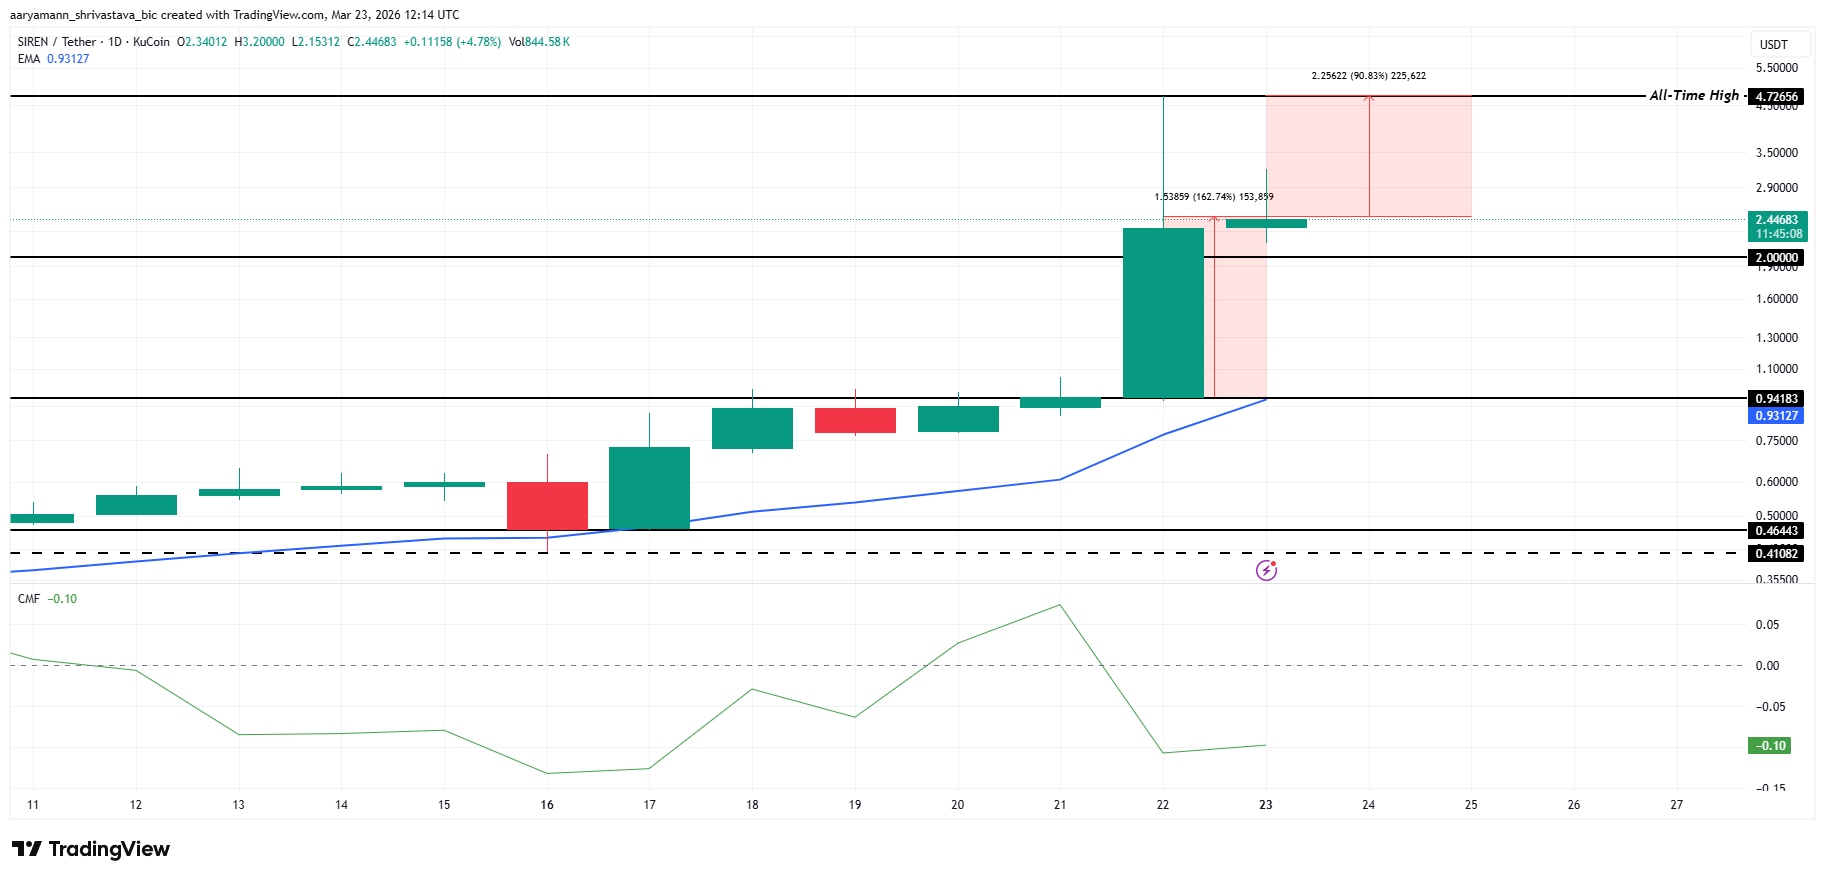
Negative CMF during a vertical price spike means sellers are using the rally to distribute. Volume is not confirming the move upward. The distribution zone marked on the chart from March 22–25 places the current price squarely inside a high-risk area. The $2.00 level and the EMA at $0.93 are the key floors to watch on any reversal.
Memecore (M)
MemeCore (M) is trading at $1.711, up 1.57%, consolidating just below the Fibonacci 0.786 level at $1.852 — the top of the annotated measured move zone from the March 18 breakout. The meme coin’s price crossed back above the EMA at $1.613, which now provides rising support.
The MFI reads 58.67, neutral and pointing higher without being stretched. It has not reached the 80 overbought threshold, meaning there is room for additional buying pressure to build before the indicator signals exhaustion.
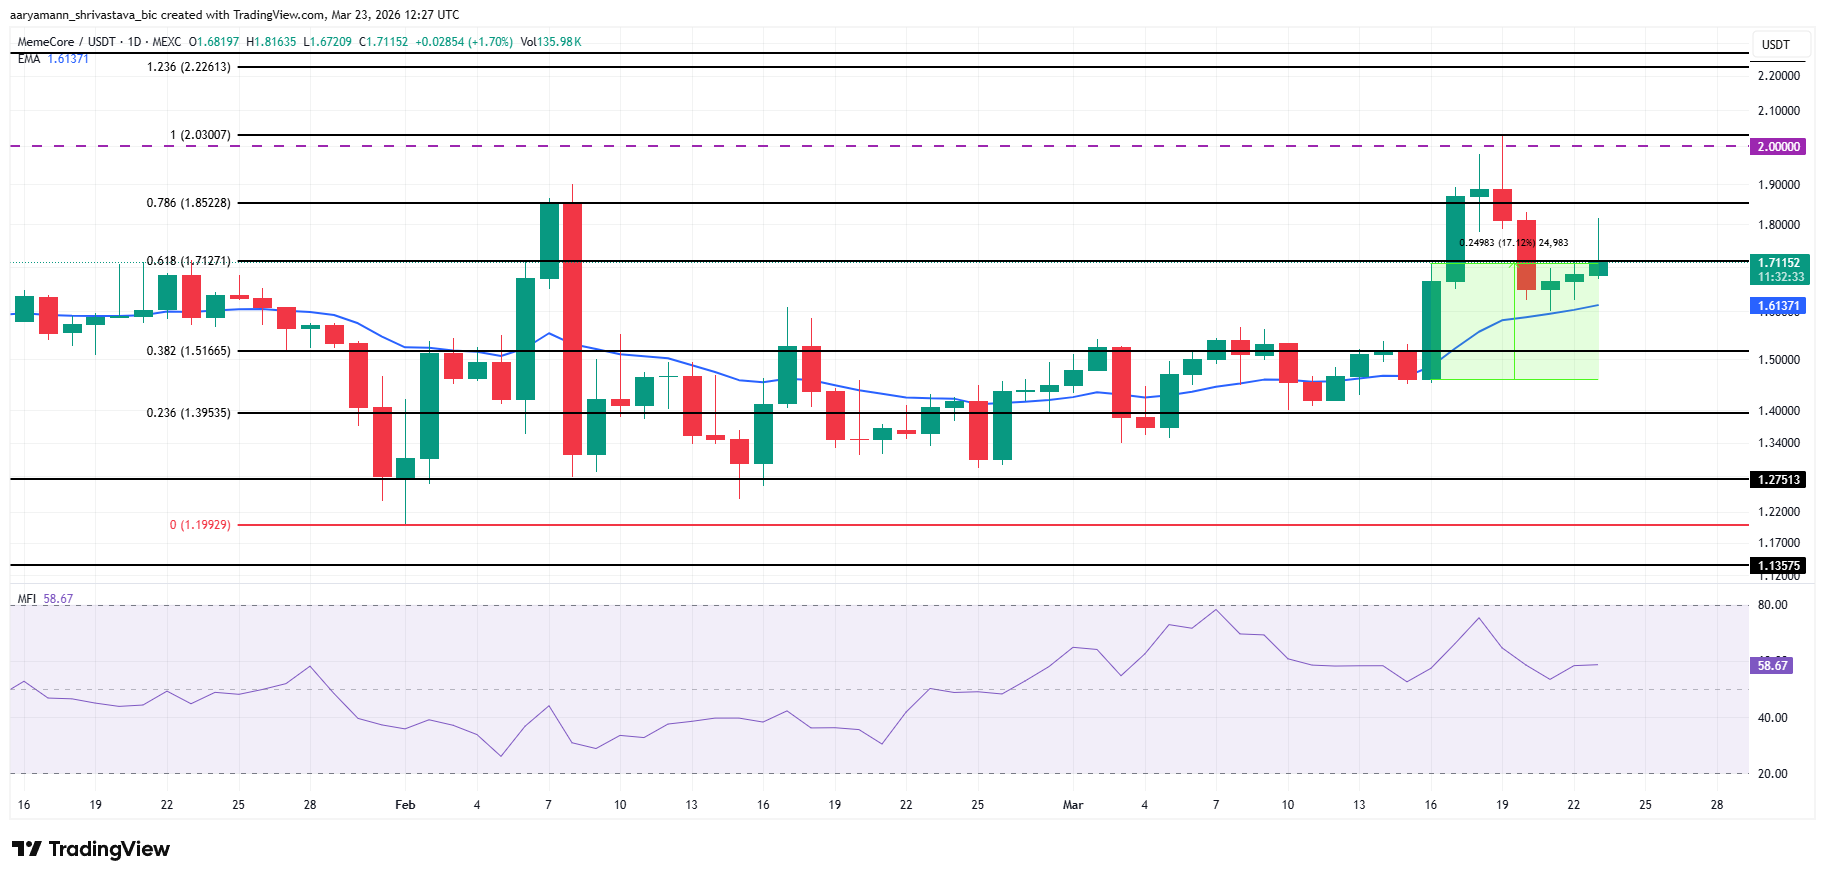
The immediate test is a daily close above $1.712. That clears the 0.618 level and opens the Fibonacci 1.0 extension at $2.030, followed by the Fibonacci 1.236 extension at $2.226. The $1.613 EMA is the line in the sand for bulls. A close below it would reopen the 0.382 level at $1.516.
OFFICIAL TRUMP (TRUMP)
Official Trump (TRUMP) is trading at $3.254, up 1.88%, but On-Balance Volume peaked around March 13–14 and has declined from approximately -$120 million to -$148.96 million since. OBV falling while the meme coin’s price temporarily recovered is the volume signature of distribution, not accumulation.
The first 21.15% measured move from the March 13 peak has already played out, bringing the price from $4.04 to the $3.39 Fibonacci 0.382 level. A second measured move of -15.23% is now annotated, targeting $2.705 — the all-time low, marked in red on the chart.
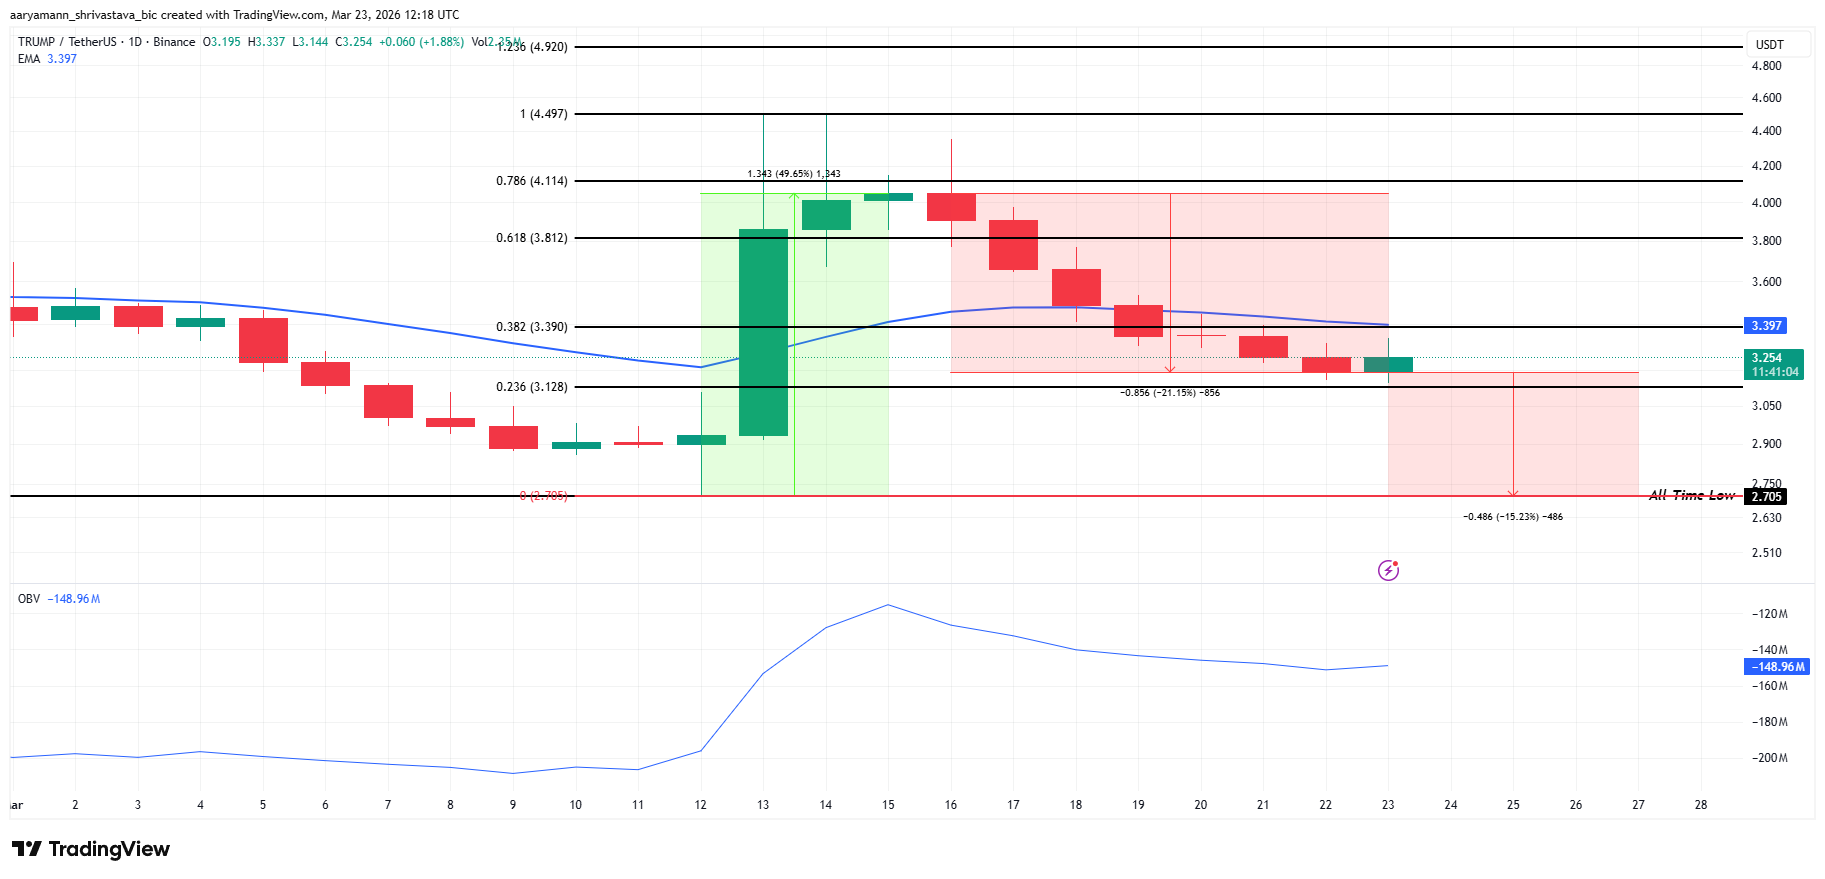
The EMA at $3.397 sits above the current price, adding resistance. The meme coin needs to clear the EMA and reclaim $3.39 on a daily close to interrupt the pattern. Without that, the OBV trend and the measured move structure point to new lows before the month ends.
