Altcoin Price Highlights
- The total altcoin market cap provides a bullish outlook.
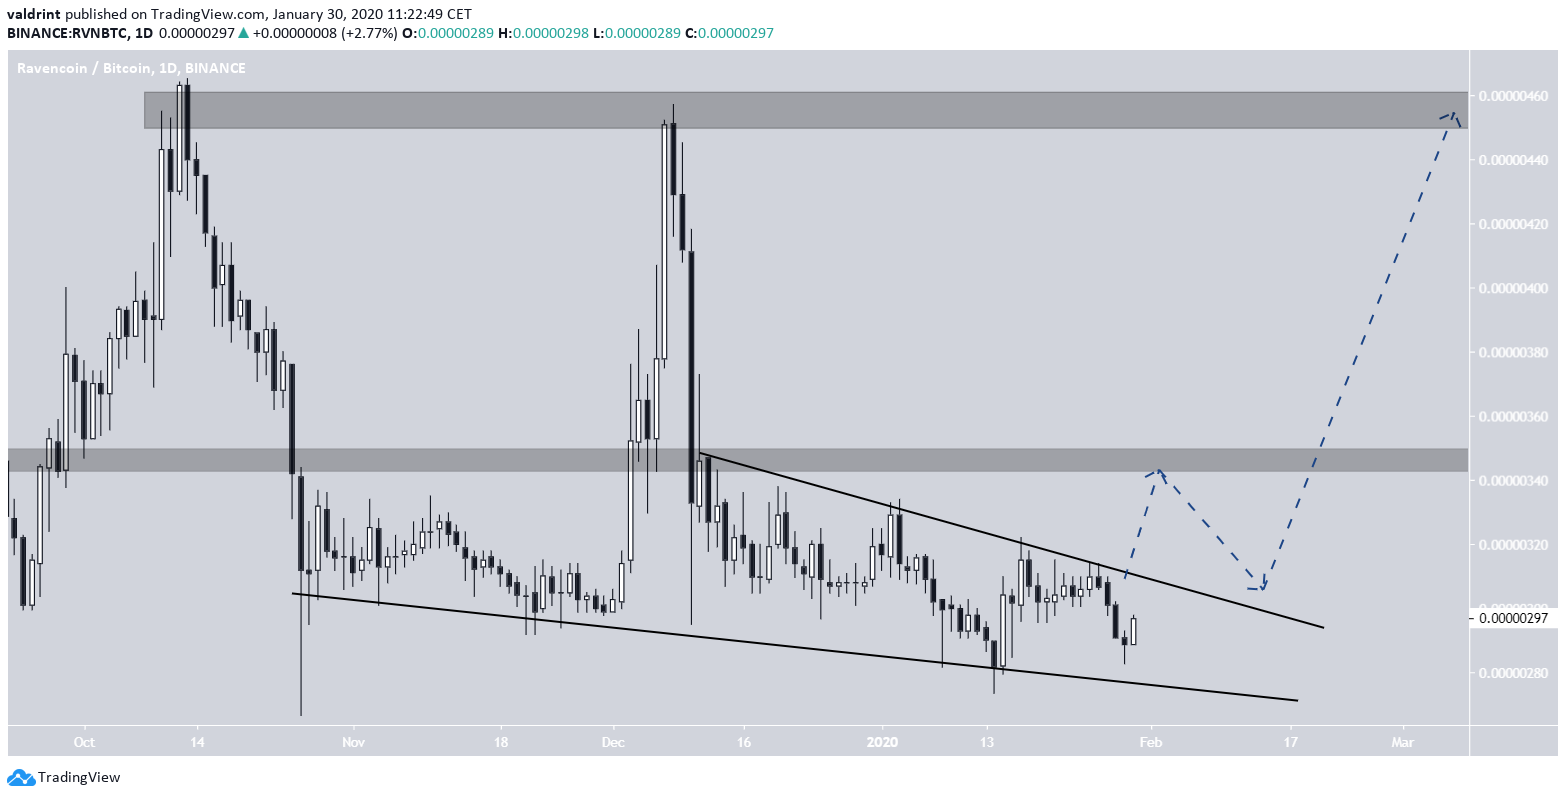
- Ravencoin is trading inside of a descending wedge.
- There is resistance at 350, 460 and 600 satoshis.
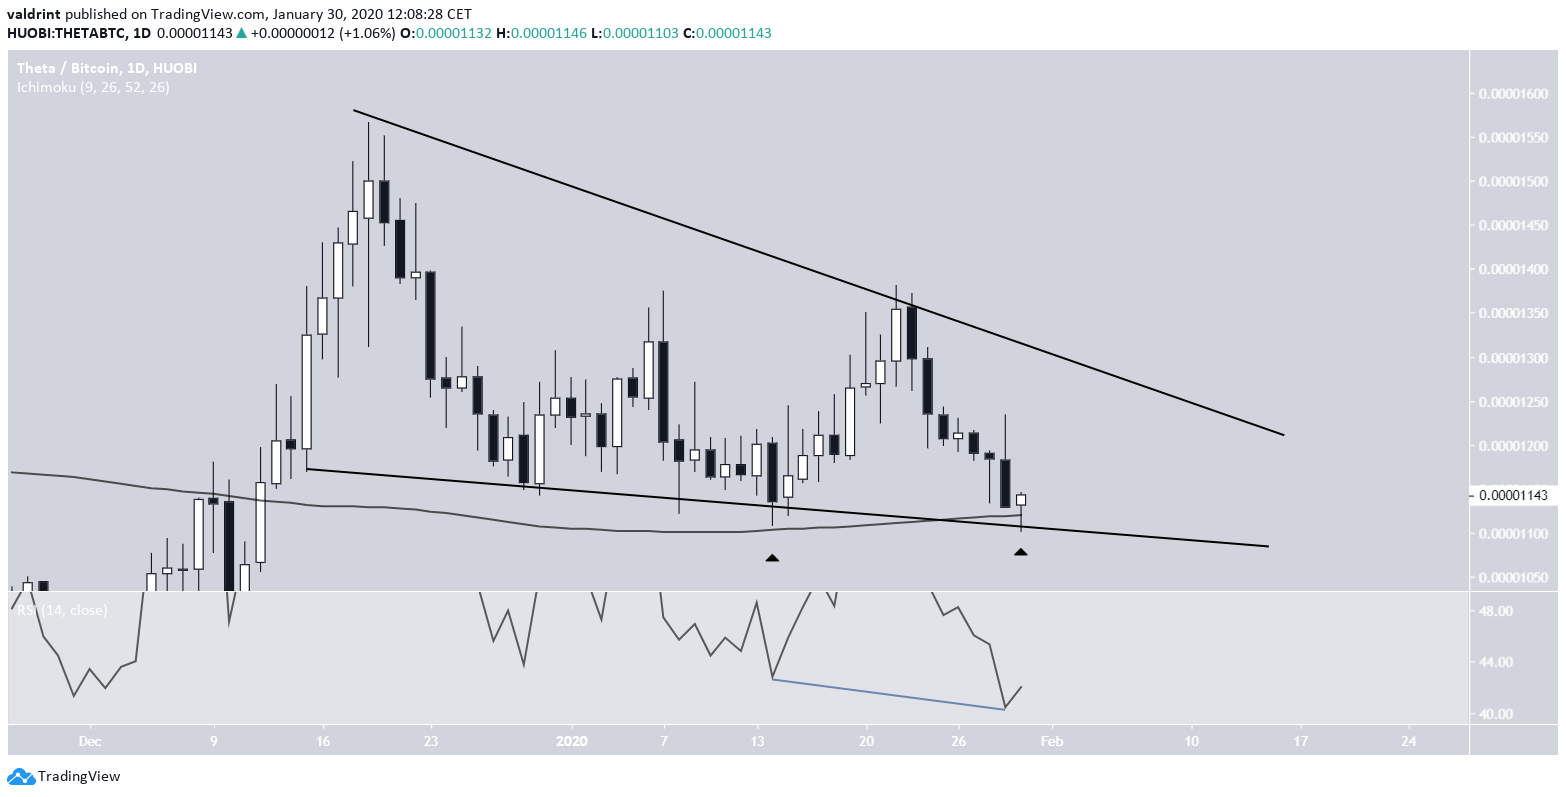
- Theta is trading inside of a descending wedge.
- There is resistance at 1800 satoshis.
- Enjin has broken out above its resistance line.
- There is resistance at 1800 satoshis.
In addition, he stated that not all altcoins are poised to break out. He outlined three of them which he believes have high potential, which are:Are you ready for #altszn ?
— Johnny Woo (@j0hnnyw00) January 29, 2020
Total/exclude btc-weekly breakout.#crypto #bitcoin $btc #btc pic.twitter.com/SRfSVkto30
- Ravencoin
- Theta
- Enjin Coin
Let’s analyze the price movement for each of them and determine their breakout potential.Remember, this #altszn won't be like 2017 run.
— Johnny Woo (@j0hnnyw00) January 29, 2020
Only true and valuable #alts will pump, not every shitcoins out there.
For example $ENJ $THETA $RVN these are the candidates.#crypto #bitcoin #btc $btc
Altcoin Market Cap
The altcoin market cap has indeed been moving inside of what resembles a symmetrical triangle since the all-time high reached in January 2018. In addition, the RSI line has moved above 50, indicating that the altcoin market cap is in a bullish trend and the cap can continue moving upward.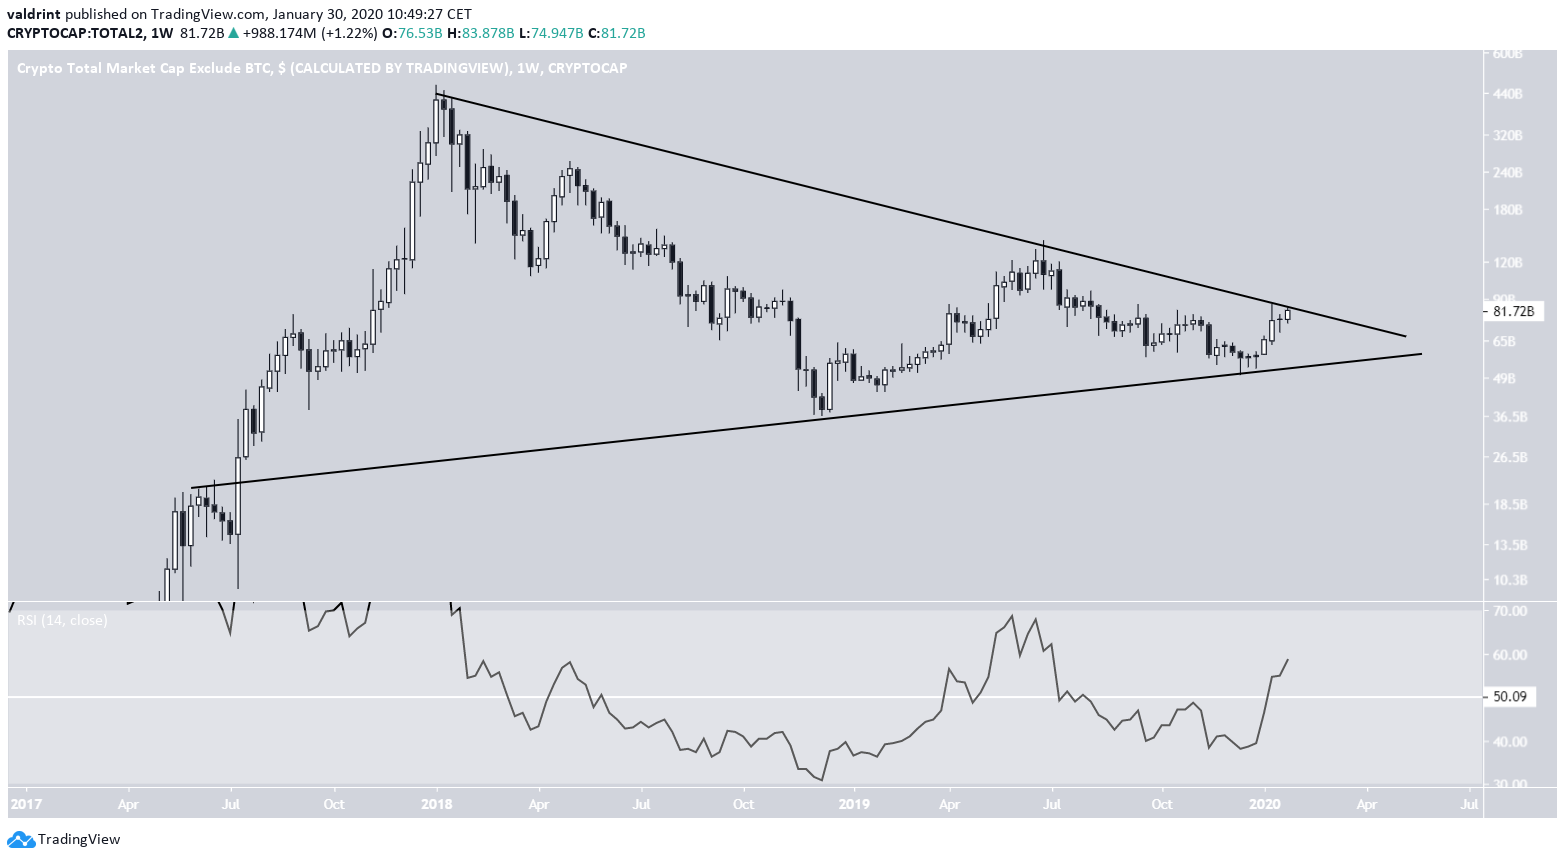 What looks more interesting is the breakout from the relatively shorter-term resistance line which had been in place since July 19, 2019. The price was successful in moving above this resistance line on its fifth try. In addition, this caused it to move above its 200-day moving average (MA), which the price seemingly used as support afterward.
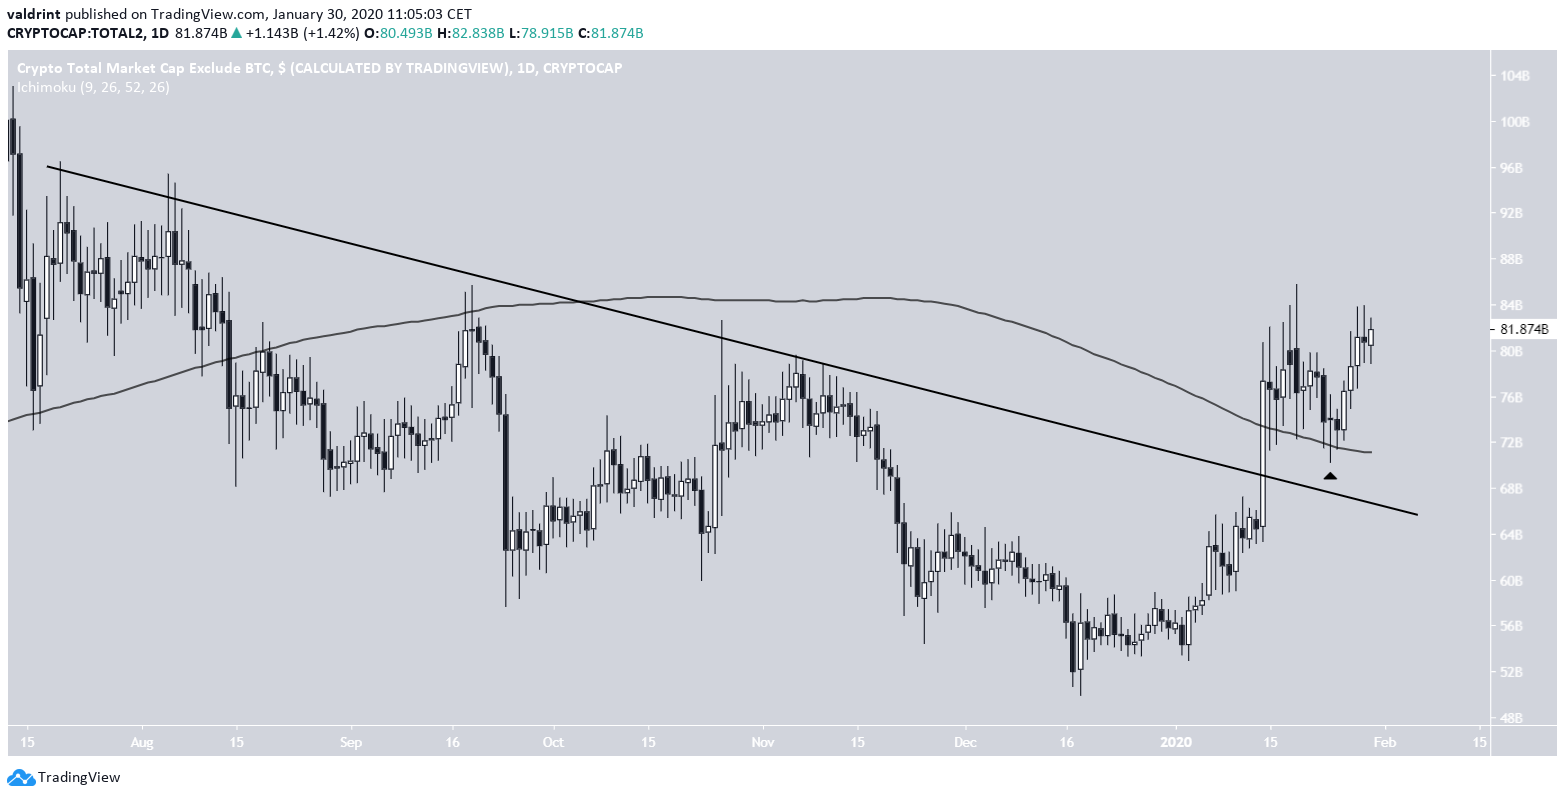 Since now we have an idea that the altcoin market cap will probably move upward, at least in the short/medium-term, let’s take a closer look at the individual altcoins and gauge their potential for future increases.
Ravencoin
The Ravencoin price has been following a descending resistance line since July 1, 2019, having made three unsuccessful breakout attempts hitherto. The main support area is found at 275 satoshis. If the price breaks out above this line, the main resistance area would be at 600 satoshis. The weekly RSI has been generating a continuous bullish divergence almost for the entirety of the duration of the descending resistance line. This is a strong reversal sign that suggests that the price could move higher.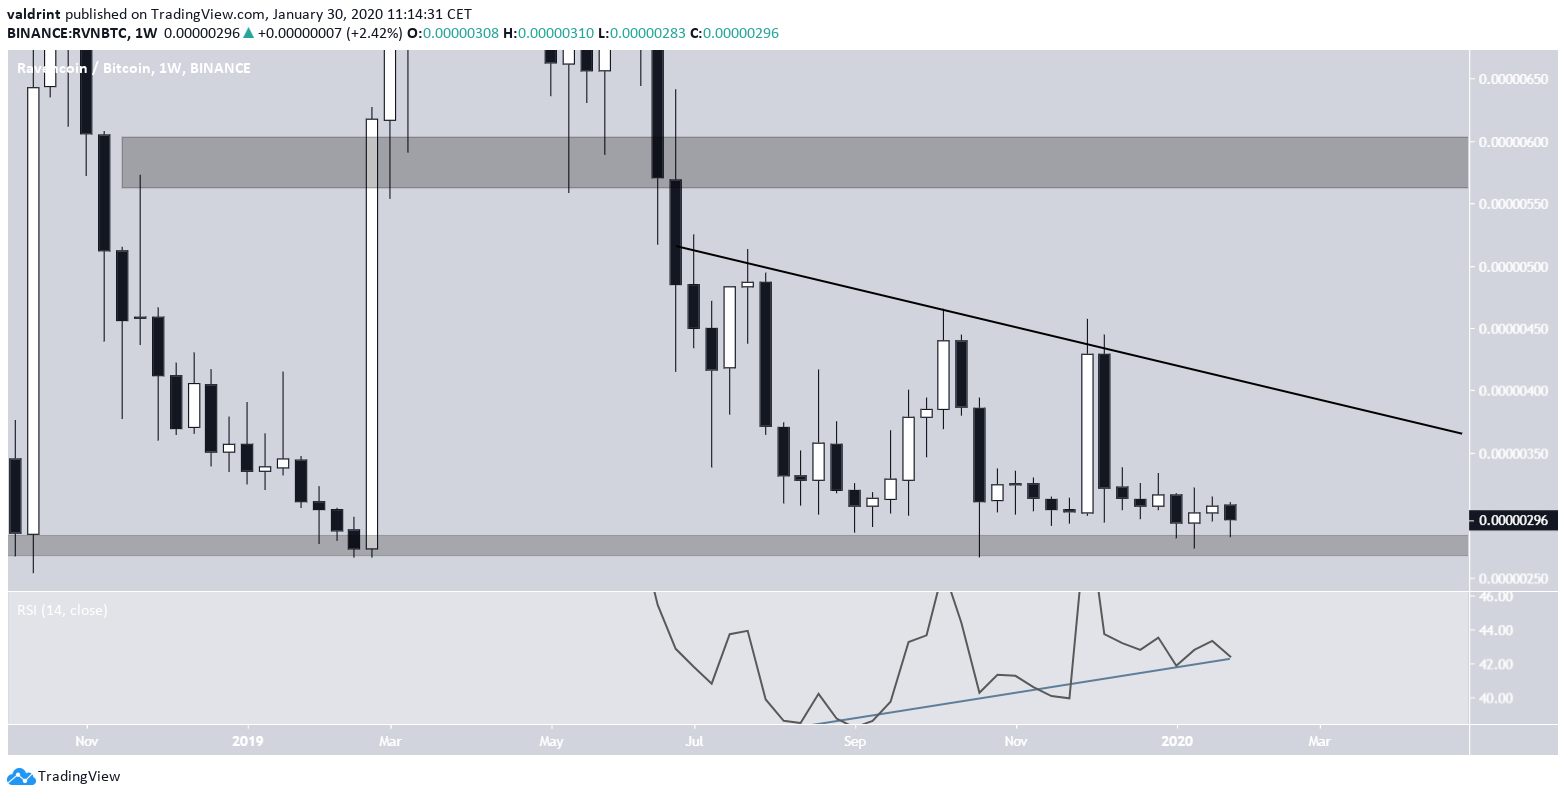 The daily time-frame reveals that the price is trading inside a descending wedge — which is considered a bullish reversal pattern.
However, the price is trading below its 50- and 200-day moving averages (MAs) while facing very close resistance from the former. The latter increases the significance of the minor resistance area at 350 satoshis.
While this does not make a breakout impossible, it indicates that the price is likely to face resistance if it makes a breakout attempt and reduces the possibility of very rapid upward price increases without any retracement.
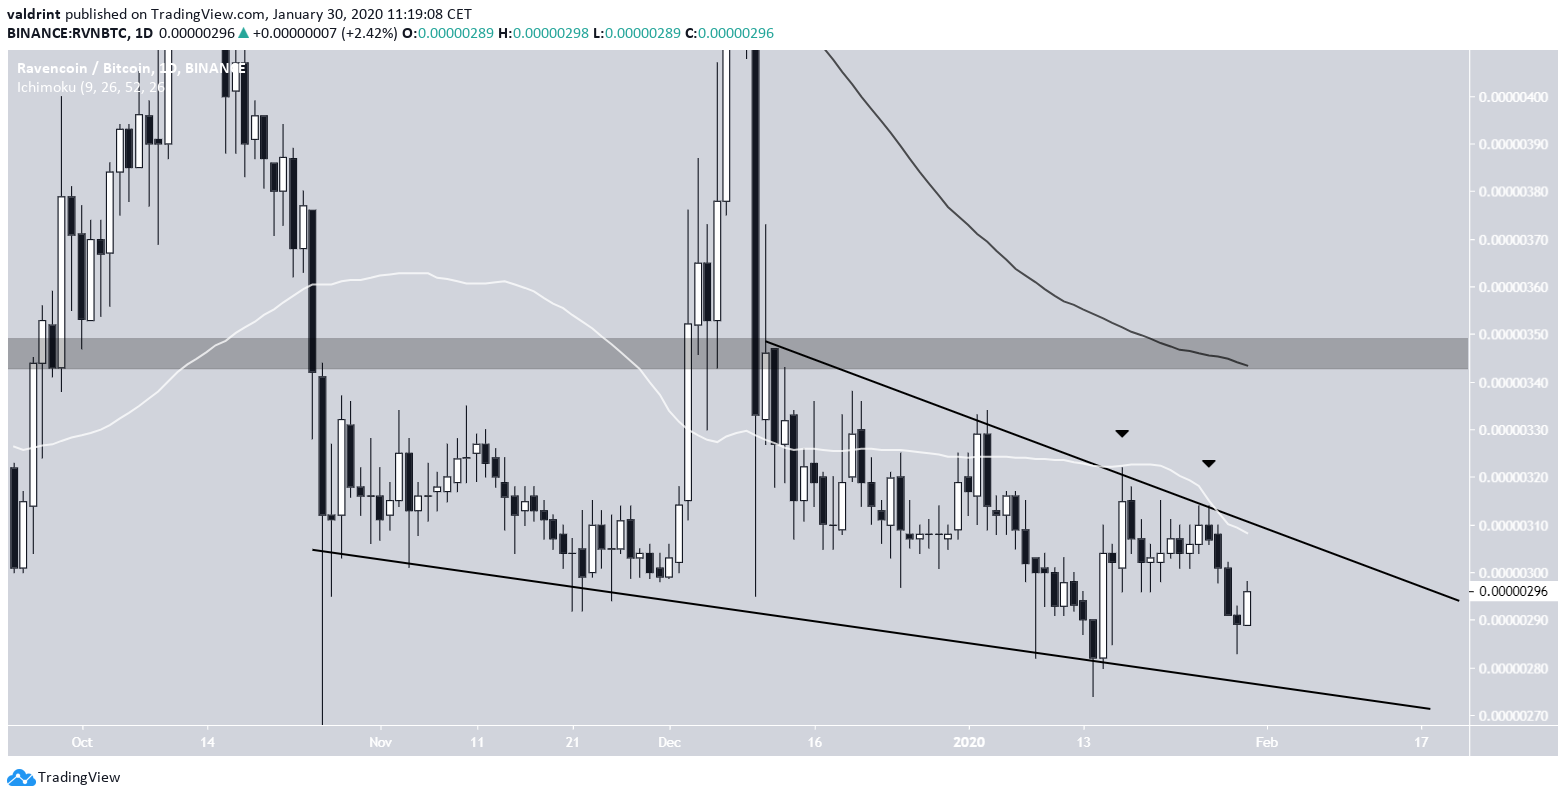 Therefore, if the price were to break out, we would expect it to reach the 350 satoshi area, retrace, then move towards the 460 satoshi resistance. We do not think a rapid price increase towards the 600 satoshi breakdown level is likely.
Theta
The Theta price has been trading between 1000 and 1800 satoshis during the times it has been in its consolidation phase. While the price has never broken down below the 1000 satoshi support area, breakouts have taken it significantly above the resistance area. Beginning in July 2019, the weekly RSI for Theta began to generate bullish divergence and afterward completed a failure swing bottom. This caused the price to initiate an upward move, which lasted until December 19. The price has been decreasing since.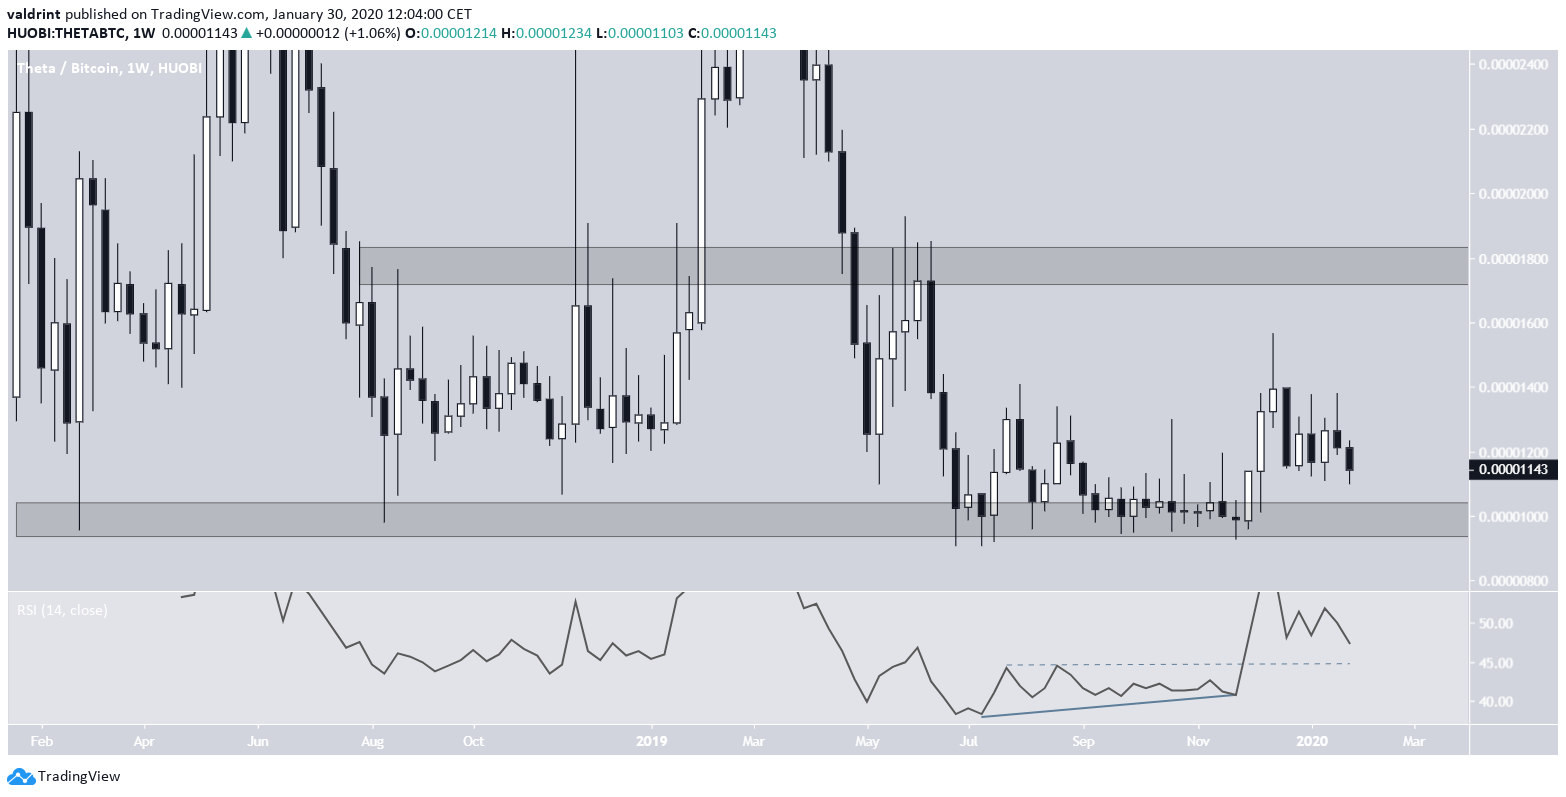 Similarly to RVN, the Theta price is also trading inside a descending wedge. However, this structure is considerably more bullish in the latter than the former.
There are two mains reasons for this:
- First, the price is trading above the 200-day MA and is seemingly using it as support.
- In addition, the daily RSI has generated hidden bullish divergence.
Enjin Coin
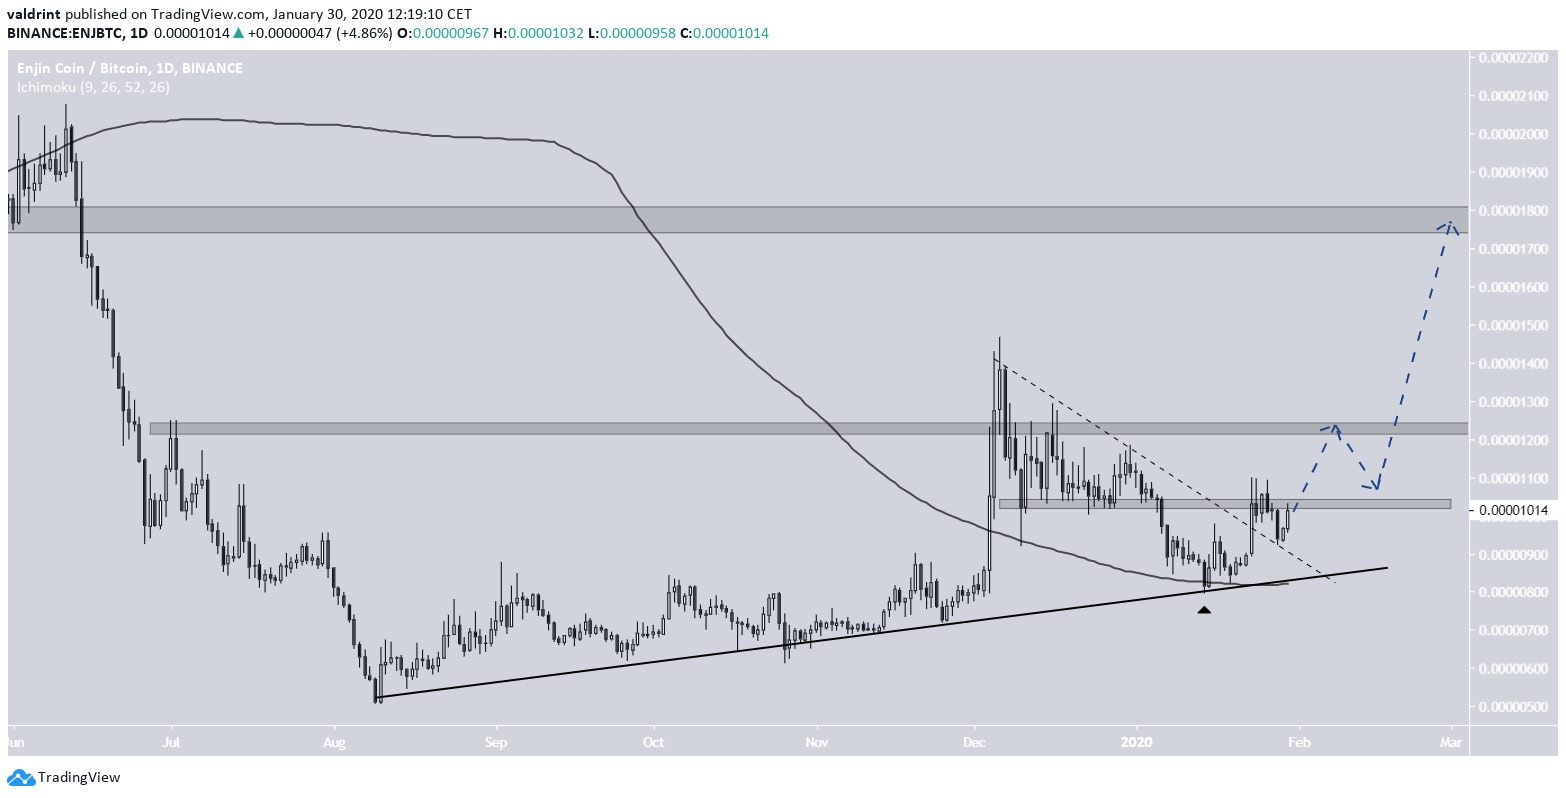
In August 2019, the ENJ price reached the 800 satoshi support area — above which it has been trading for two years and began to increase. Unlike the other two coins, the increase was not preceded by bullish divergence in the RSI. However, the latter has moved above the 50-line, indicating that the price could be in an upward trend. Finally, ENJ is clearly following an ascending support line that has been validated numerous times.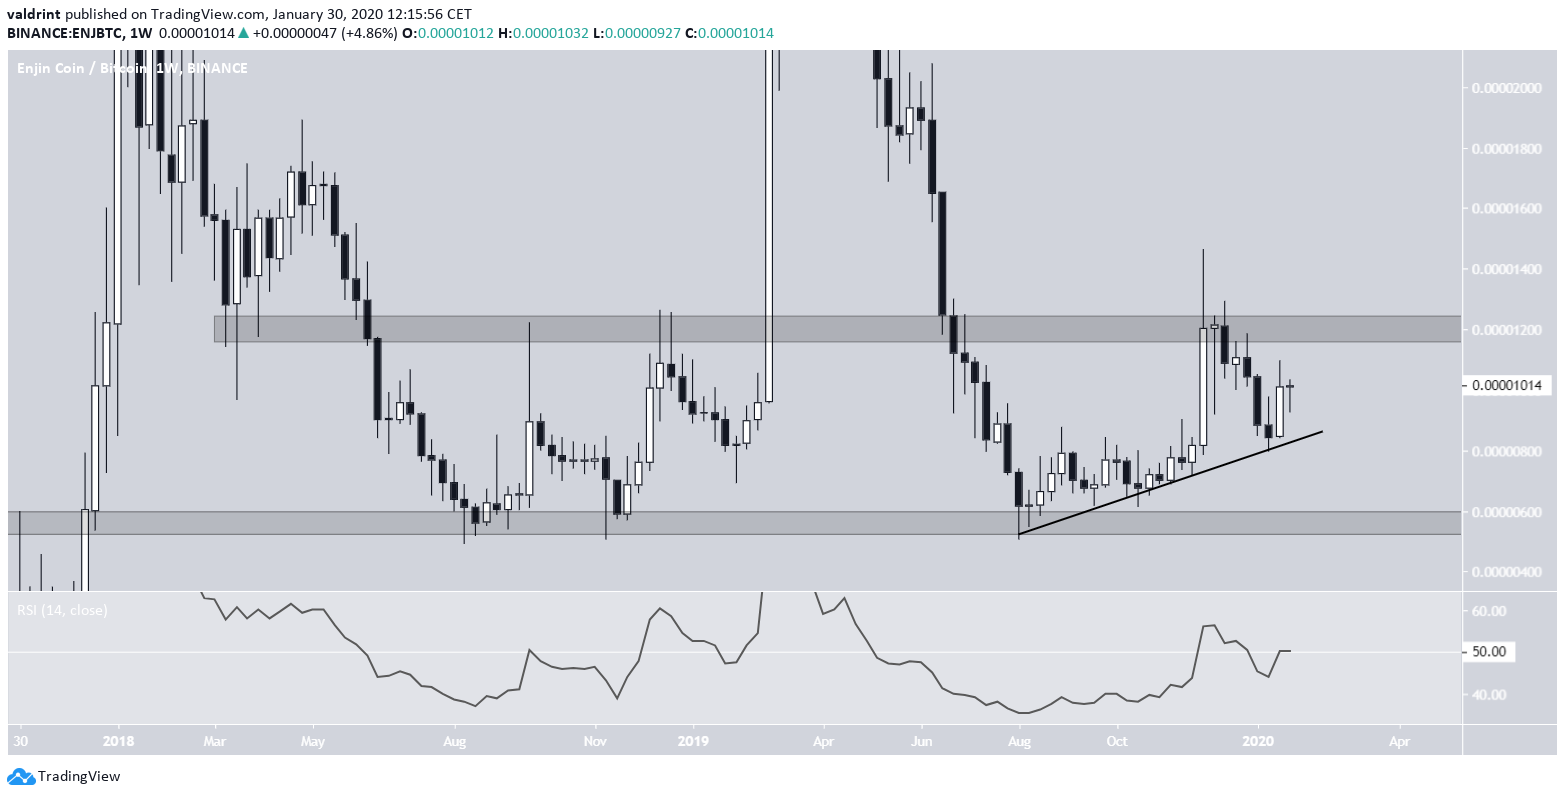 The coin has moved above its 200-day MA and has broken out above a descending resistance line.
Therefore, it is likely to continue moving upward. An outline of possible future movement is given below, in which ENJ increases to the 1250 satoshi resistance area, retraces, and makes an attempt towards 1800 satoshis.
Conclusion
To conclude, both Theta and RVN are trading inside a descending wedge. The price position relative to its moving averages and readings from technical indicators provides a more bullish outlook for Theta than for RVN. On the other hand, ENJ has already broken out above its descending resistance line and is in the process of moving upwards. For their potential for increases, taking into account the possible magnitude of the increase and the time it would take for the coin to reach its target, we are ranking these three coins in the following order:- ENJ
- Theta
- RVN
Disclaimer
In line with the Trust Project guidelines, this price analysis article is for informational purposes only and should not be considered financial or investment advice. BeInCrypto is committed to accurate, unbiased reporting, but market conditions are subject to change without notice. Always conduct your own research and consult with a professional before making any financial decisions. Please note that our Terms and Conditions, Privacy Policy, and Disclaimers have been updated.

