The 0x (ZRX) price has broken out from a long-term resistance area and validated it as support.
As long as it can manage to maintain prices above this level, the trend is considered bullish.
ZRX Long-Term Breakout
The ZRX price had been gradually increasing since matching its all-time low near 1,450 satoshis. However, the upward movement that followed was thwarted multiple times near the 4,500 satoshi area.
On Aug 20, ZRX was finally successful in breaking out, reaching a high of 8,098 satoshis the next day. This validated the 8,000 level as resistance.
Long-term technical indicators are bullish. The aforementioned breakout transpired with very high volume and both the RSI and MACD are increasing without generating any trace of bearish divergence.
If the price retraces, the 4,500 satoshi area is expected to act as support. As long as it’s trading above this level, the trend is considered bullish. If ZRX manages to break out above the first resistance of 8,000 satoshis, the next one above would likely be found at 10,500 satoshis.
Short-Term Rejection
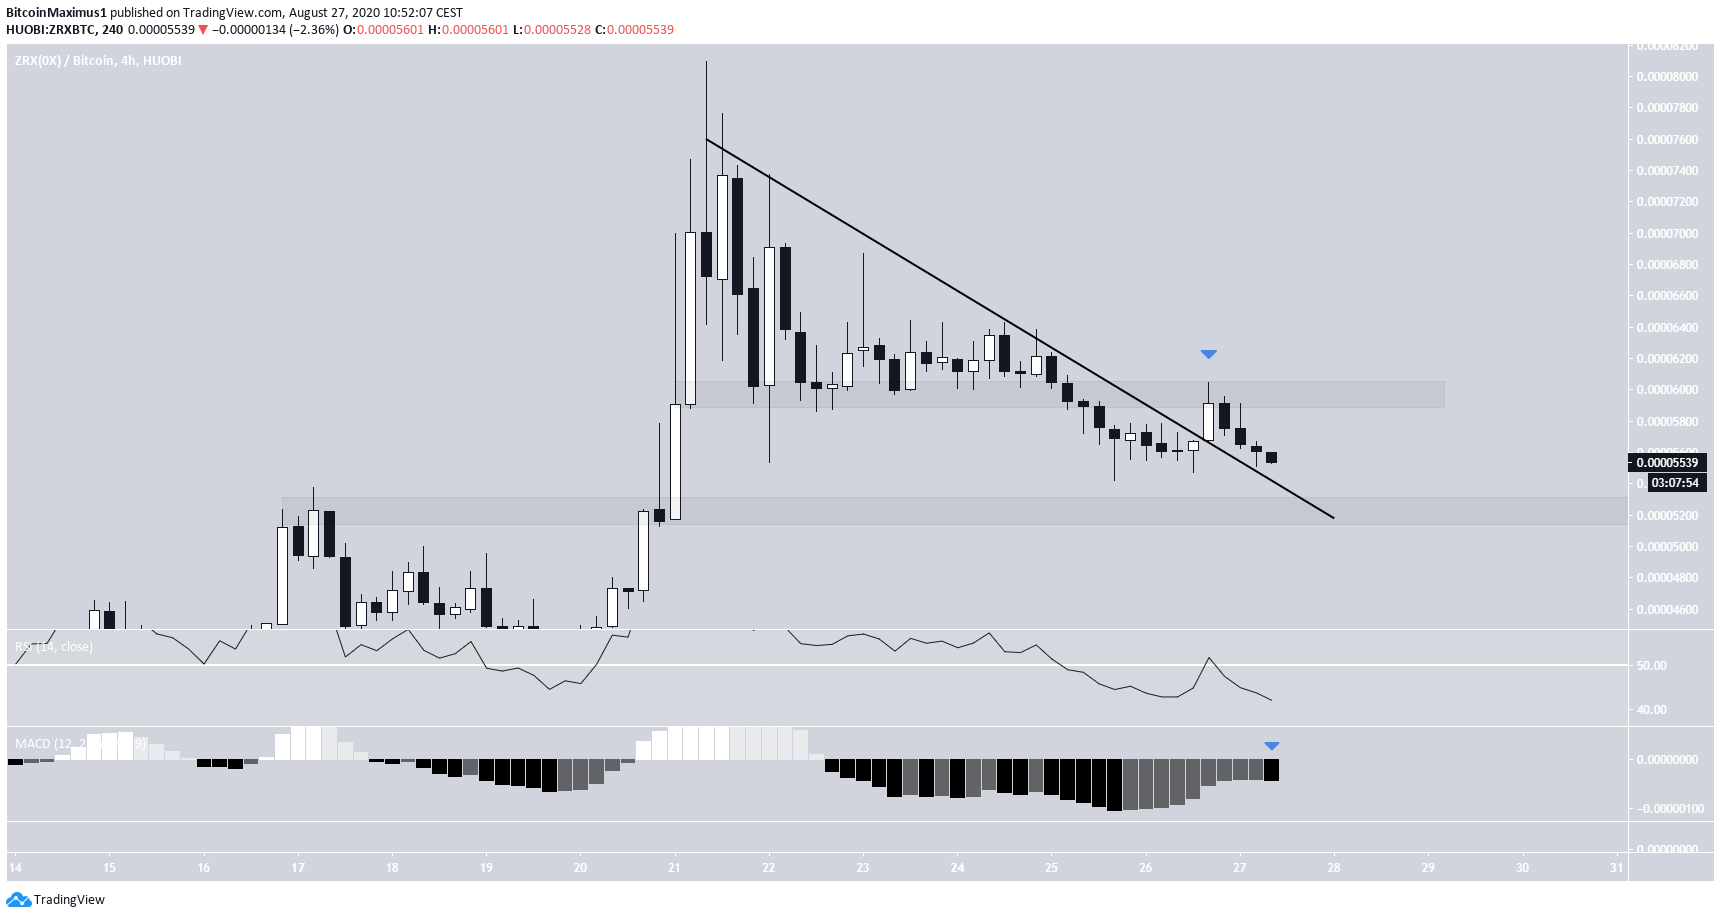
The short-term chart gives a conflicting outlook. The price has broken out from a descending resistance line and validated it as support. However, it is struggling to break out above the 6,000 satoshi resistance area.
It would make sense for the price to first drop and validate the support at 5,200 satoshis before making another attempt at breaking out above 6,000.
Wave Count
Cryptocurrency trader @Coldbloodshill outlined a symmetrical triangle for ZRX/USD. However, he did not provide any thoughts or forecasts on if ZRX would more likely break out or down from the pattern.
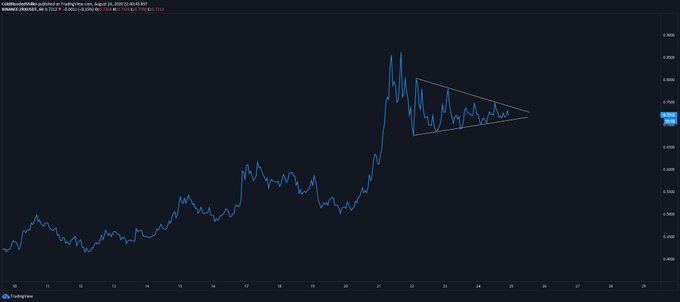
Since the tweet, the price has already broken down from the short-term symmetrical triangle.
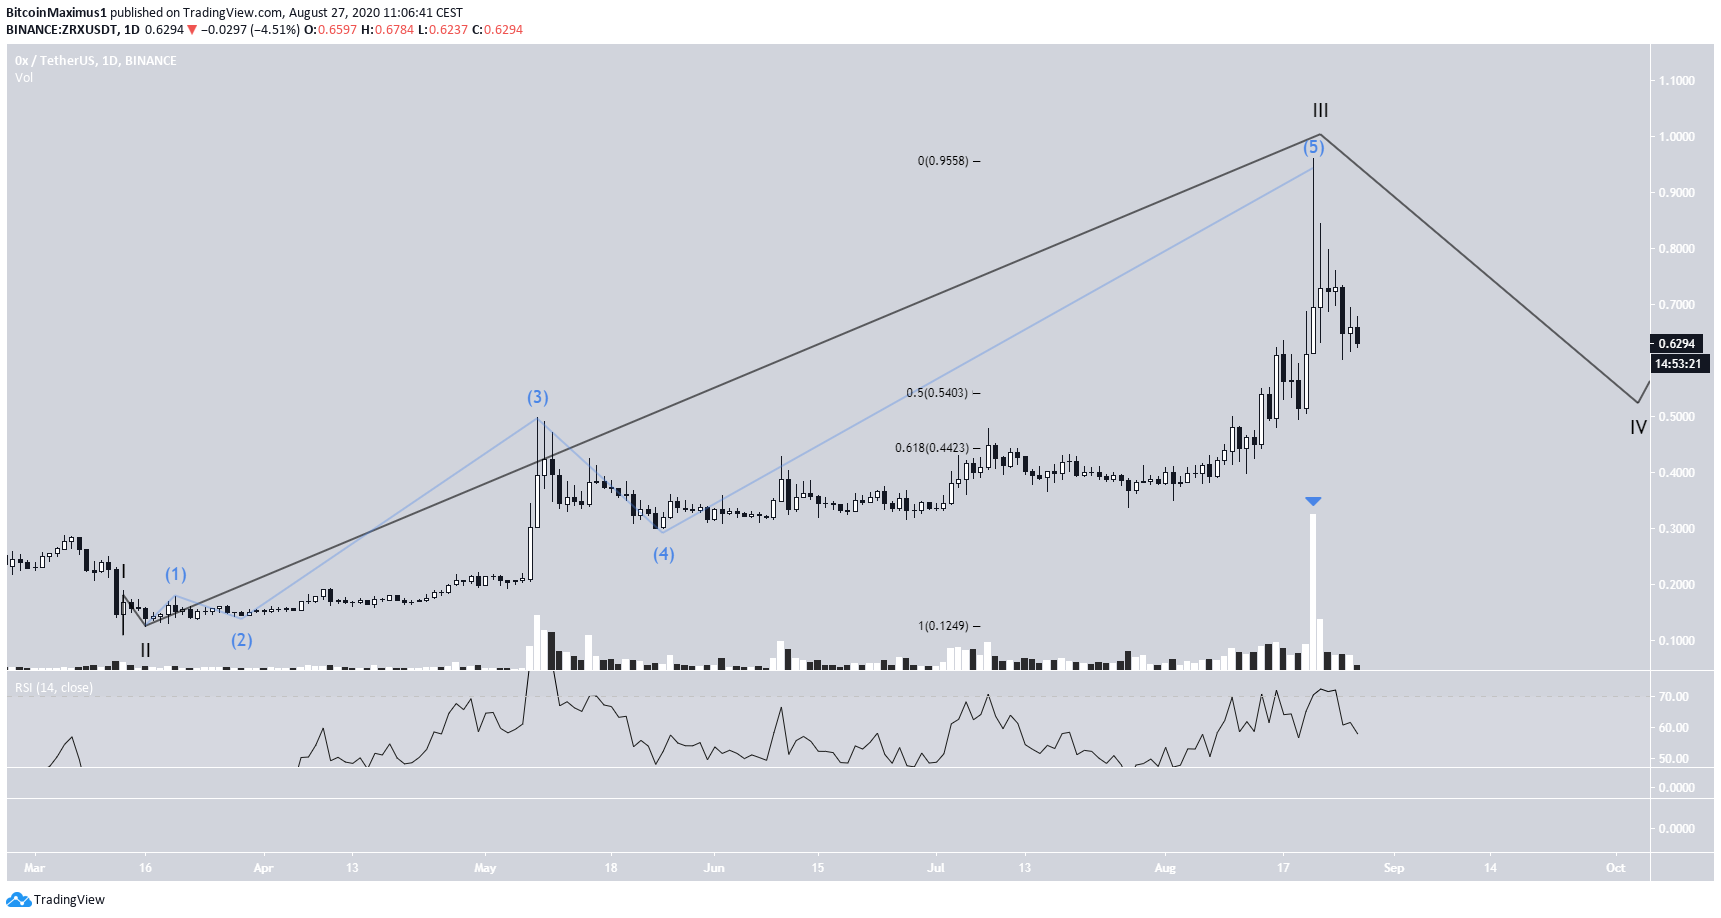
Measuring the movement since March 13, it seems that ZRX has completed wave 3 (in black below) and is currently correcting inside wave 5.
The massive volume near the top of the move and lack of bearish divergence makes it more likely that this is a wave 3 rather than 5.
The correction is expected to end somewhere between $0.44-$0.54, which is the 0.5-0.618 Fib levels of the entire upward move.