


XRP price hovers near $1.40 in late April 2026 as traders weigh a daily cup-and-handle pattern targeting $1.70, while a sharp on-chain warning could derail the breakout. What is the latest XRP price prediction from May 2026?
The token has moved sideways since February 2026, but compressing volume and a slowly turning weekly MACD suggest a bigger move is brewing as May begins.
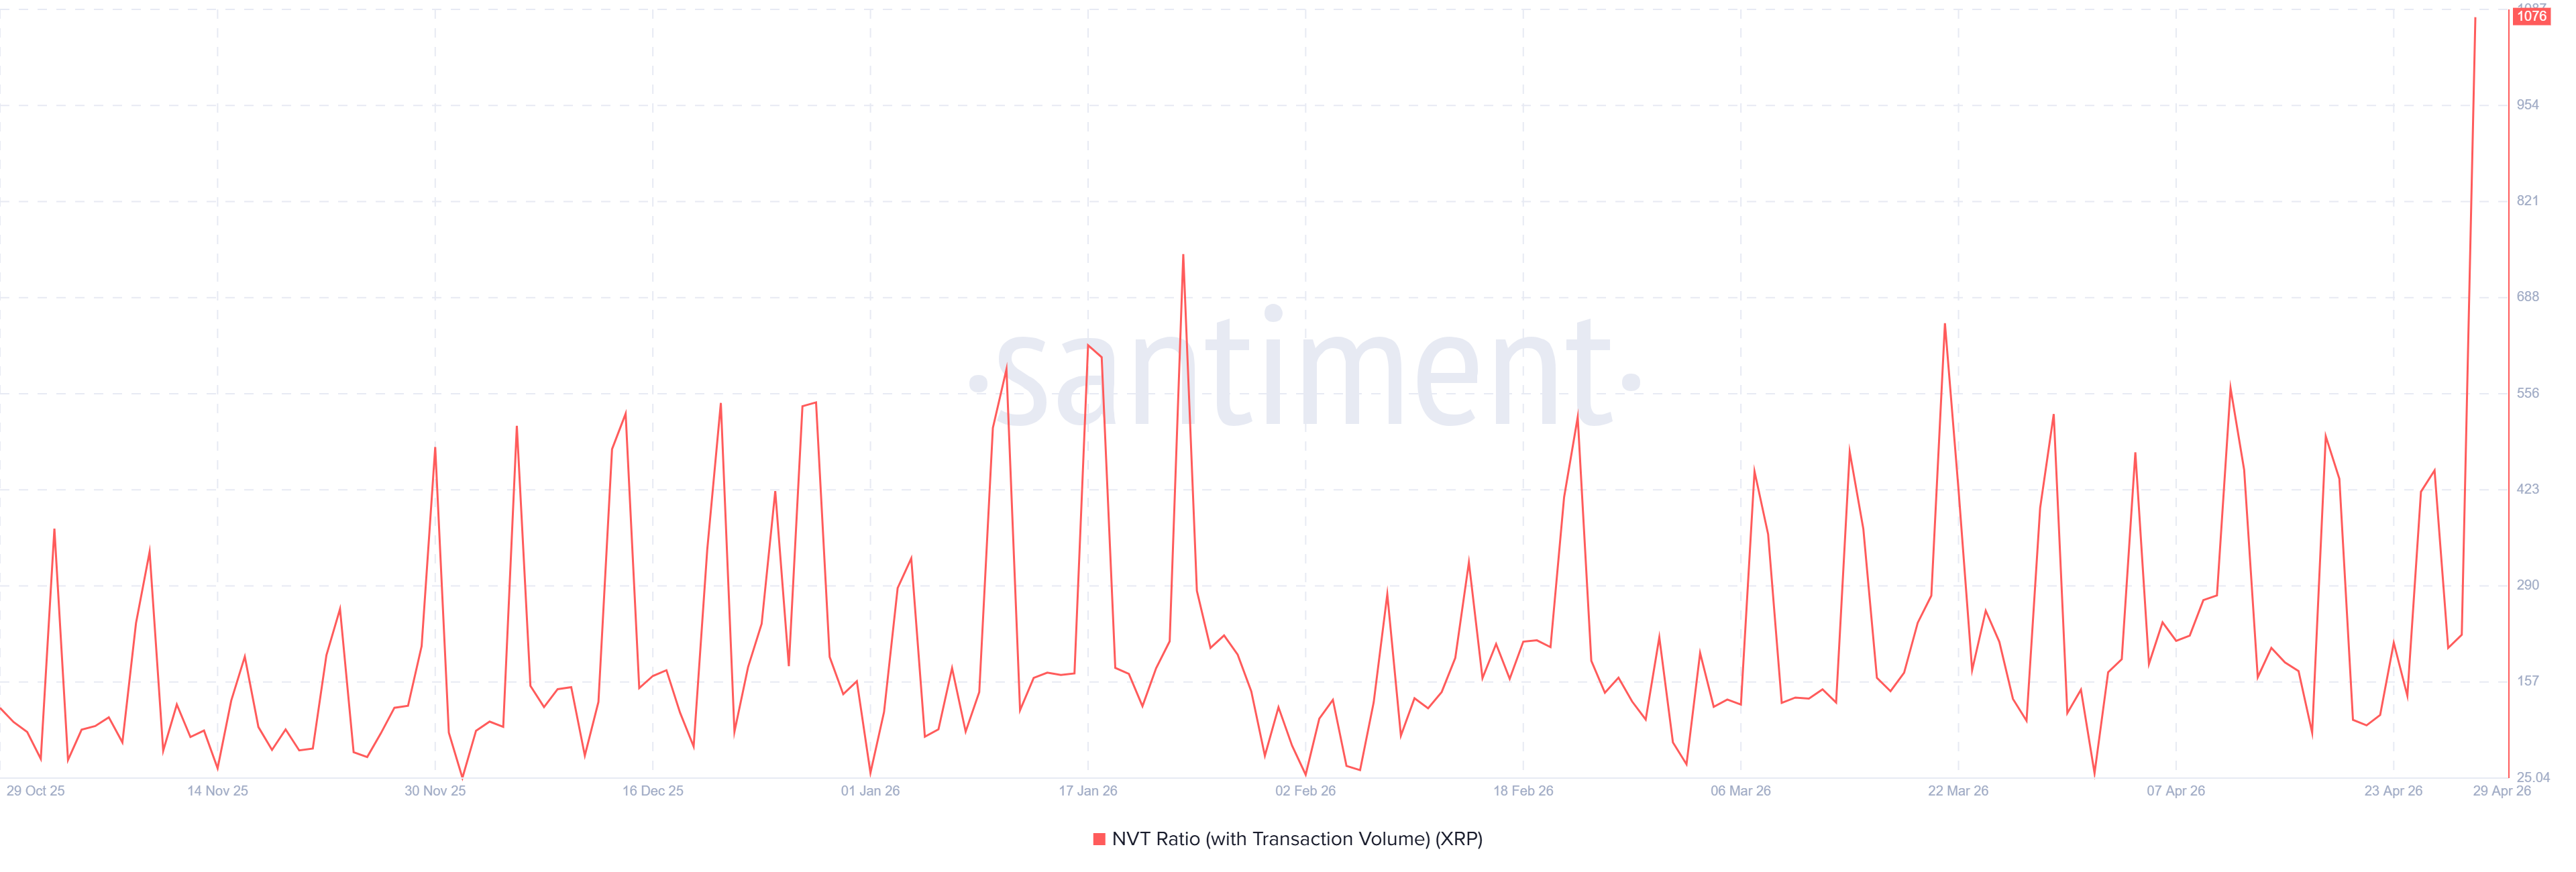
NVT Ratio Spike Flags Overheated XRP Network
The Network Value to Transactions (NVT) ratio for XRP surged to 1,076 on April 29. That marks the highest reading on the chart since October 2025. Earlier spikes during the same window stayed mostly below the 700 mark.
However, a high NVT reading indicates that the price has risen faster than actual on-chain activity. Historically, similar extremes have preceded short-term price corrections, since the rally was not supported by transactional volume.
Meanwhile, exchange inflows and whale transaction counts above $100,000 have remained stable since February 2026. No fresh spikes are visible in the Santiment data, mirroring the structural concerns flagged in previous BeInCrypto coverage.
For the bearish signal to fade, the NVT ratio must drop below 300 while daily transaction volume picks up.
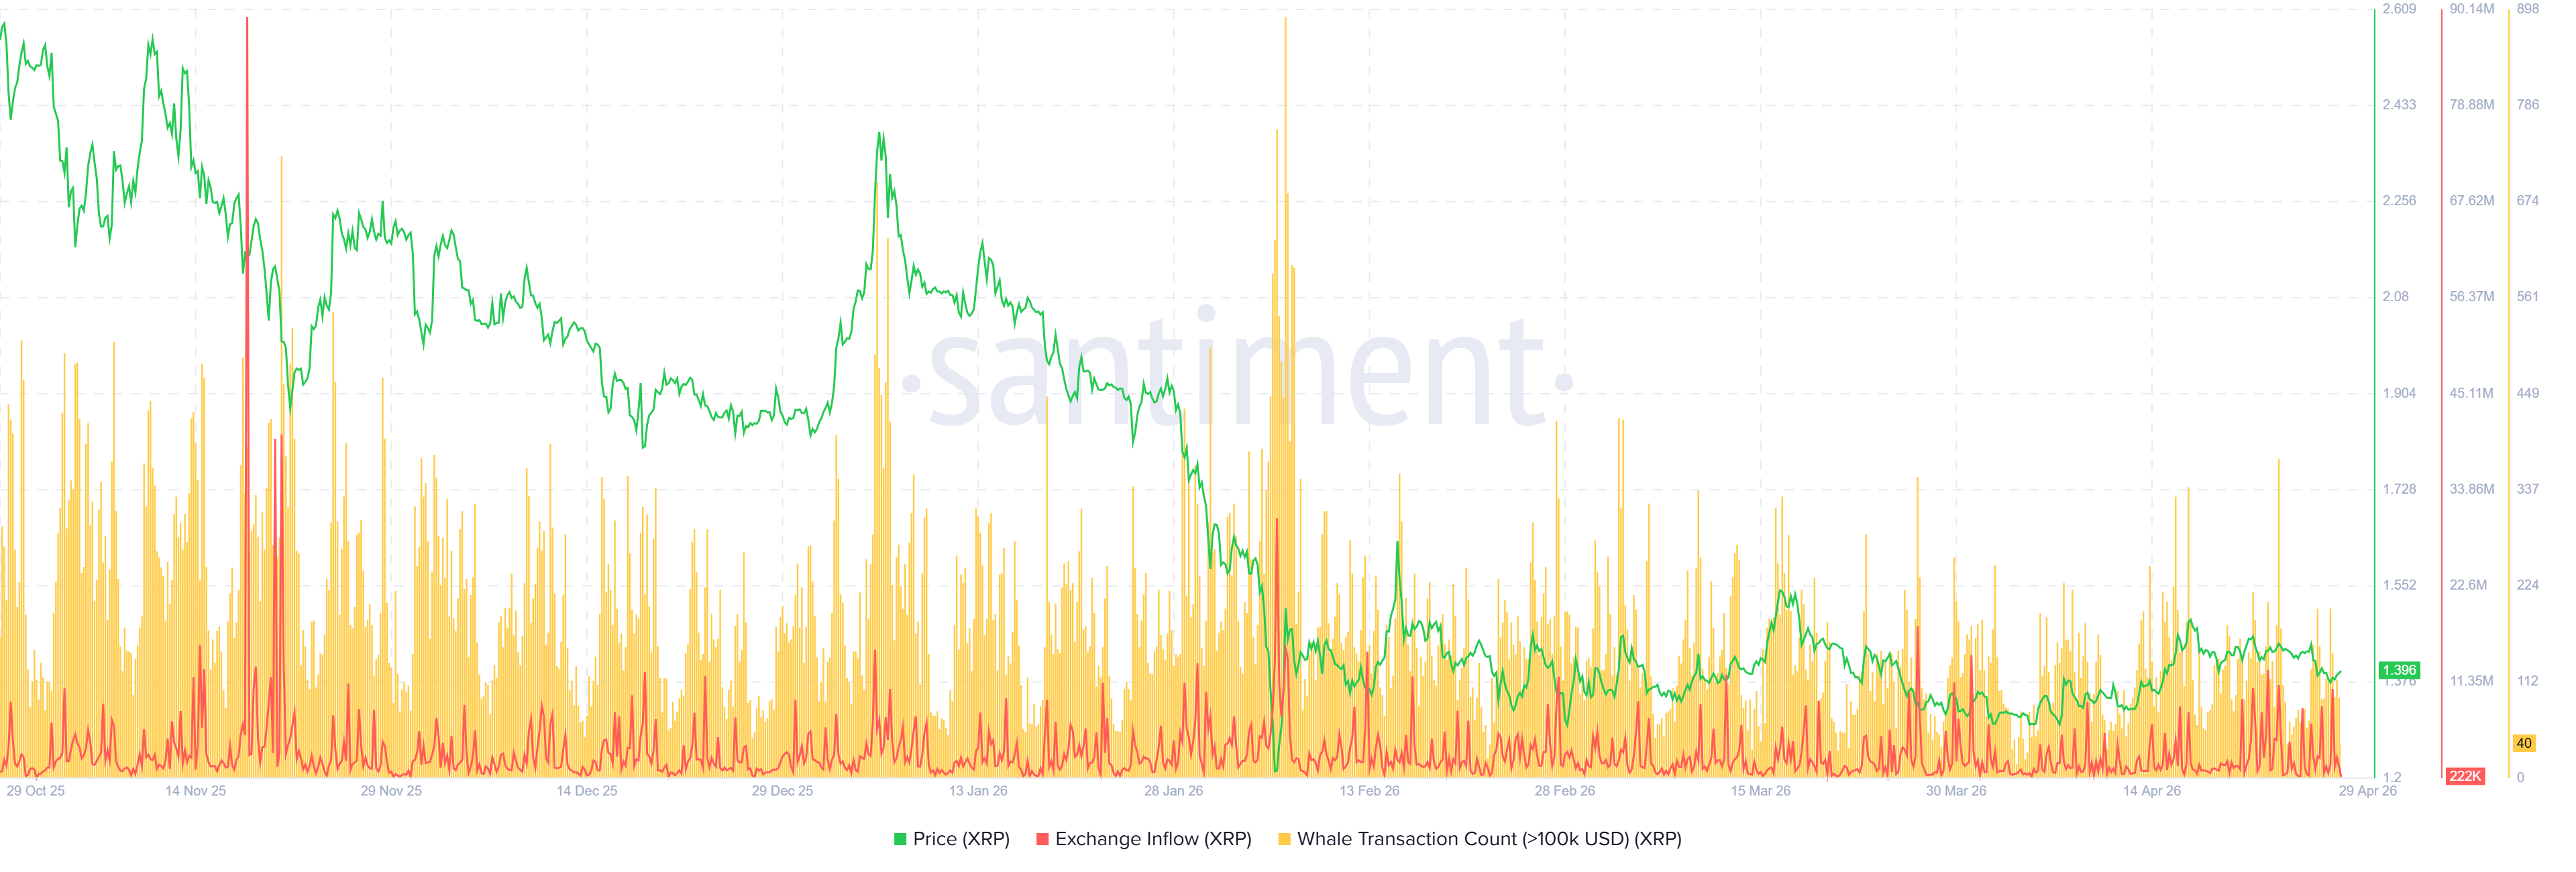
Exchange Inflow and Whale Transaction Count for XRP / Source: Santiment
Weekly Chart Tests 0.786 Fibonacci After Long Decline
Despite the on-chain warning, the weekly XRP/USDT chart shows the token defending the 0.786 Fibonacci retracement at $1.17. Price has stabilized in the $1.30 to $1.45 range since February, forming a tight accumulation zone.
Volume on the weekly chart keeps contracting, a classic sign of compression before an expansion move. However, the Relative Strength Index (RSI) is climbing slowly while staying below a descending trendline drawn from December 2025 highs.
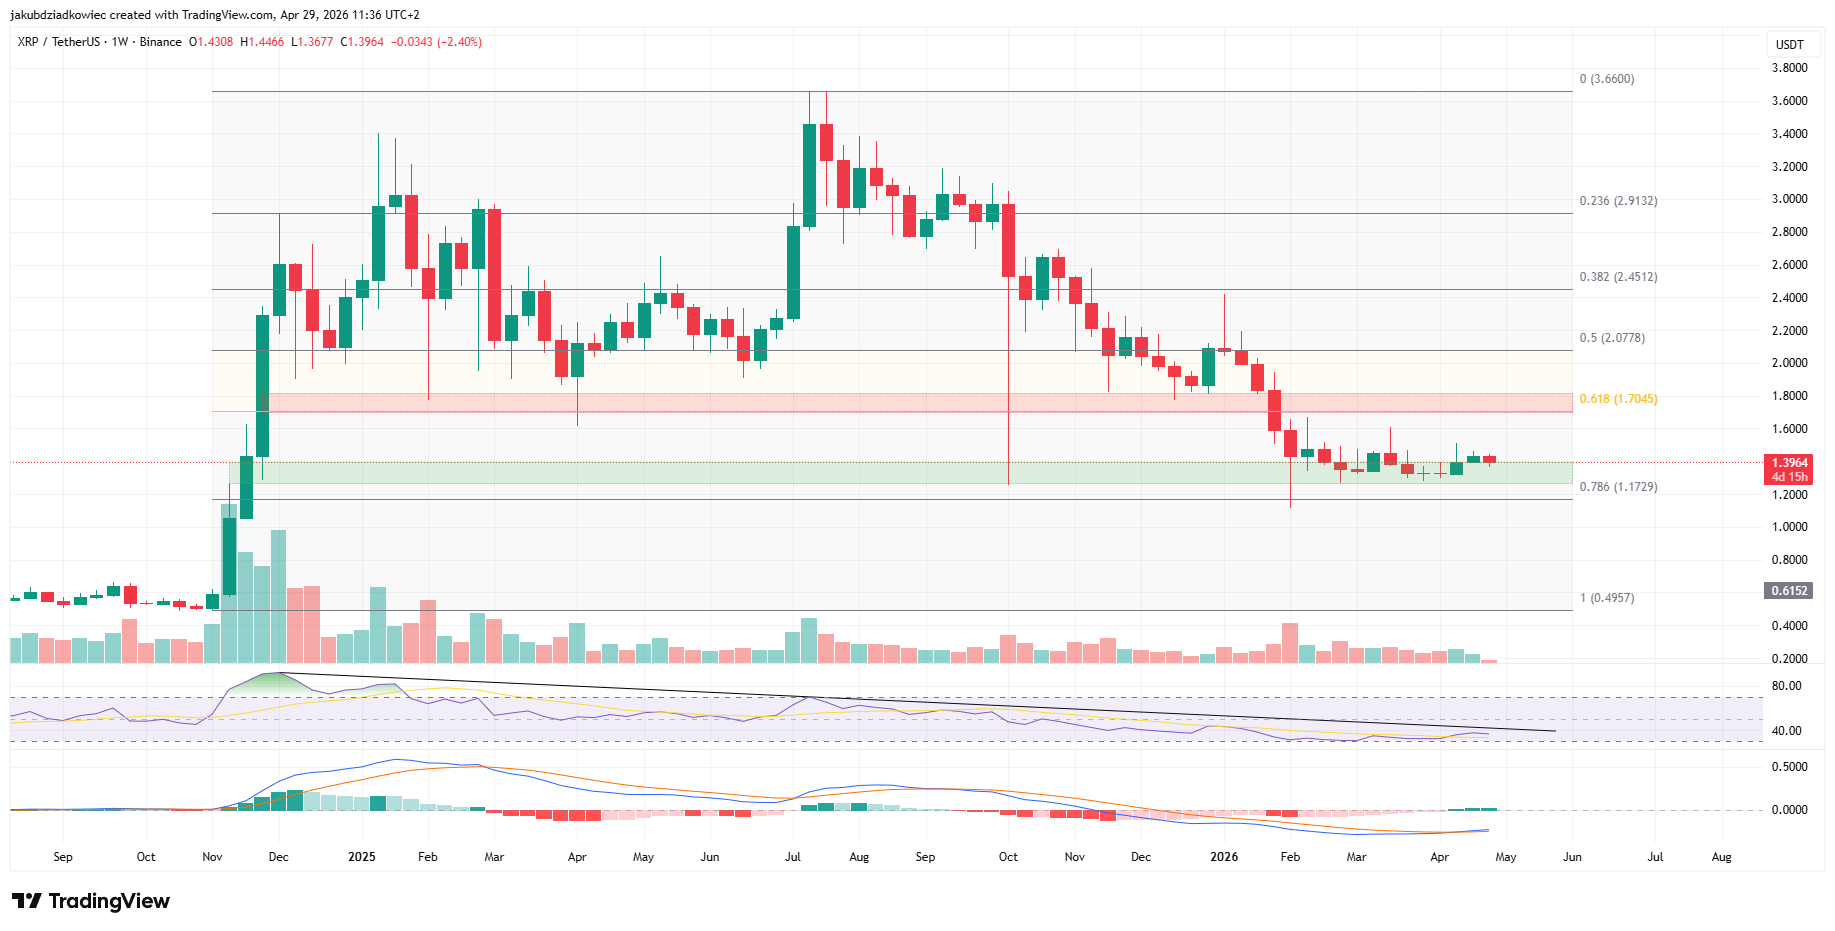
Meanwhile, the Moving Average Convergence Divergence (MACD) has printed three green weekly bars and is curling toward a bullish cross. A weekly close above $1.50 would clear the next major hurdle. Therefore, that move would put the 0.618 Fibonacci level at $1.70 directly in play.
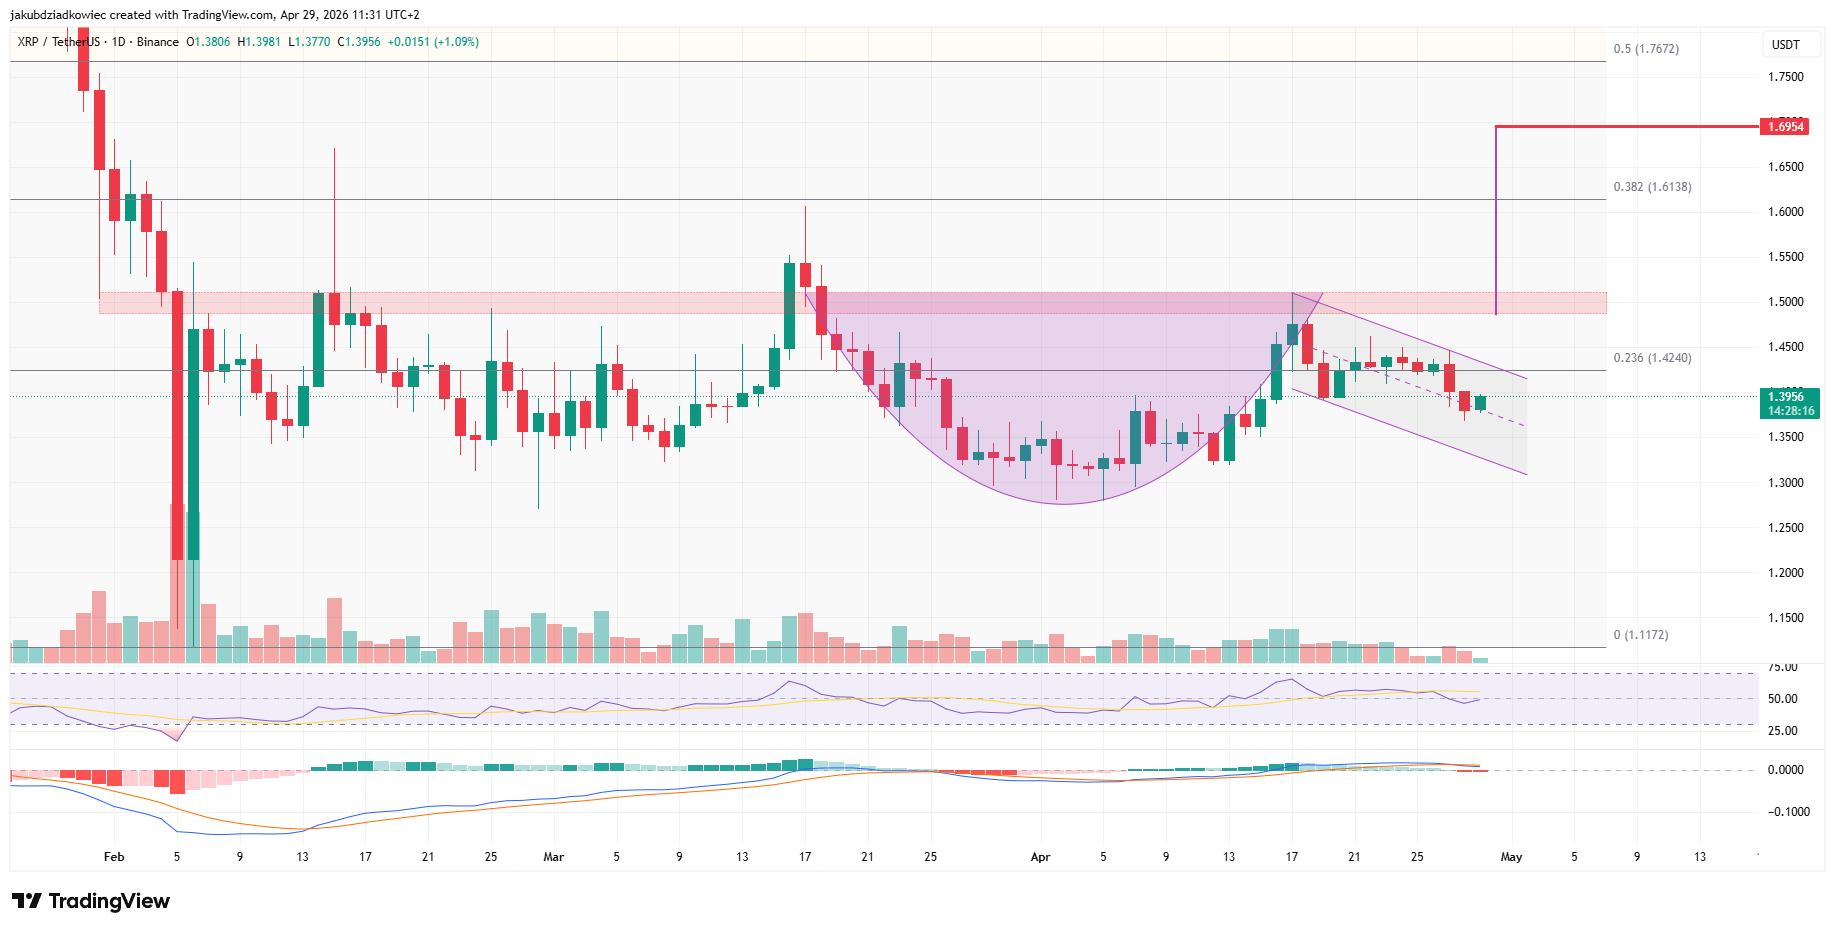
XRP Price Prediction May 2026, $1.70 in Sight
The daily XRP chart shows a textbook cup-and-handle pattern. The measured target sits near $1.70, above the 0.382 Fibonacci retracement at $1.61. Price trades at $1.40 inside the handle, with support at $1.30 and resistance at $1.50, dating back to February.
Meanwhile, the daily MACD and RSI are near neutral, while volume continues to fade. Historically, that setup precedes a directional break rather than continued chop, mirroring the compression pattern flagged in the April outlook.
A clean daily close above $1.50 would unlock roughly 16% of upside toward $1.70. However, a breakdown below $1.30 would invalidate the pattern and reopen $1.17 as the next support.
The U.S. Securities and Exchange Commission (SEC) is hosting a CLARITY Act roundtable on May 3, a potential macro catalyst that could resolve the standoff. Continued XRP exchange-traded fund (ETF) inflows reached $75 million in April.
May 2026 may determine whether XRP starts a new leg higher or retests the 0.786 Fibonacci floor.


