


Solana remains under sustained pressure as broader market conditions deteriorate. SOL has extended its downtrend for several weeks, reflecting reduced investor confidence.
Recent on-chain data reveals a surge in exchange-directed supply. Roughly $202 million worth of SOL has moved to trading platforms since the beginning of the month. This wave of selling has intensified bearish momentum and revived capitulation signals not observed since 2022.
Solana Holders Are Selling
Active deposits on the Solana network have started declining after a sharp rise earlier this month. This metric tracks tokens transferred to exchanges, often signaling intent to sell.
Despite moderating deposit flows, exchange balances continue to reflect elevated supply. Over the past 17 days, exchange wallets have added 2.35 million SOL. At current prices, this increase equates to approximately $202 million in additional sell-side liquidity.
Want more token insights like this? Sign up for Editor Harsh Notariya’s Daily Crypto Newsletter here.
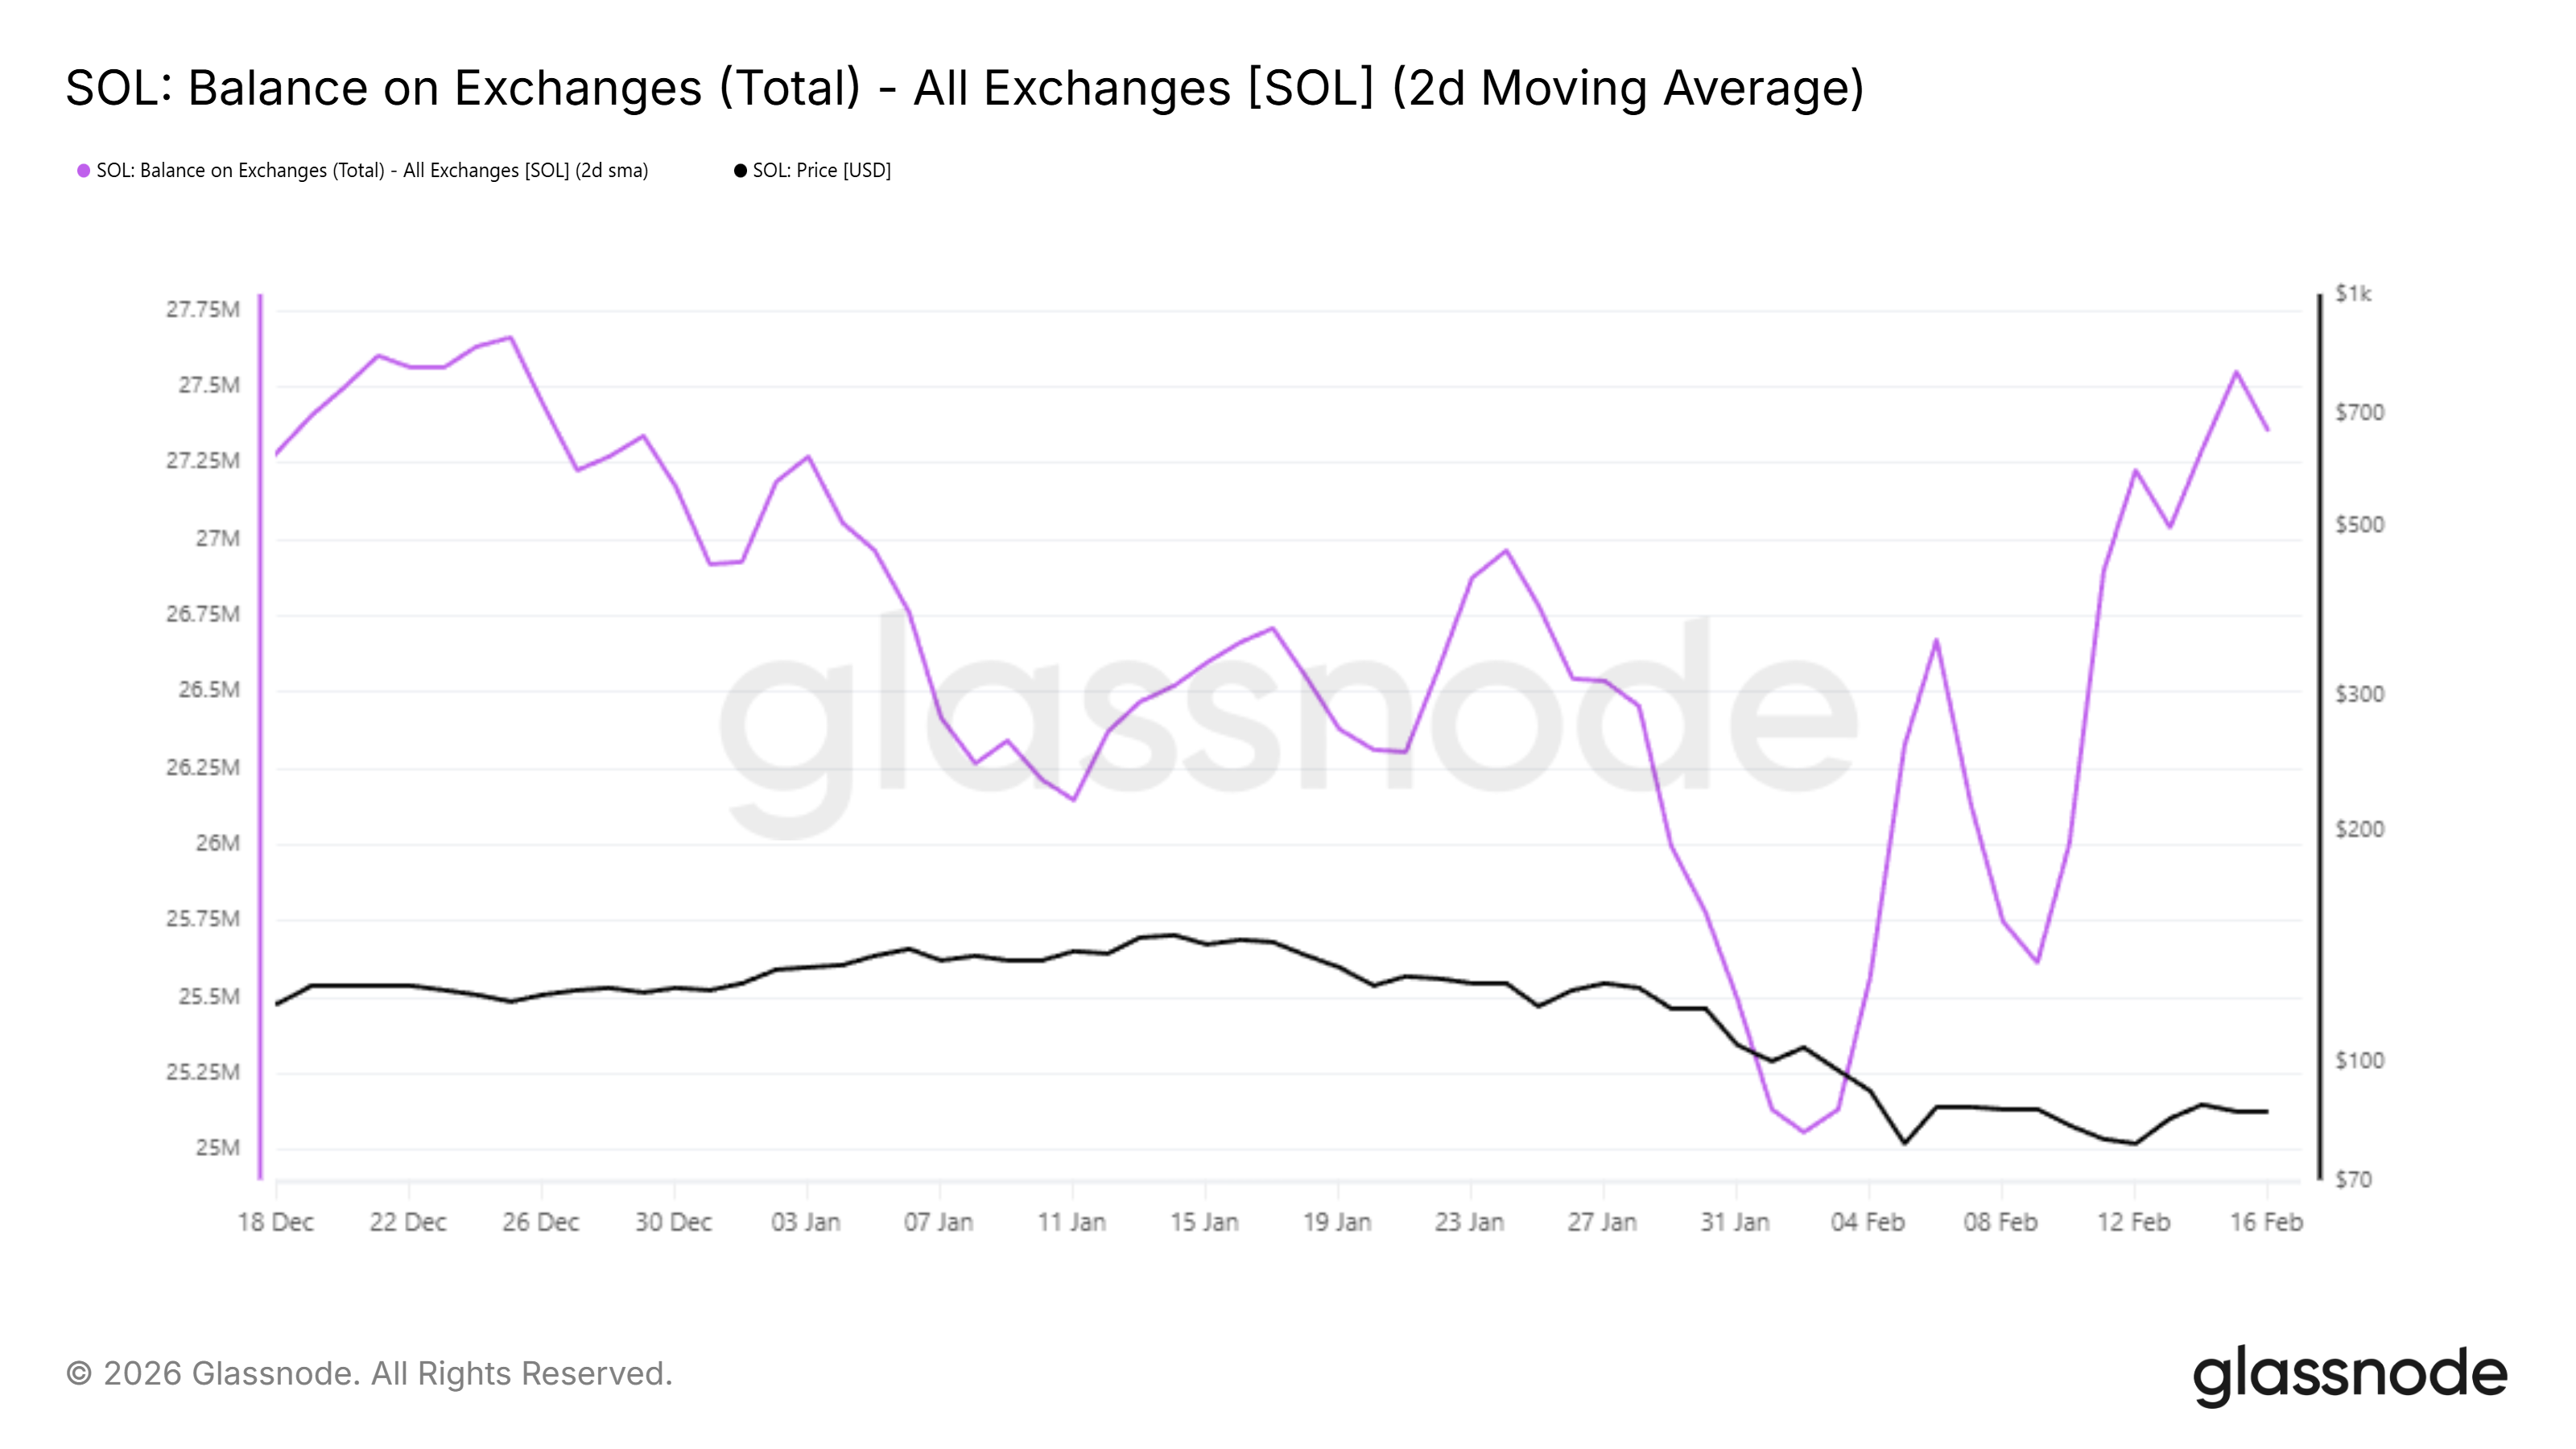
Rising exchange reserves generally amplify downward pressure. Larger balances make it easier for traders to execute sell orders. However, this influx has also triggered a historical capitulation signal. Similar spikes in exchange supply previously aligned with late-stage bear market conditions.
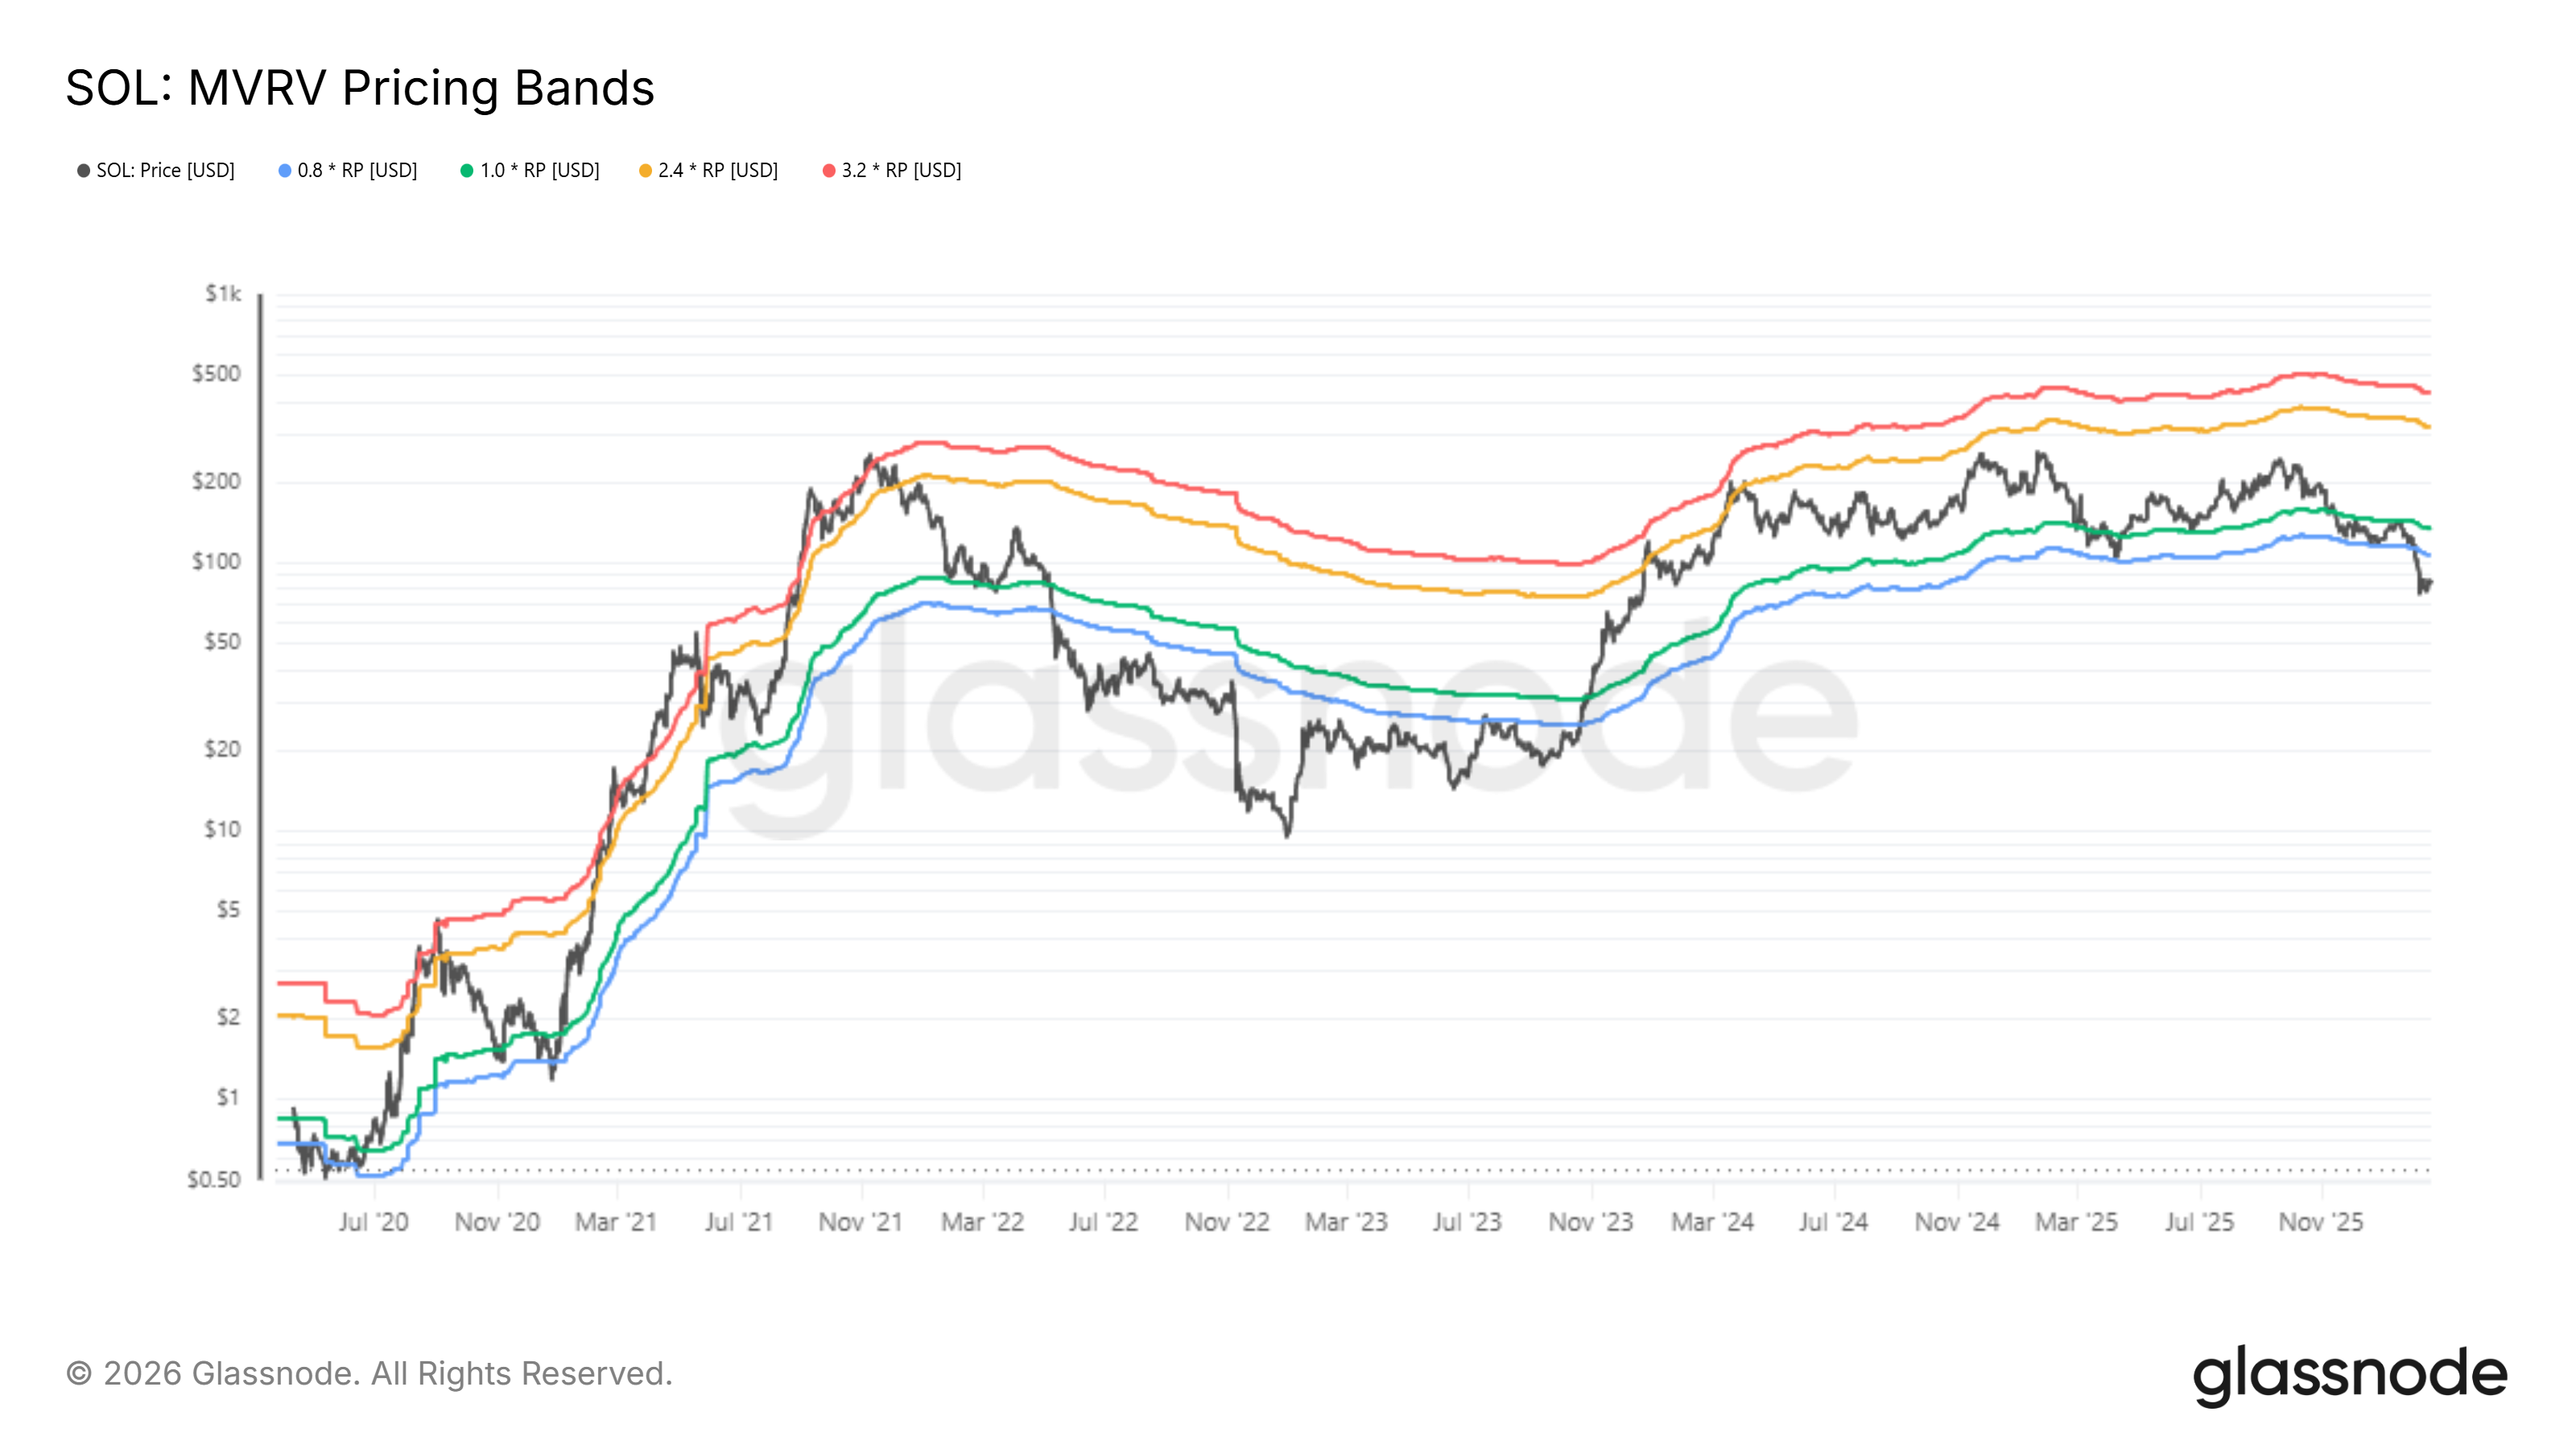
The MVRV Pricing Bands provide critical valuation context. Solana’s price is currently trading below the Extreme Lows deviation band. For this classification, the Market Value to Realized Value ratio must stay below 0.8 for roughly 5% of trading days.
SOL has remained beneath that threshold for 26% of recent sessions. This confirms a prolonged undervaluation phase. The only comparable event occurred in May 2022. Following that period, Solana remained depressed for 17 months before staging a meaningful recovery.
SOL Price Downtrend Continues
Solana is trading at $86 at the time of writing. The token remains capped below the $90 resistance while holding above the $81 support zone. A move above $90 would intersect the prevailing downtrend line, signaling potential technical improvement.
However, current data suggests downside risk persists. Continued exchange inflows and weak macro momentum could pressure SOL further. A decisive break below $81 may expose the next support near $67, extending the drawdown.
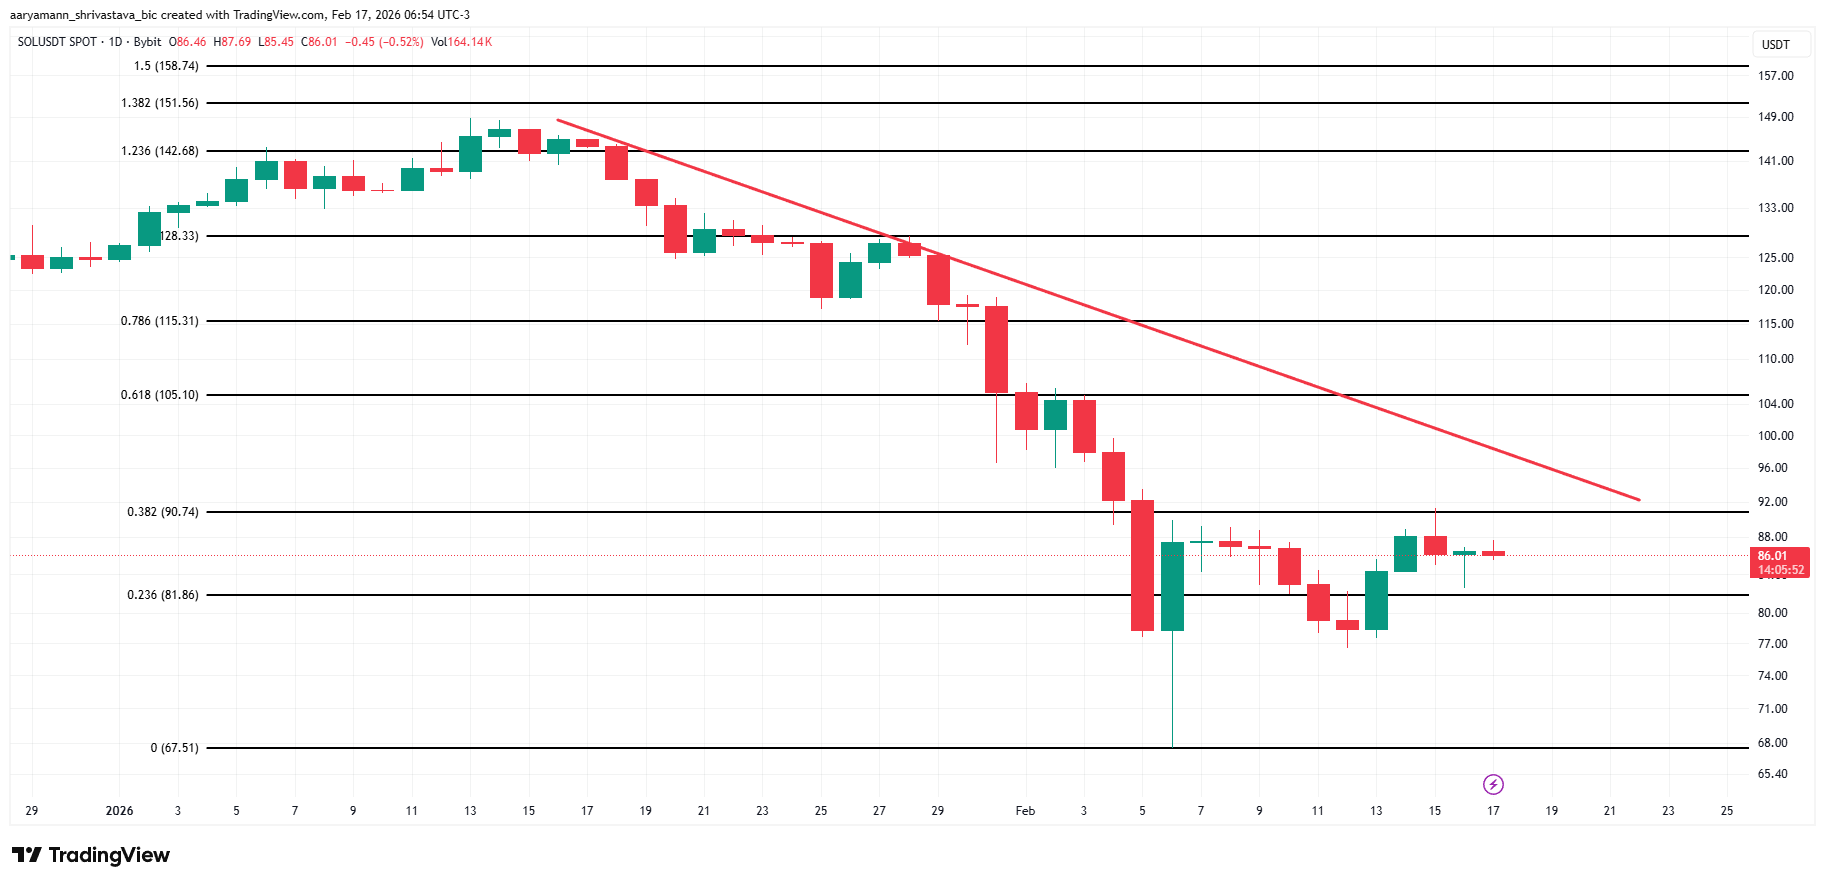
Alternatively, reclaiming $90 would shift short-term sentiment. A breakout above the descending trendline could attract renewed capital inflows. If momentum strengthens, SOL may rally toward $105 and potentially higher, invalidating the prevailing bearish thesis.


