


Solana’s recent price action reflects a failed recovery attempt that confirmed a previously projected downside break. After struggling to sustain upward momentum, SOL reversed lower as selling pressure intensified.
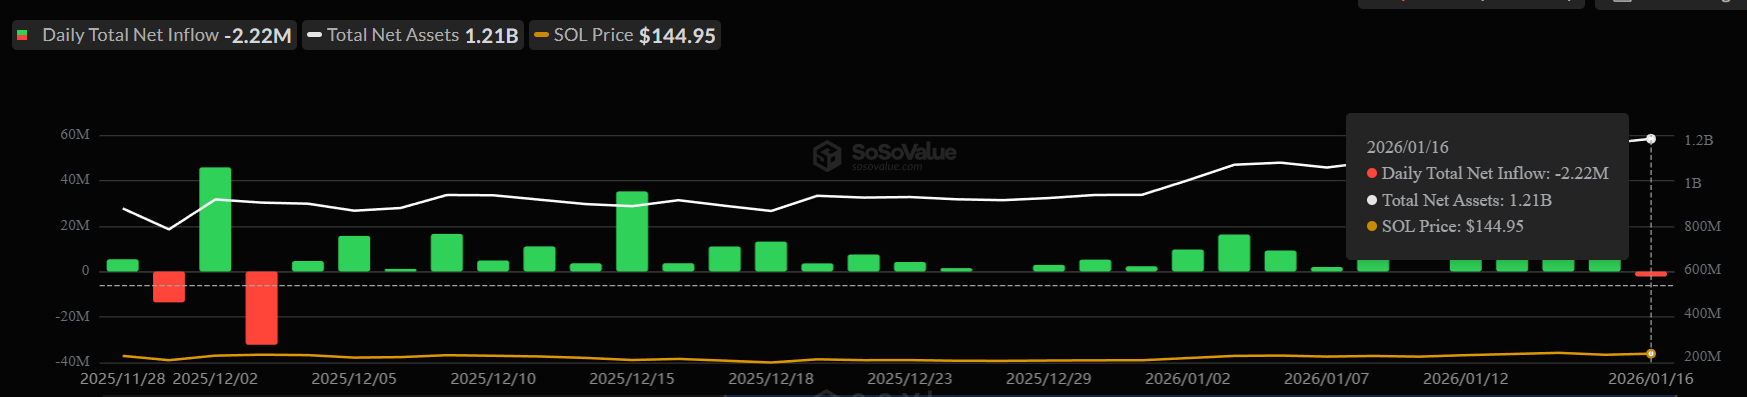
Investor confidence weakened following recent losses, which spilled into exchange-traded funds, ending a four-week streak of inflows into Solana-focused ETFs.
Solana Loses Investors’ Confidence
Solana spot ETFs recorded their first net outflows in a month, marking a clear shift in institutional sentiment. The previous outflows occurred on December 3, 2025, making the latest data point significant. This change suggests macro-focused investors are reassessing exposure as SOL fails to maintain its attempted rally.
The lack of price follow-through has reduced conviction among larger market participants. ETF flows often reflect longer-term positioning rather than short-term speculation. As Solana struggled to hold key technical levels, capital rotated out of SOL-linked products. These outflows add selling pressure and weaken near-term price stability.
Want more token insights like this? Sign up for Editor Harsh Notariya’s Daily Crypto Newsletter here.
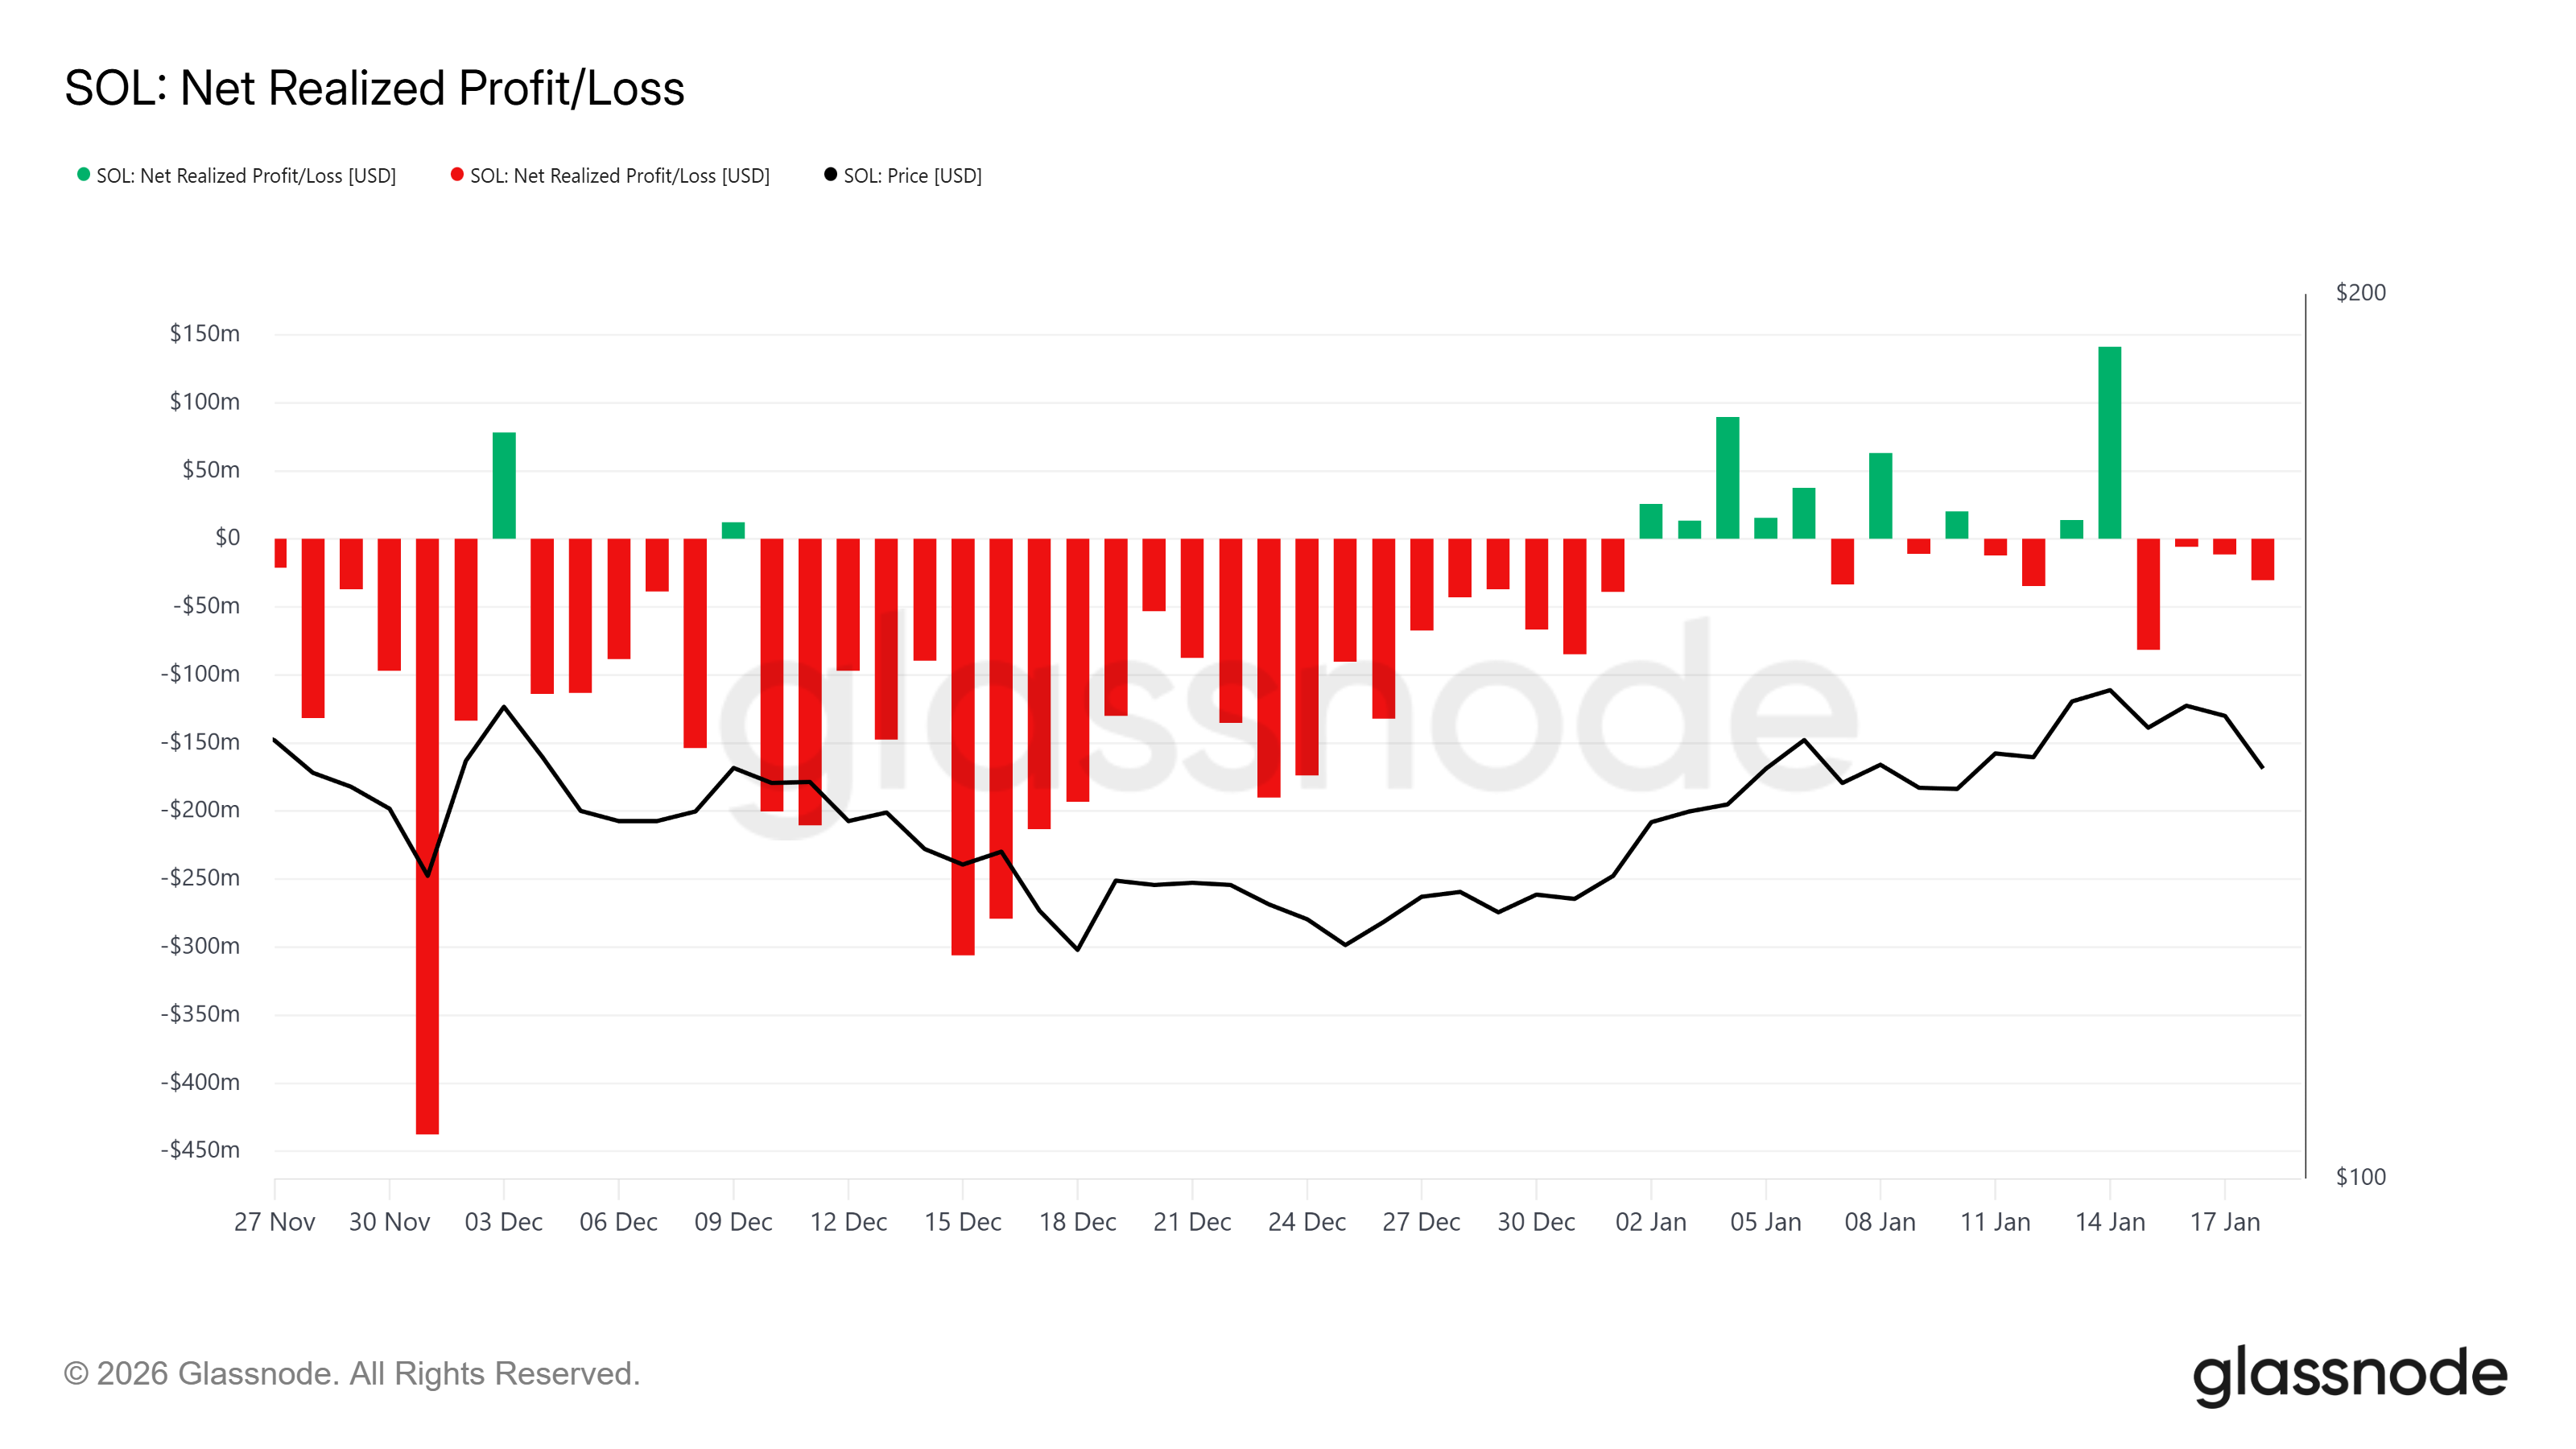
On-chain metrics reinforce the cautious outlook. Net Realized Profit/Loss data shows investors have recorded net losses for four consecutive days. This trend signals growing stress among holders as price declines erase recent gains. Persistent losses often precede increased distribution, especially during uncertain market conditions.
Realized losses dominated Solana throughout December 2025, highlighting prolonged downside pressure. January initially brought relief, with improved profitability. However, panic selling over the past four days offset those gains. Underwater holders appear increasingly willing to exit positions, adding supply and pushing SOL deeper into a corrective phase.
SOL Price Breakdown
Solana trades near $133 at the time of writing after breaking down from an ascending wedge pattern. This technical structure projected a decline of nearly 10% to $128. SOL approached that level during recent trading, confirming the pattern’s bearish implications and validating downside risk.
After marking an intraday low of $130, Solana appears vulnerable to further weakness. A move toward $128 remains likely in the coming days. ETF outflows, realized losses, and fading investor confidence collectively point to continued pressure on SOL price action.
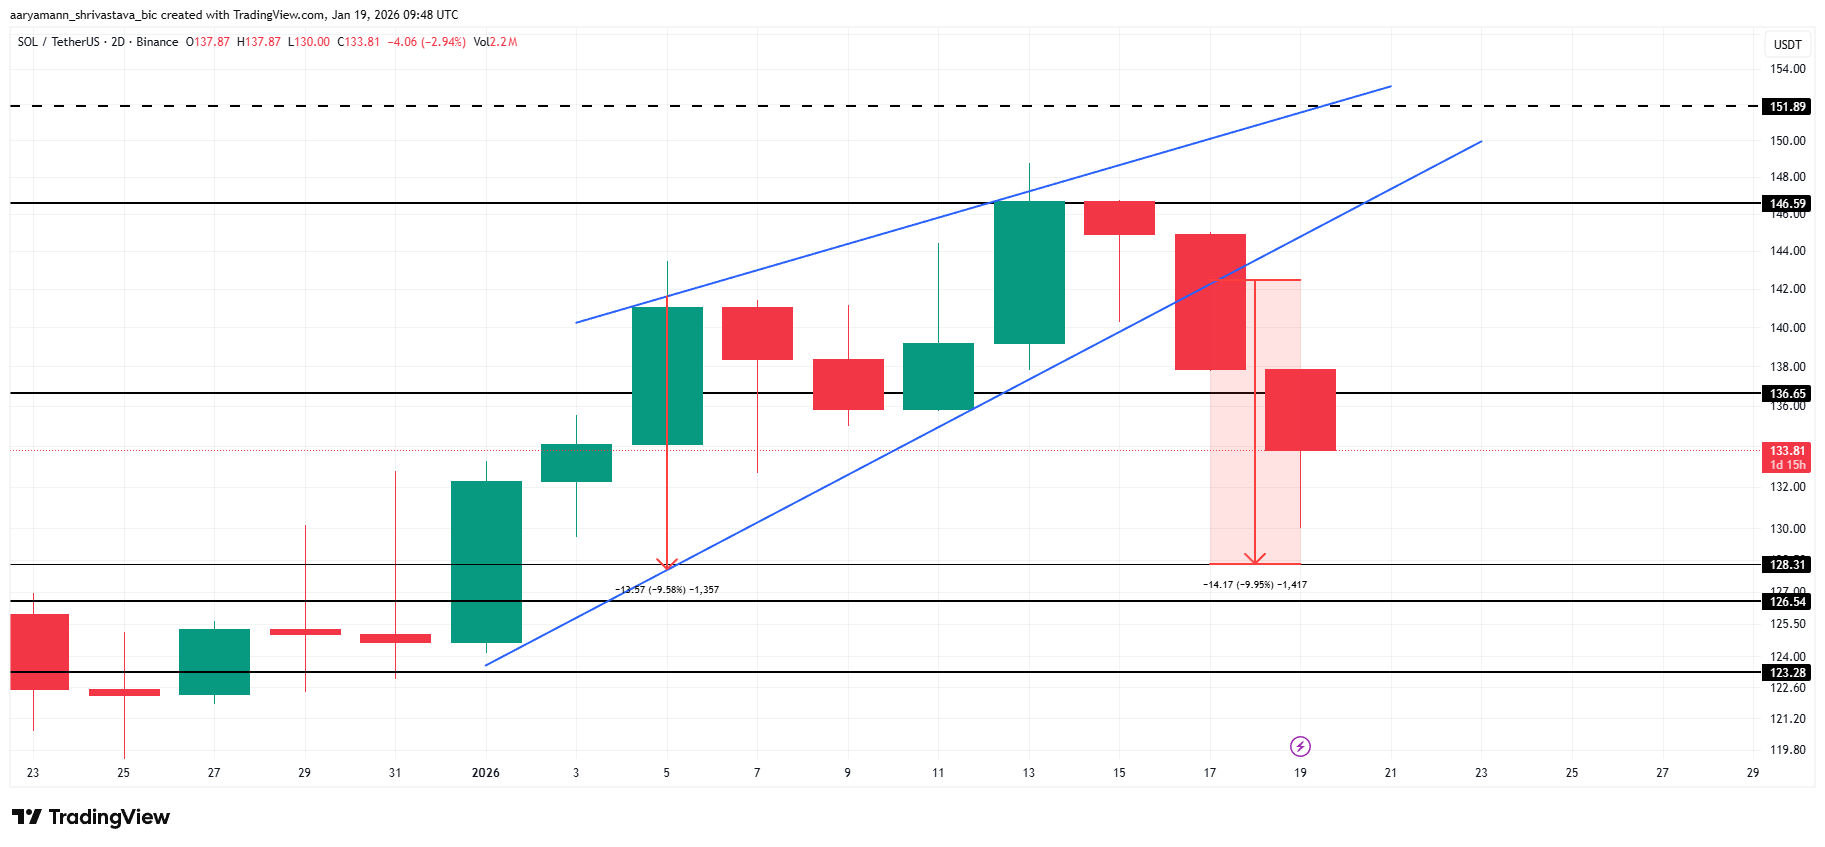
The bearish outlook could change if ETF outflows stabilize. Should institutional selling ease, Solana may reclaim $136 as support. Holding that level would invalidate the current bearish thesis. A successful recovery could open a path toward $146, signaling renewed confidence and improved short-term momentum.



