


Layer-1 coin Solana has climbed nearly 10% over the past week, fueled by renewed momentum across the broader crypto market. Bitcoin’s recent surge has helped lift the wider market, dragging SOL and other altcoins higher.
However, a closer assessment of SOL performance suggests that its rally lacks strong backing and could face a reversal soon.
Solana’s Price Gains at Risk: Data Hints at Trouble
SOL’s rally faces a threat of decline as its Chaikin Money Flow (CMF) trends downward, forming a bearish divergence. As of this writing, the momentum indicator rests below the zero line at -0.06 and continues to trend lower.
For token TA and market updates: Want more token insights like this? Sign up for Editor Harsh Notariya’s Daily Crypto Newsletter here.
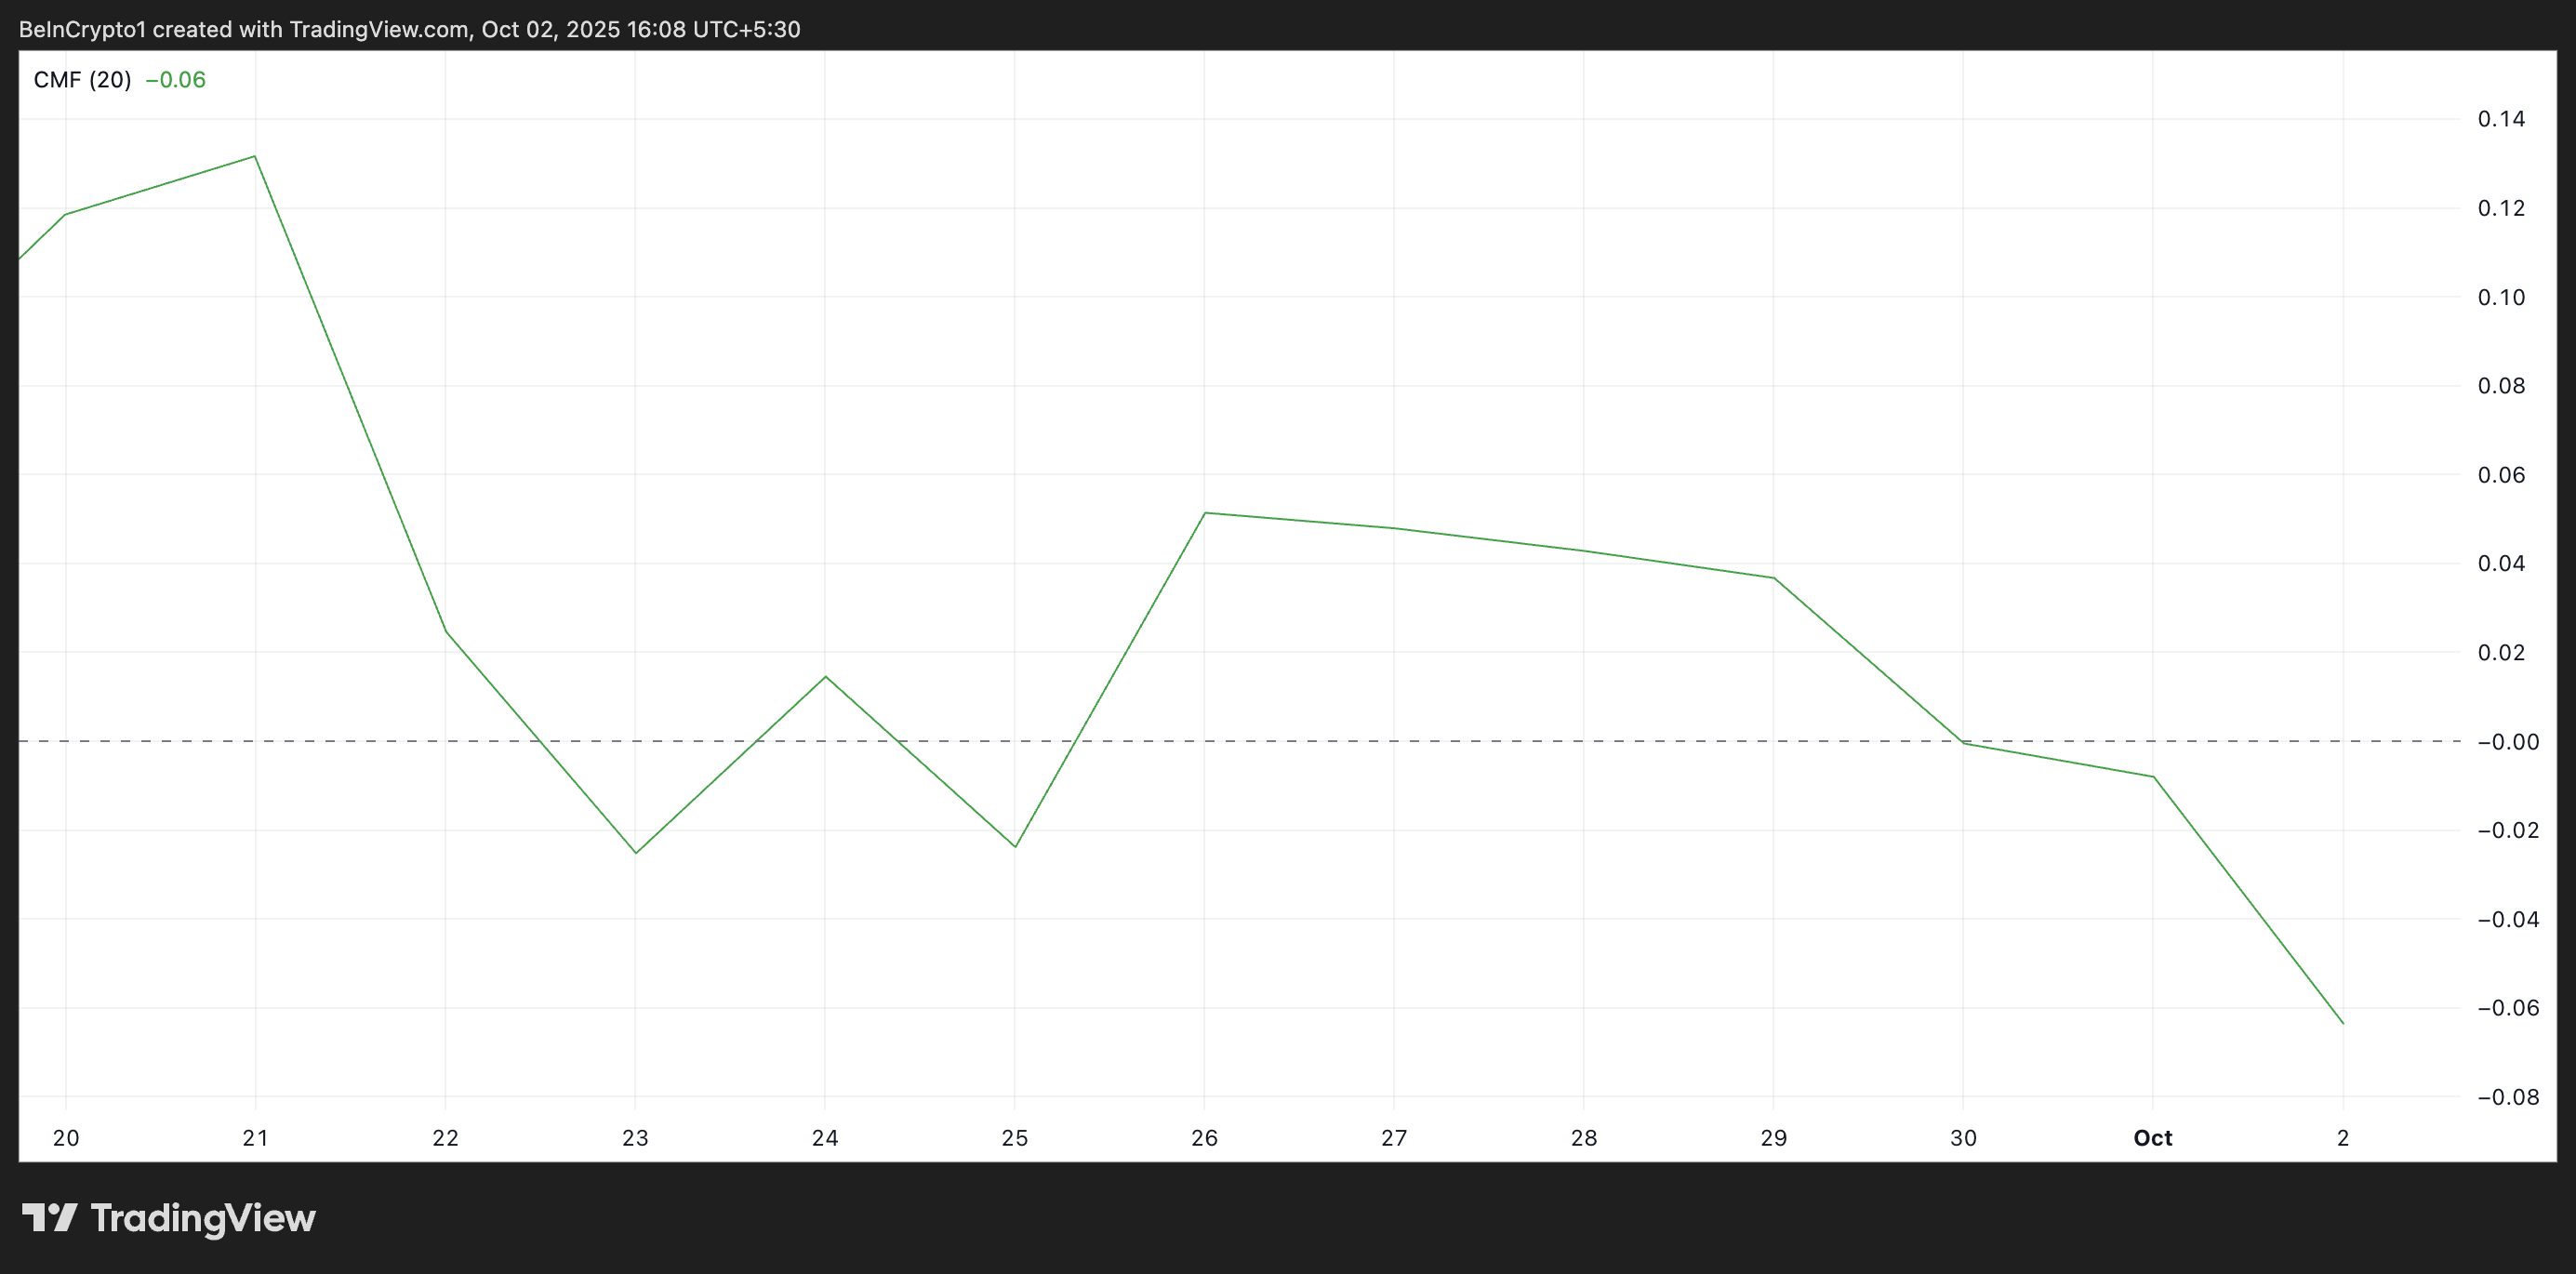
The CMF indicator measures how money flows into and out of an asset. When it returns negative values while an asset’s price climbs, it forms a bearish divergence, indicating weakening liquidity.
This pattern suggests that even though SOL buyers are still pushing the price higher, capital inflow into the asset is declining and could trigger a reversal in the near term.
Moreover, the number of new addresses engaging with the Solana network daily has declined, signaling reduced activity and waning demand. Per Glassnode, the daily count of new wallet addresses on Solana has plunged by 15% since September 18.
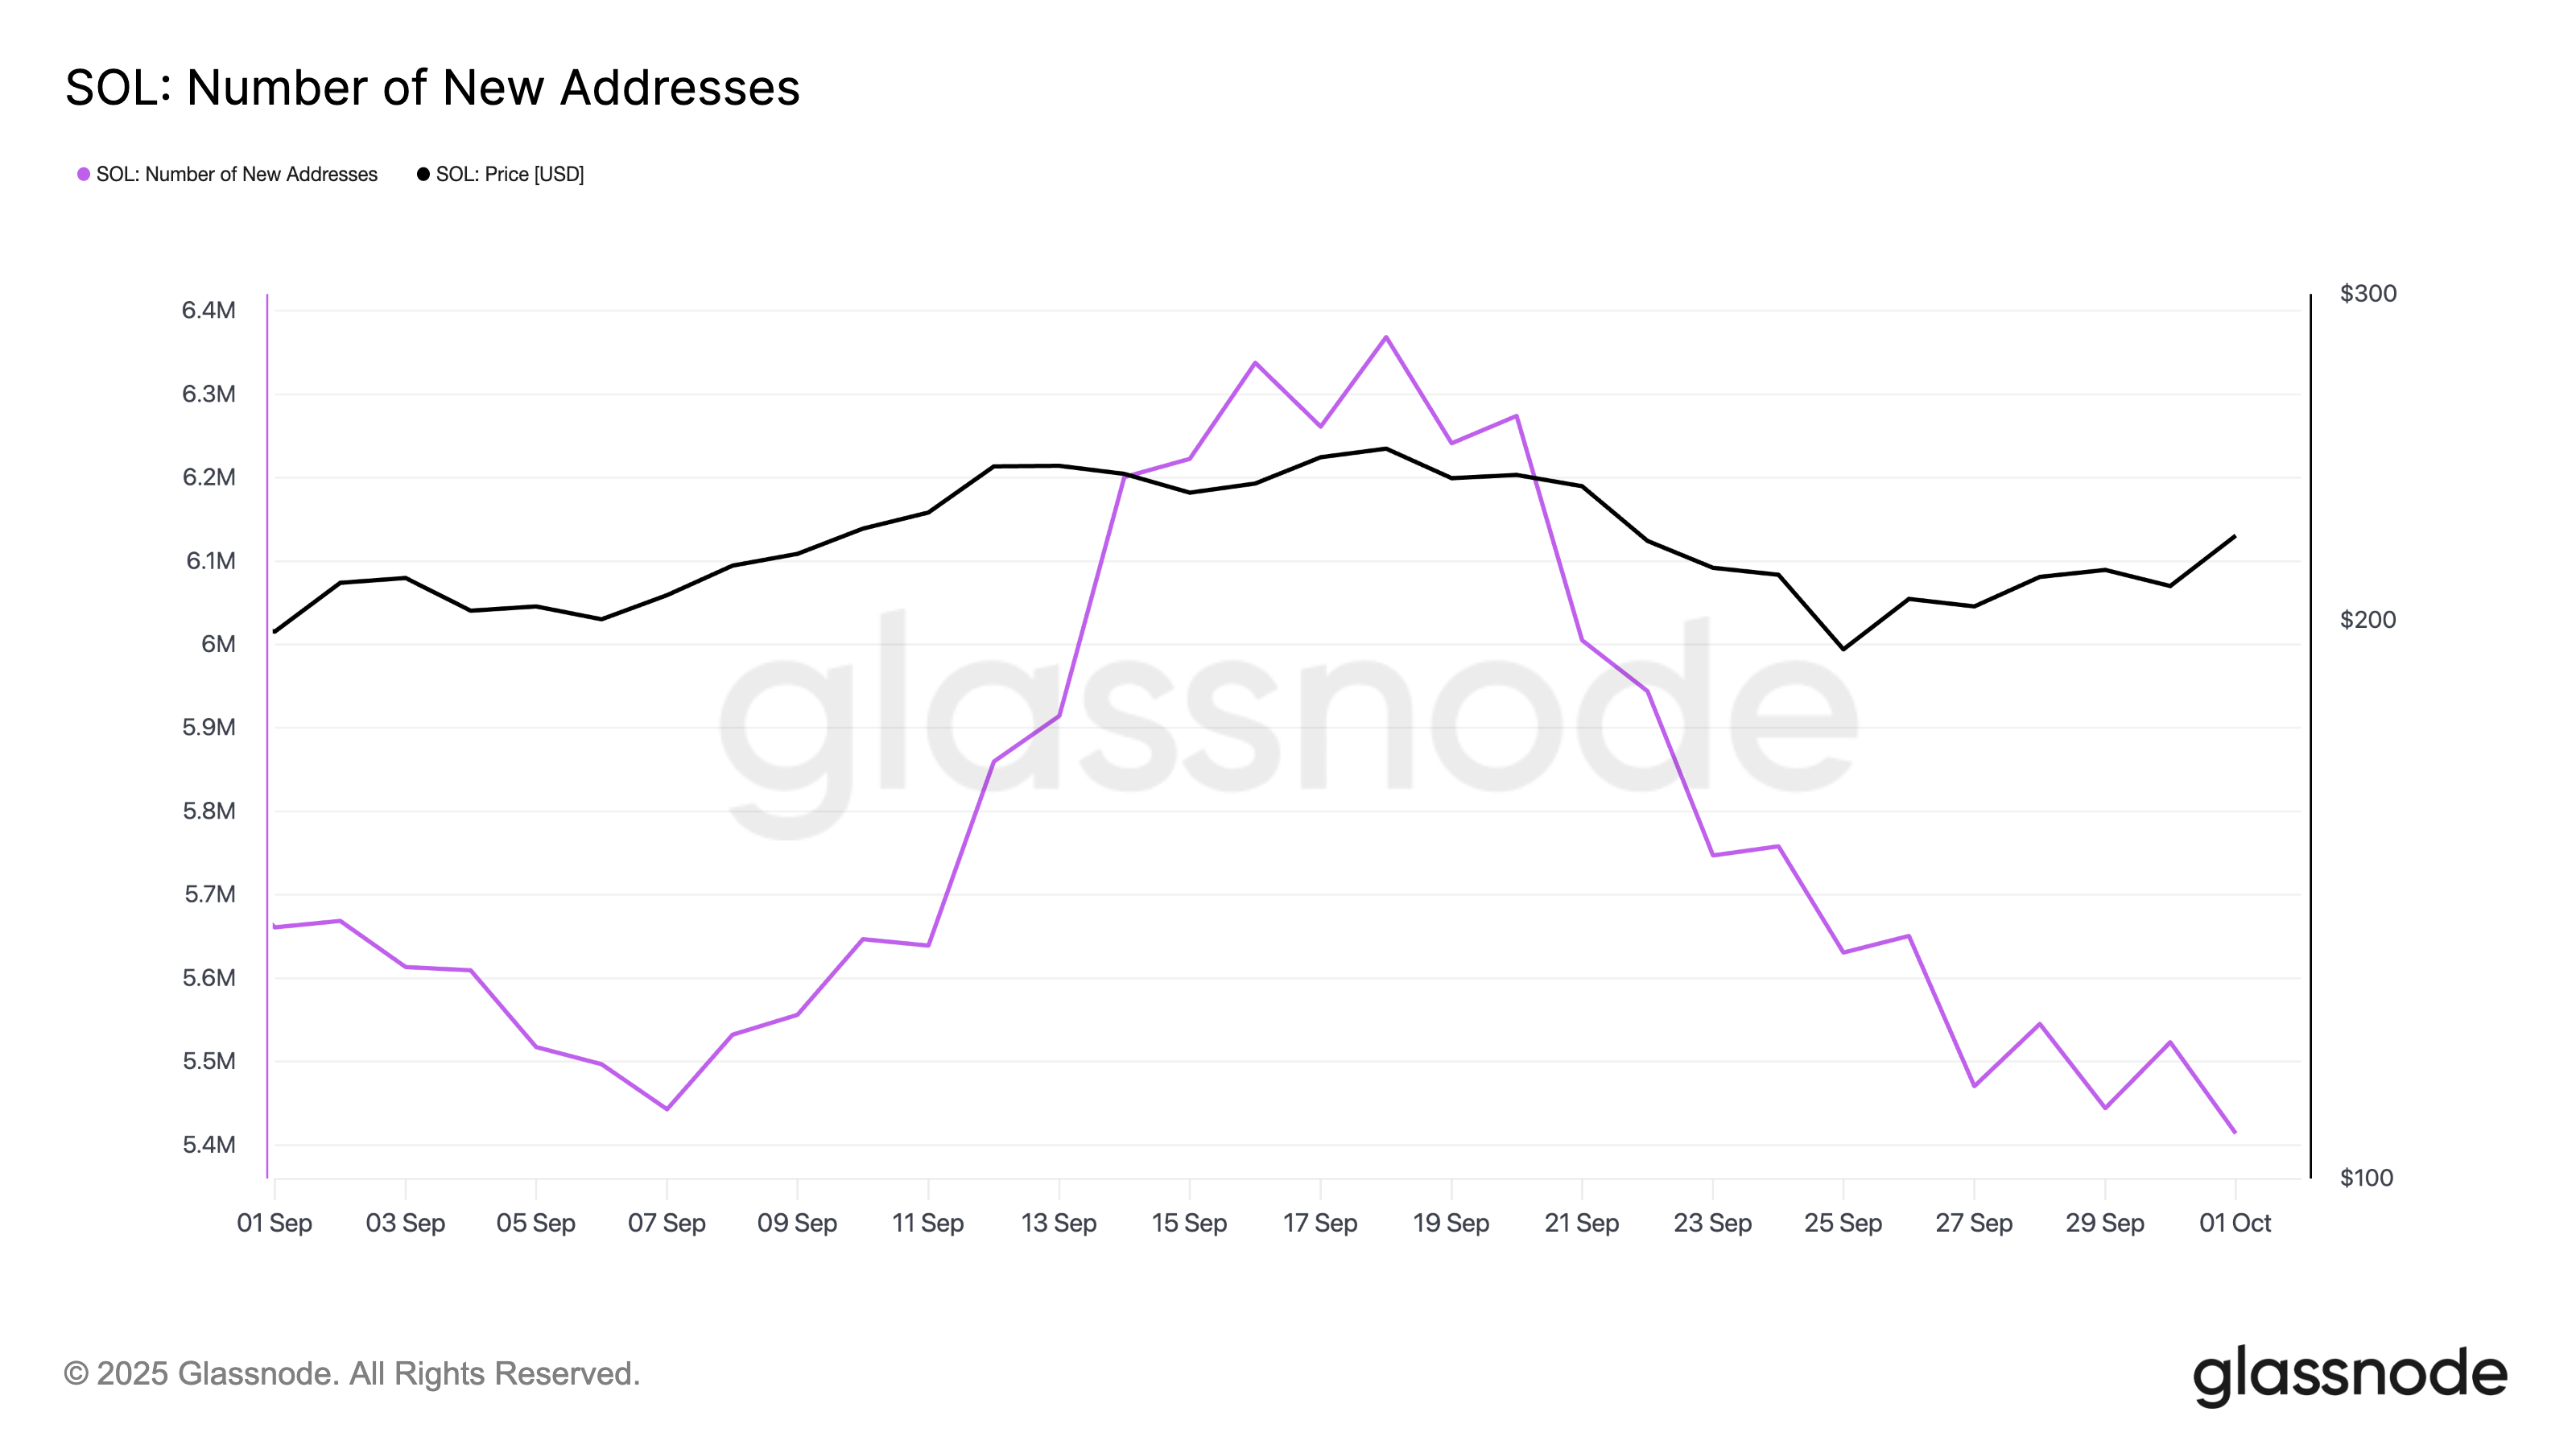
A drop in daily active addresses reflects a slowdown in network participation, which can be a warning sign for an asset’s underlying demand.
This may translate into lower buying pressure for SOL, reducing the likelihood of sustained upward price movement.
Weak Demand Clouds Solana Rally
SOL’s rally in the past week has put its price in an ascending parallel channel, which generally signals a bullish trend. However, with the underlying demand losing strength, the token’s price could break below this pattern and fall toward $205.02.
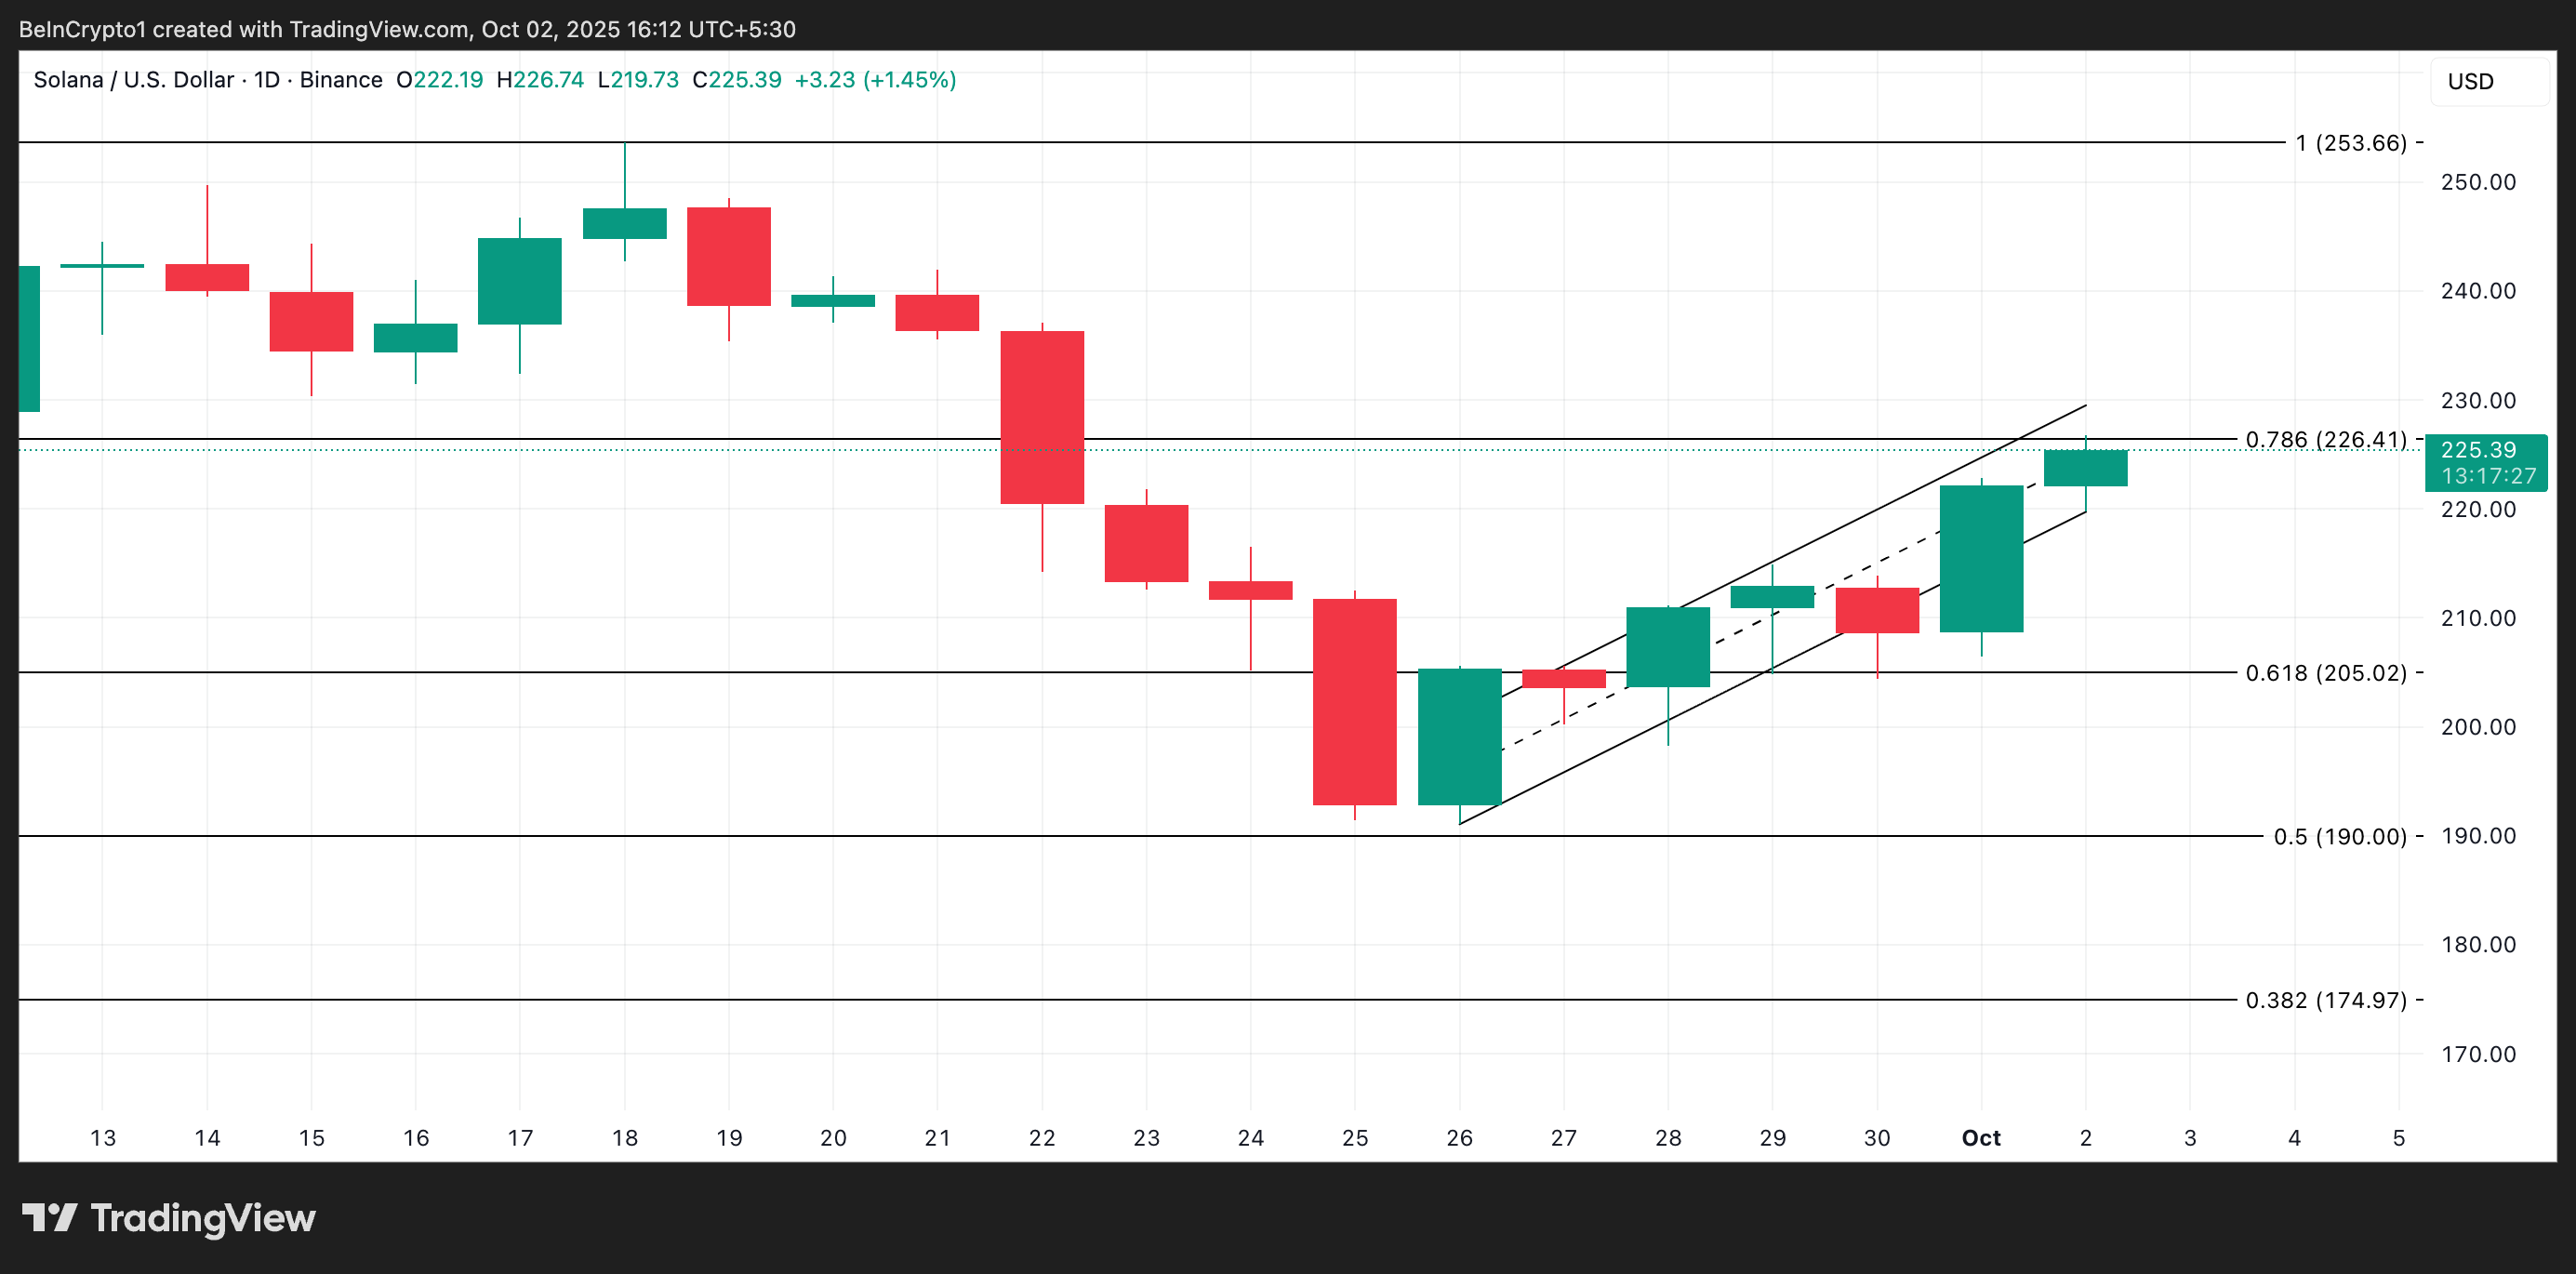
Conversely, if the altcoin maintains its rally, its price could reach $253.66.



