Shiba Inu (SHIB) has been experiencing volatility, and its mid- and long-term charts show mixed signals.
This comprehensive analysis will explore the current price action and technical indicators, providing a clear outlook for traders. Additionally, we will delve into the recent liquidation data to understand market sentiment and offer strategic recommendations for navigating the Shiba market.
Shiba Inu Technical Analysis: Bearish to Neutral Outlook
4-Hour Timeframe Analysis
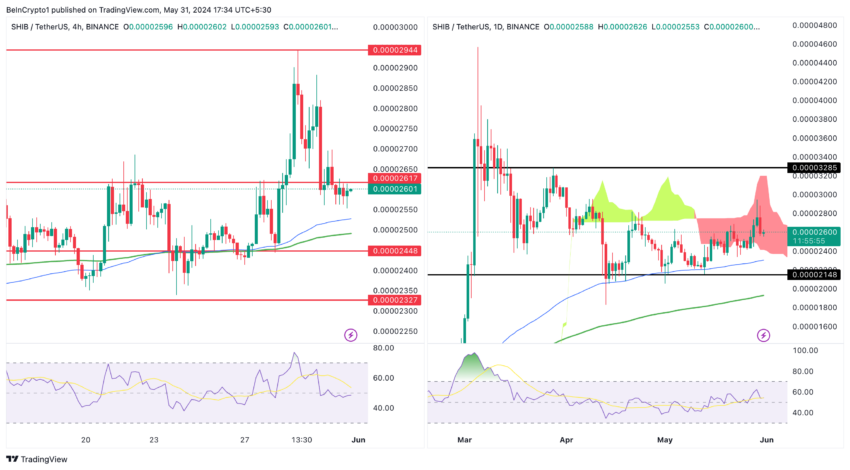
SHIB has been experiencing choppy price action without clear direction at this moment. It is hovering around the $0.00002617 resistance level and finding support around $0.00002448.

- 100-period EMA (Blue): Currently providing a support level near $0.00002528.
- 200-period EMA (Green): Acting as support near $0.00002500.
- RSI: The Relative Strength Index (RSI) is around 50, indicating neutral momentum. RSI has declined from 70 to 50, indicating a downward trend.
Support and Resistance Levels (4H):
The immediate resistance level is $0.00002617. Breaking above this level could signal a short-term bullish move toward $0.00002944.
Conversely, key support is at $0.00002448. A drop below this level could lead to further declines towards $0.00002327.
Read More: How To Buy Shiba Inu (SHIB) and Everything You Need To Know
Daily Timeframe Analysis
SHIB has been in a sideways trend on the daily chart, trading inside the Ichimoku Cloud, indicating indecision.
Technical Indicators:
- Price Location: The price is trading within the Ichimoku Cloud, indicating a neutral trend. The top of the cloud is acting as resistance around $0.00002800.
- Conversion Line (Tenkan-sen): It is close to the current price, further highlighting the lack of a strong trend.
- Moving Averages:
- 100-day EMA (Blue): Currently below the price at $0.00002200, providing support.
- 200-day EMA (Green): Below the current price, indicating long-term support.
- RSI: The RSI is around 50, reflecting a balanced market with neither overbought nor oversold conditions.
Support and Resistance Levels (1D):
The top of the Ichimoku Cloud marks immediate resistance at $0.00003200. A break above this level could target $0.00004500.
Conversely, key support is approximately $0.00002300, coinciding with the 100-day EMA and the lower boundary of the daily Ichimoku cloud. Falling below this level could signal the continuation of a bearish trend.
SHIB Liquidations Data: Market Sentiment Insights
The chart displays the liquidations of Shiba Inu trading positions, categorized into long (green bars) and short (red bars) liquidations over a specified period.
Spikes in long liquidations are observed on May 30, indicating significant downward pressure during that period.
Short liquidations are generally less frequent but have notable spikes, particularly around the end of May.

The recent dominance of long liquidations indicates a bearish sentiment in the market. Traders who expected SHIB’s price to rise have been caught off guard by price declines, leading to forced liquidations of long positions.
After all, traders should be cautious about using high leverage in such a volatile environment. Adjusting leverage levels and setting stop-loss orders may be prudent to mitigate liquidation risk.
Eventually, observing liquidation data can provide insights into market sentiment and potential price movements.
Strategic Recommendations for Traders
Outlook: Bearish to neutral. Furthermore, the daily chart indicates that SHIB is in a state of equilibrium, with the price trading within the Ichimoku Cloud and RSI at neutral levels. A clear breakout above $0.00002800 or a breakdown below $0.00002200 would be needed to establish a new upside trend.
Monitor Key Levels: Monitor critical support and resistance levels. For SHIB, these include $0.00002617 and $0.00002800 for potential bullish breakouts and $0.00002448 and $0.00002200 for bearish breakdowns.
Manage Leverage: Given the high volatility in the SHIB market, use leverage cautiously. Consider reducing leverage to minimize the risk of significant losses.
Read More: Shiba Inu (SHIB) Price Prediction 2024/2025/2030
Set Stop-Loss Orders: Protect your positions by setting stop-loss orders at strategic levels to avoid forced liquidations during sudden market movements.
Analyze Liquidation Trends: Use liquidation data to gauge market sentiment and anticipate potential price reversals or continuations. This can help you make informed trading decisions.
By integrating technical analysis with insights from liquidation data, traders can better navigate the volatile SHIB market, position themselves for potential opportunities, and reduce risks.
Disclaimer
In line with the Trust Project guidelines, this price analysis article is for informational purposes only and should not be considered financial or investment advice. BeInCrypto is committed to accurate, unbiased reporting, but market conditions are subject to change without notice. Always conduct your own research and consult with a professional before making any financial decisions. Please note that our Terms and Conditions, Privacy Policy, and Disclaimers have been updated.


