
PYTH, the token that powers oracle service provider Pyth Network, has witnessed a 5% price rally in the past 30 days, driving its total open interest to a 14-day peak of $34 million.
However, market indicators suggest that the rally may be short-lived, with a potential correction on the horizon.
Pyth Might Be Headed Toward Correction
At press time, PYTH’s total open interest is $34 million. It initiated its uptrend two days ago and has since risen by 21%. The token’s price has increased by 3% during the same period. As of this writing, PYTH trades at $0.34.
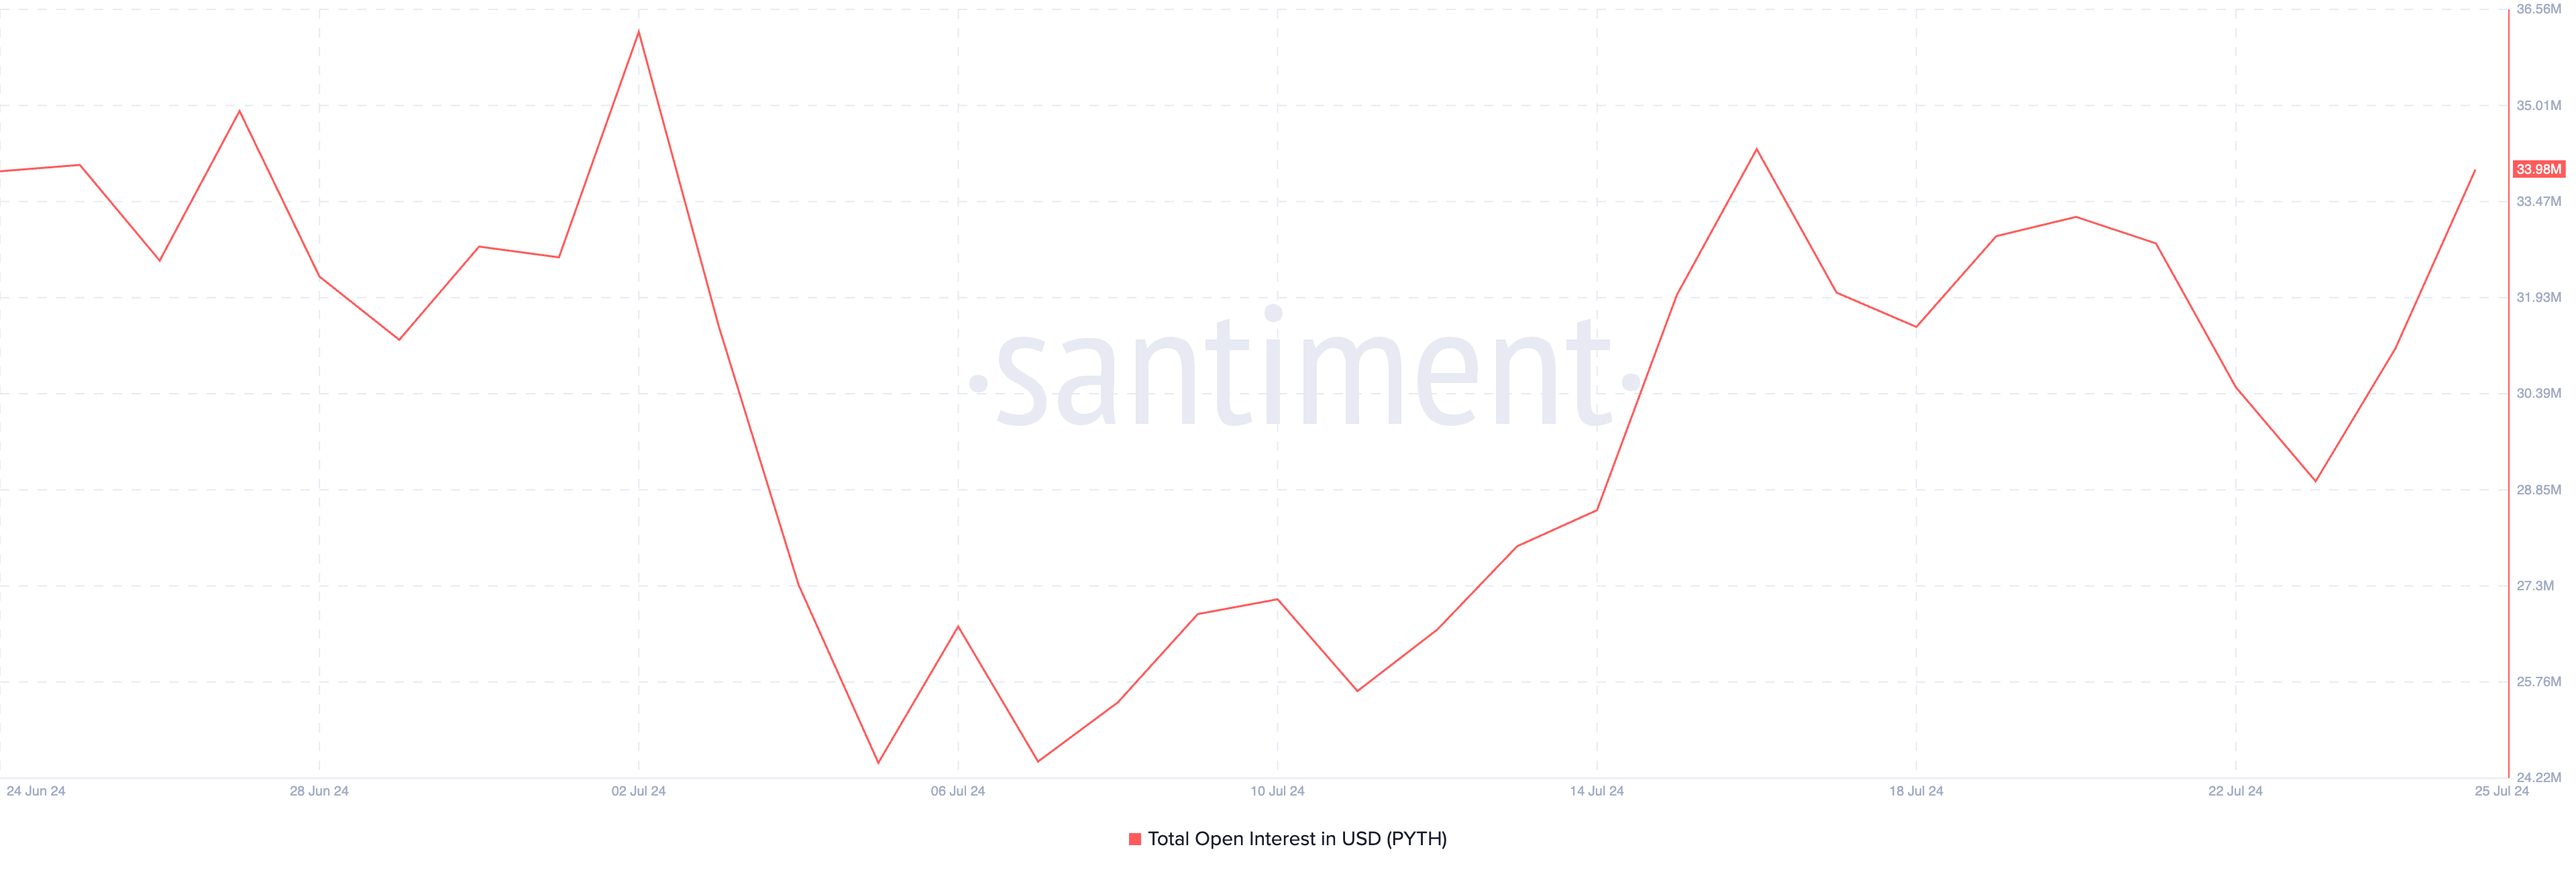
Open interest refers to the total number of outstanding derivative contracts, such as options or futures, that have not been settled. When it spikes, it means that more traders are entering into new positions.
PYTH’s steady positive funding rate across cryptocurrency exchanges shows that these traders have taken more long positions than short positions. According to Coinglass’ data, the token’s funding rate is 0.0059% at press time.

However, these long positions might witness liquidations as PYTH is poised to suffer a correction. At its current price, the altcoin trades below its 20-day exponential moving average (EMA) and is headed to cross below its 50-day small moving average (SMA).
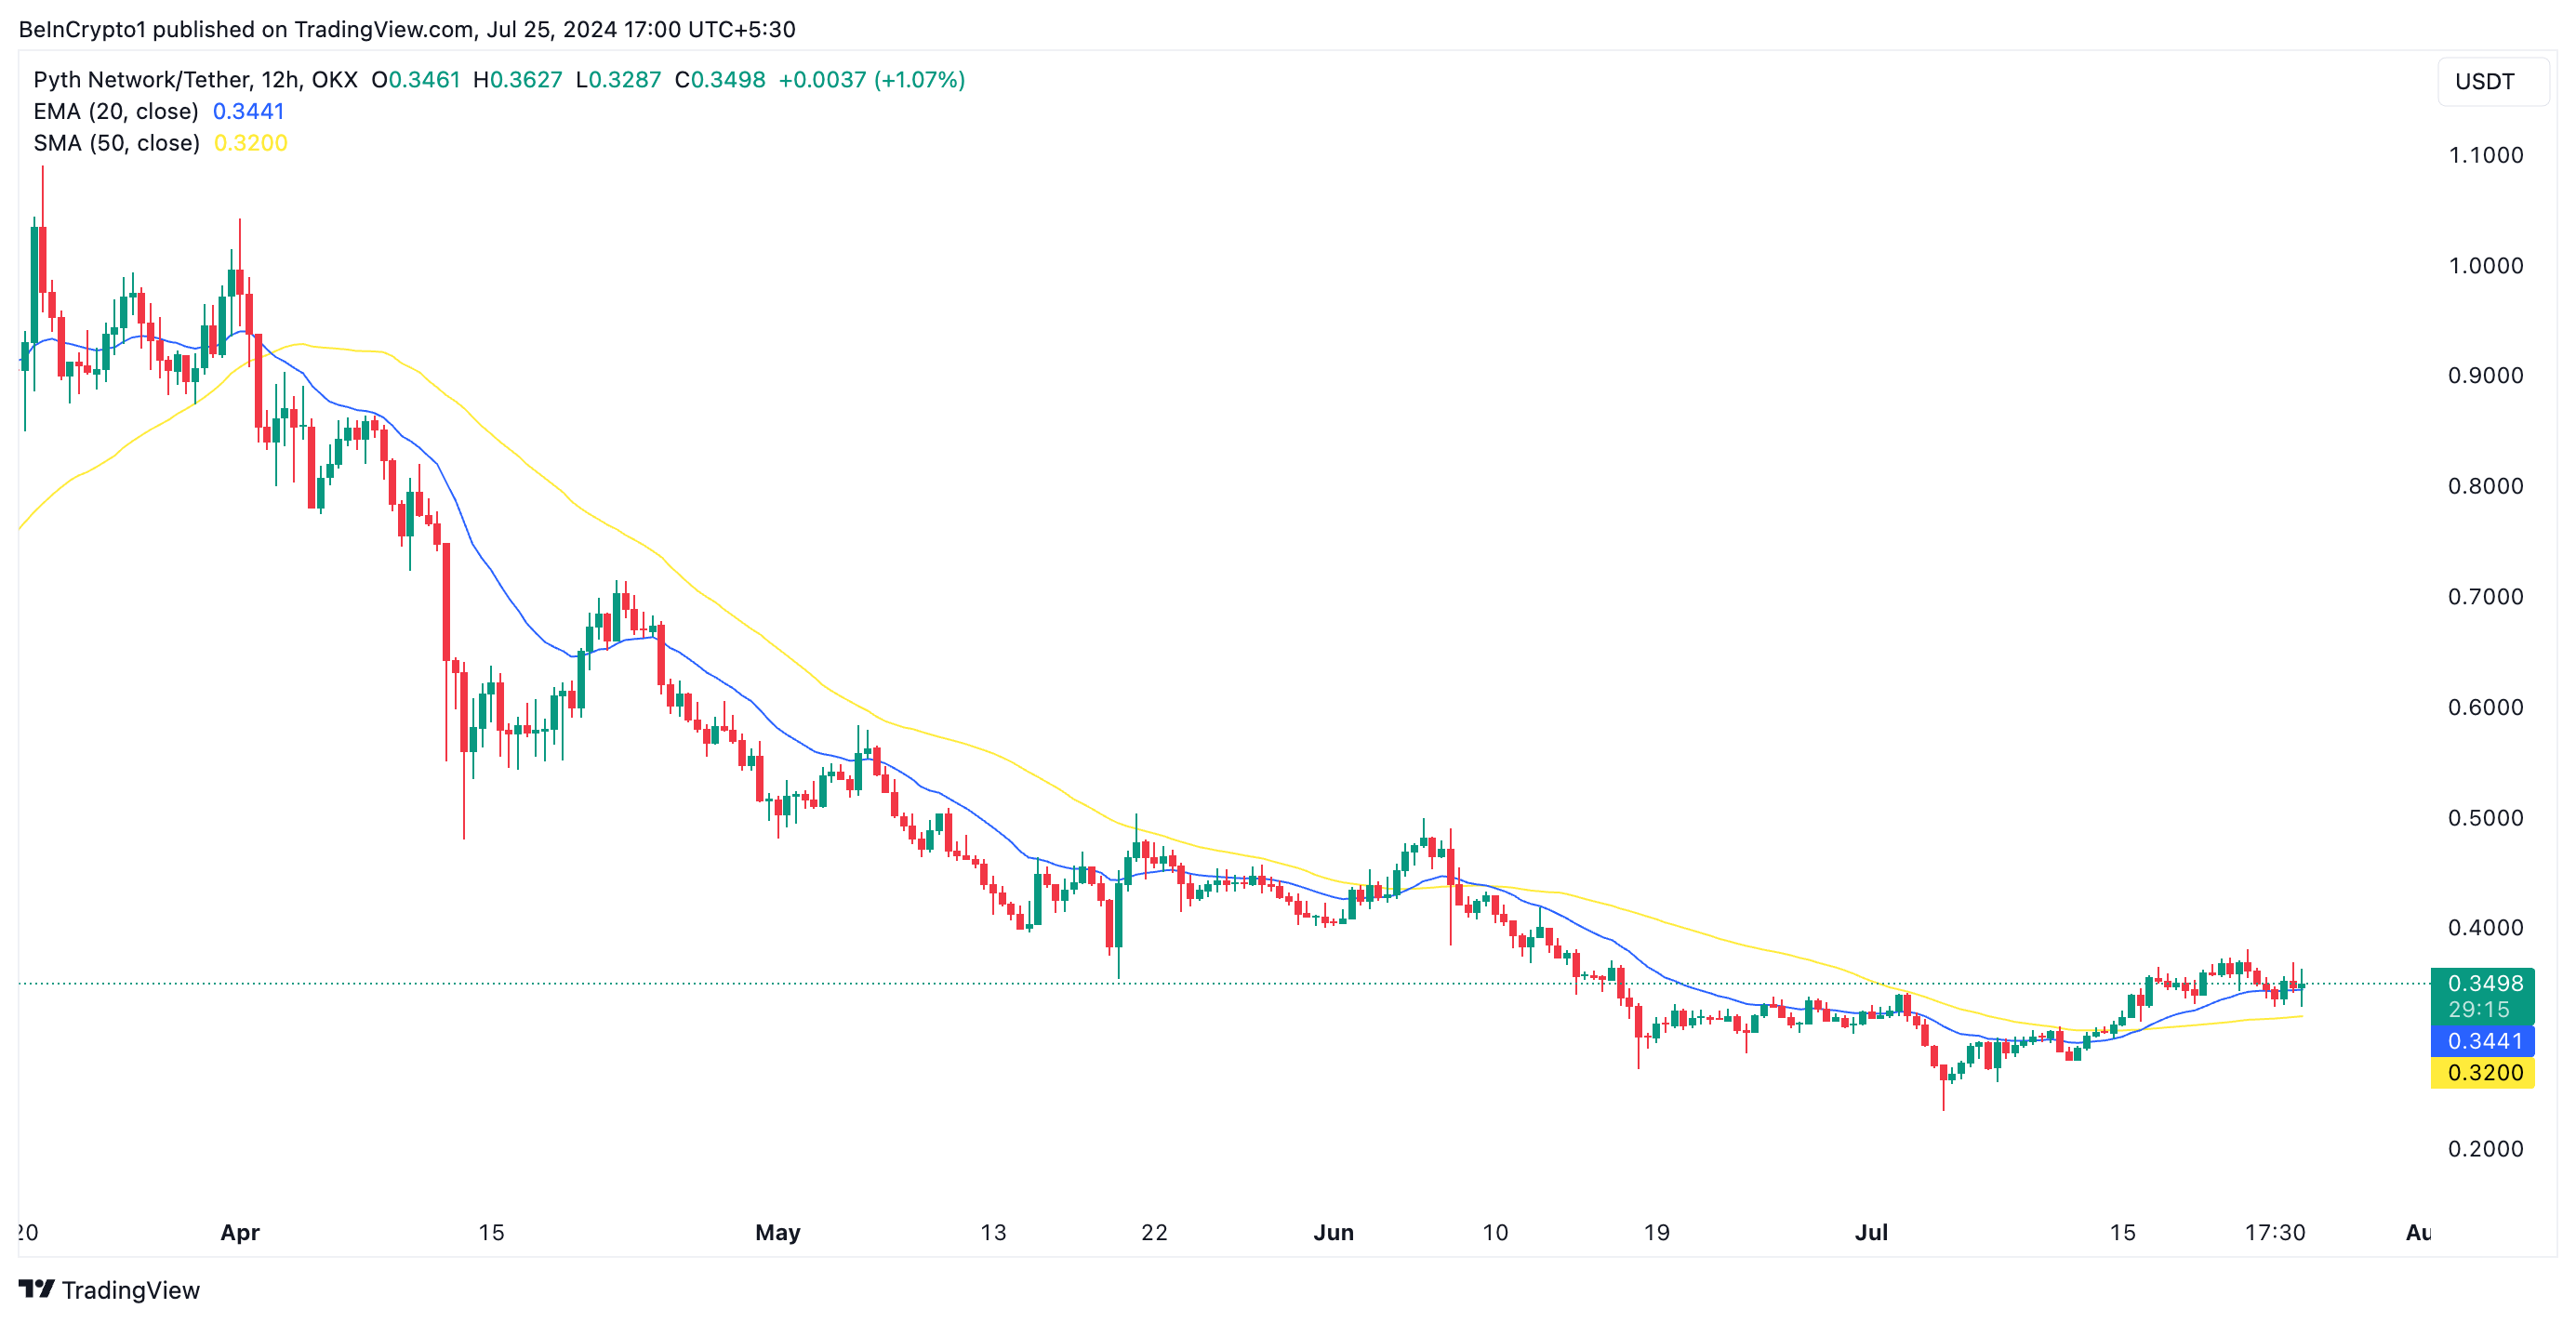
An asset’s 20-day EMA measures the average price of an asset over the past 20 trading days. Its 50-day SMA, on the other hand, calculates its average closing price over the past 50 days.
When an asset’s price falls below its 20-day EMA, it typically indicates short-term bearish sentiment among traders and investors. However, when it extends toward the 50-day SMA and prepares to fall below it, it signals that the downtrend might not be just short-term but could stretch into a longer period.
Further, PYTH’s falling Chaikin Money Flow (CMF) hints at liquidity exit from the market. This indicator tracks how money flows into and out of an asset. When it declines, it suggests a spike in selling pressure.
Read more: What Is a Blockchain Oracle? An Introductory Guide
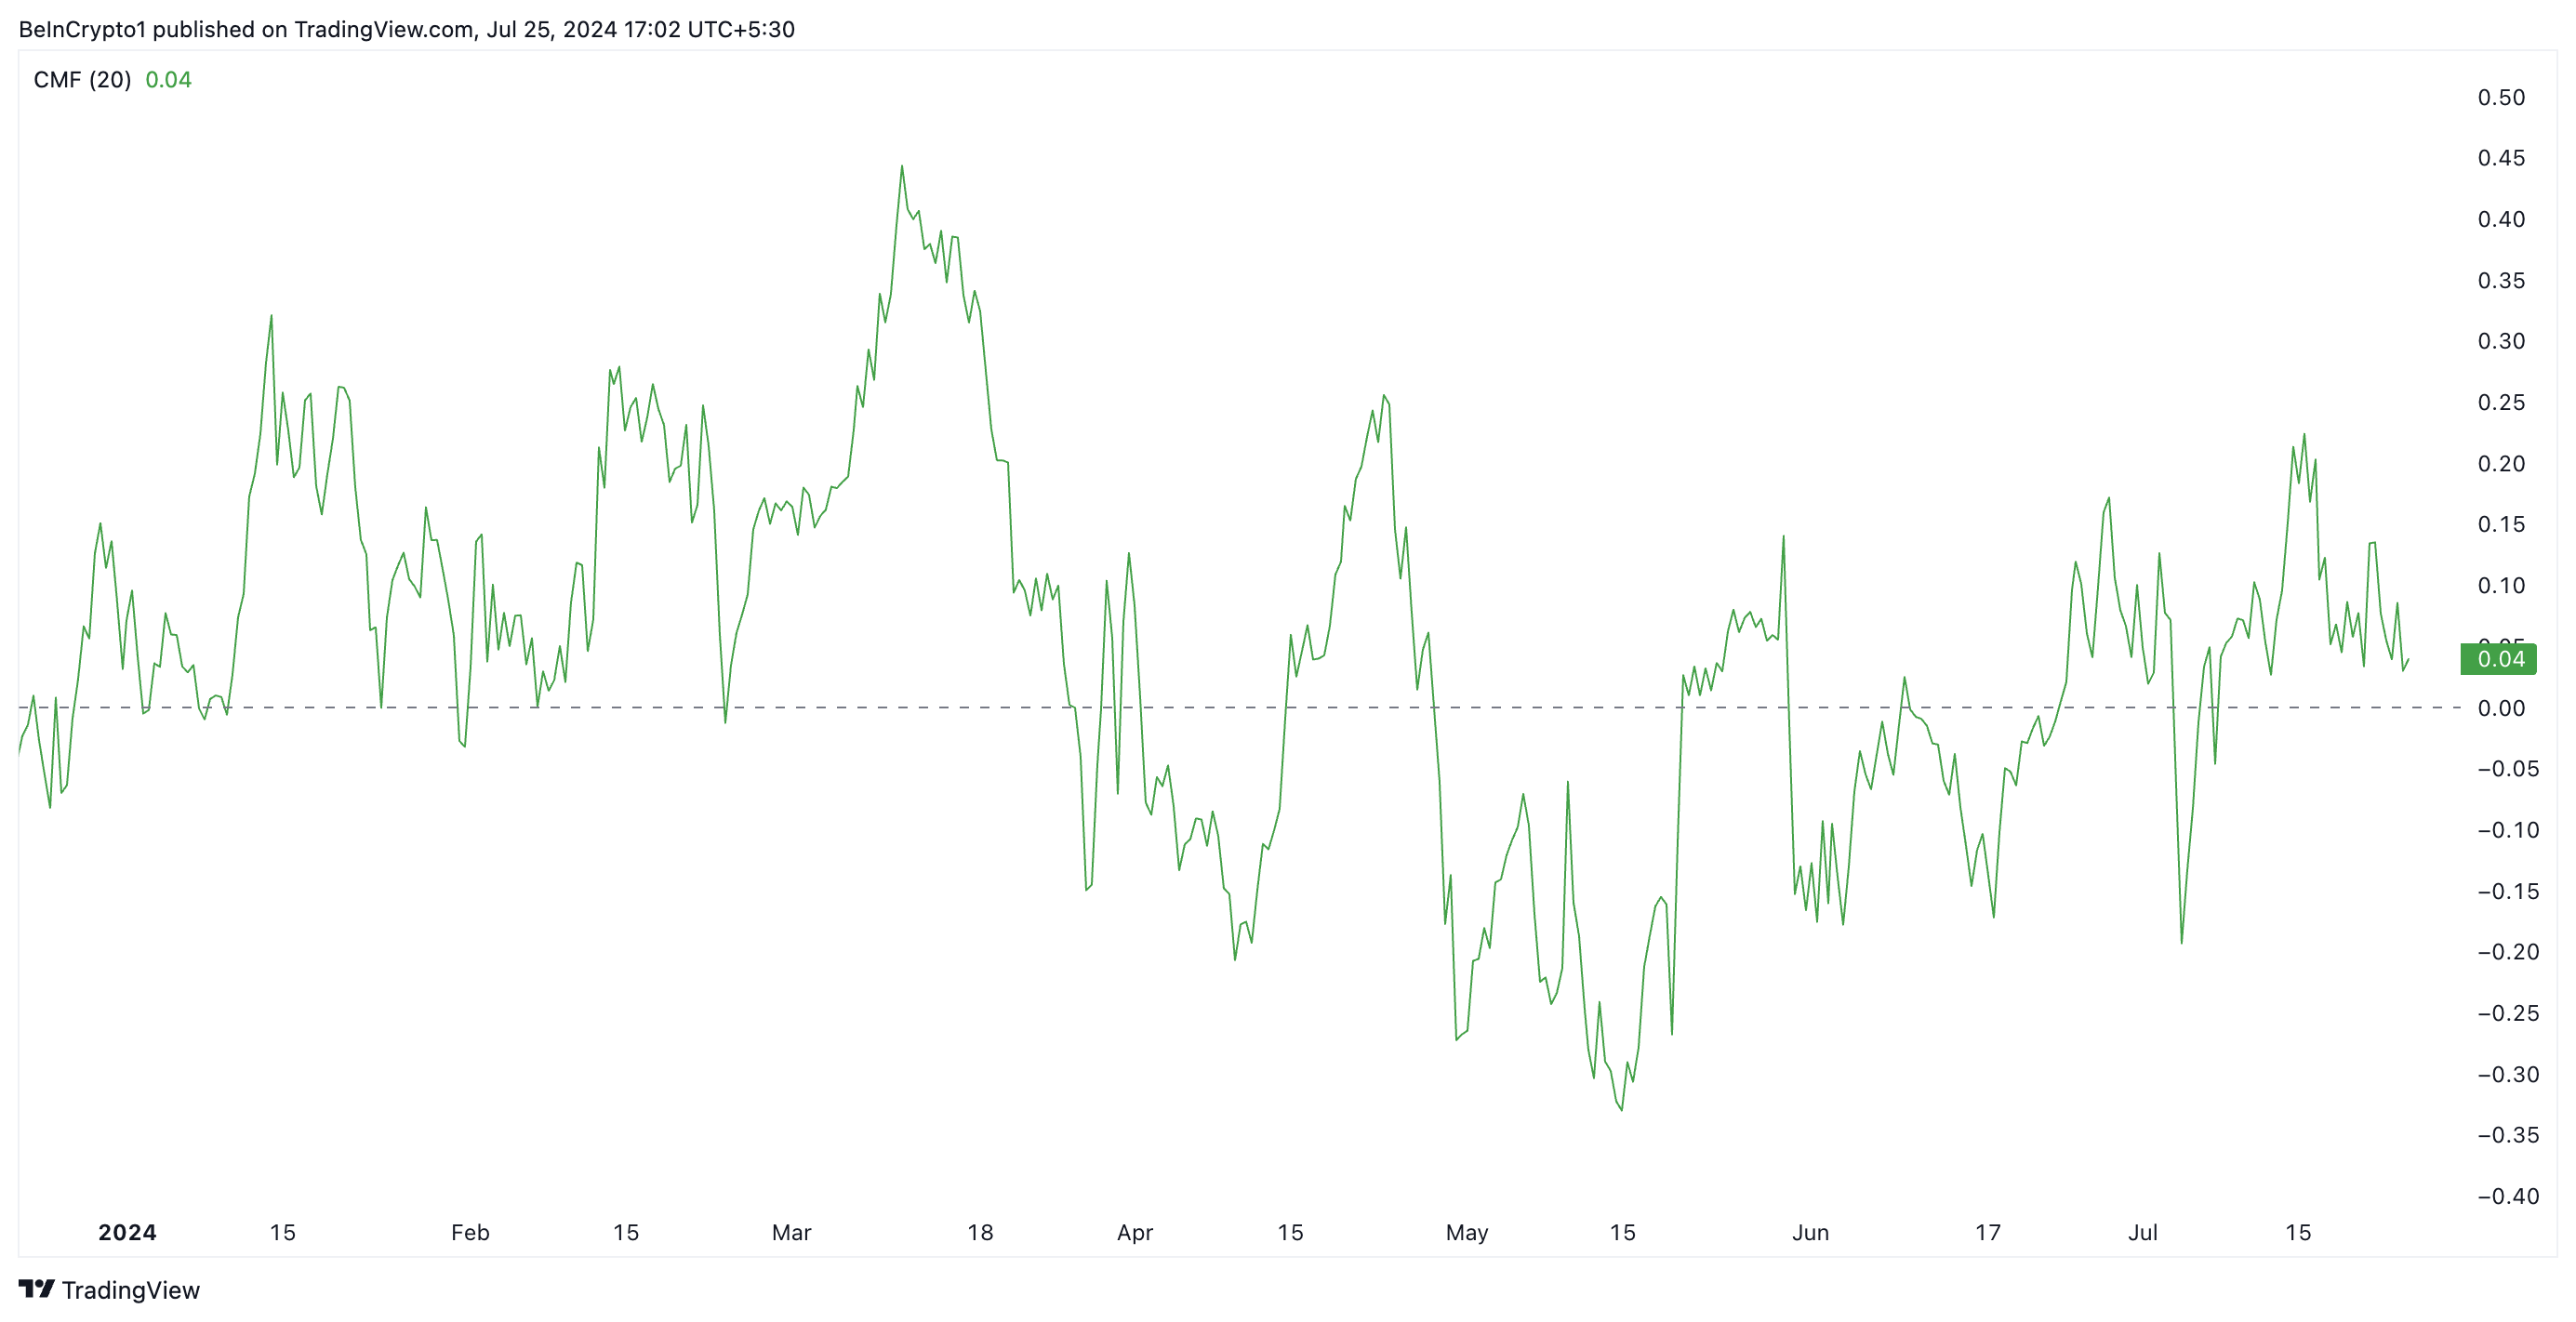
At press time, the token’s CMF was in a downtrend at 0.04.
PYTH Price Prediction: The 50-day Small Moving Average is a Critical Level
If PYTH’s price breaches its 50-day SMA and trades below it, this would signify a shift towards a longer-term bearish trend, which may cause the token’s price to fall $0.25 and below.
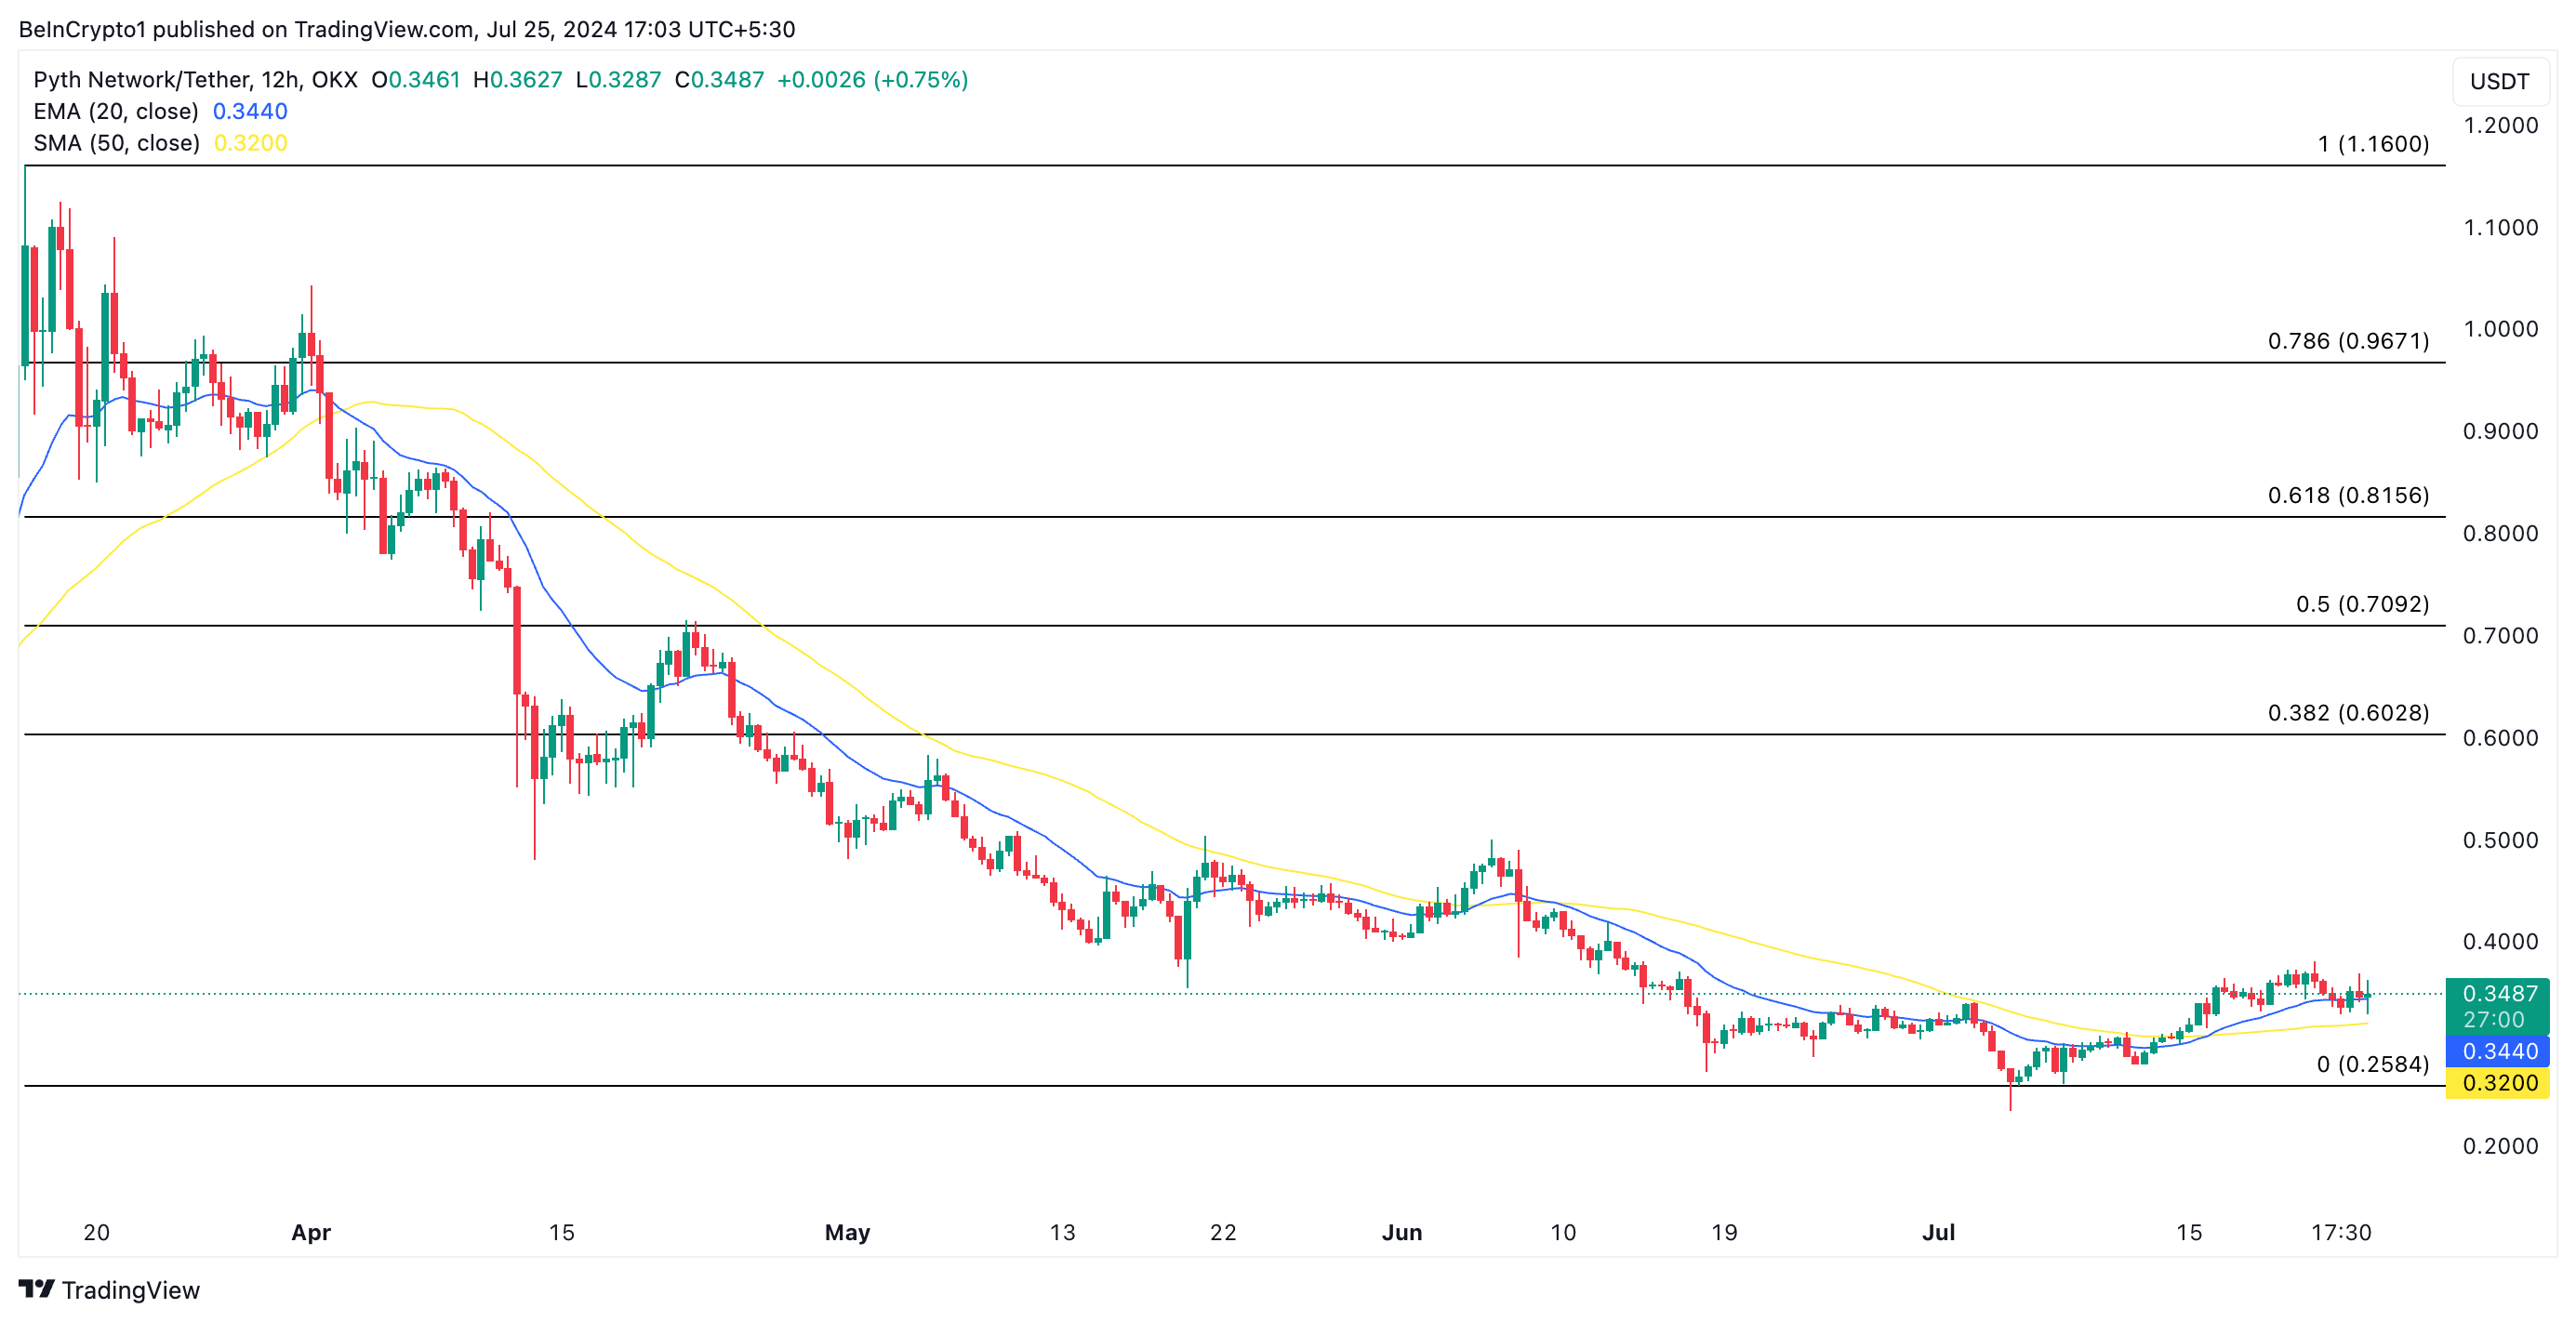
However, if the current trend reverses, PYTH’s value might climb to $0.60.
