


Today’s on-chain analysis highlights the famous Puell Multiple indicator, which has broken out of the oversold area in recent days. Historically, the move was a signal confirming that Bitcoin’s macro bottom had been reached.
Reaching a bottom by Bitcoin’s price does not necessarily mean the immediate start of an uptrend. Looking at the behavior of the Puell Multiple after leaving the oversold area, we see that each time the indicator had to test and validate the area of its breakout. For the BTC price, this meant about a 3-month accumulation.
What is Puell Multiple?
Puell Multiple was created by analyst David Puell. It is one of the indicators of the health of Bitcoin miners. It expresses the ratio between the daily value of Bitcoin issuance (in USD) and the 365-day moving average of the daily value of issuance. This simple relationship provides an elegant tool for assessing market cycles from the perspective of miners’ profitability.
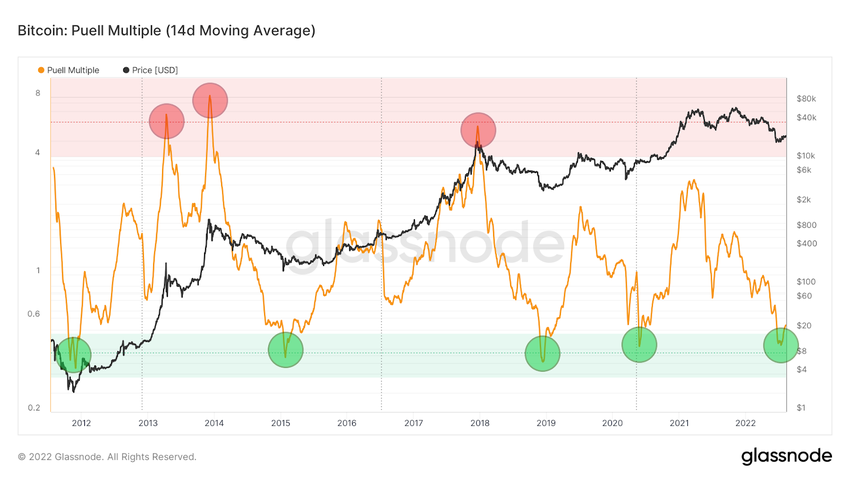
In an on-chain analysis last month, BeInCrypto noted that Puell Multiple has reached an oversold level that has historically corresponded to the macro lows of bear markets (green circles). This area is within the green range of 0.3-0.5.
In contrast, the upper red range of 4-10 was reached during the historical peaks of bull markets (red circles). In the chart below, we use the 14-day Puell Multiple average to reduce the noise and look at the long-term trend.
Current readings and comparison with the COVID-19 crash
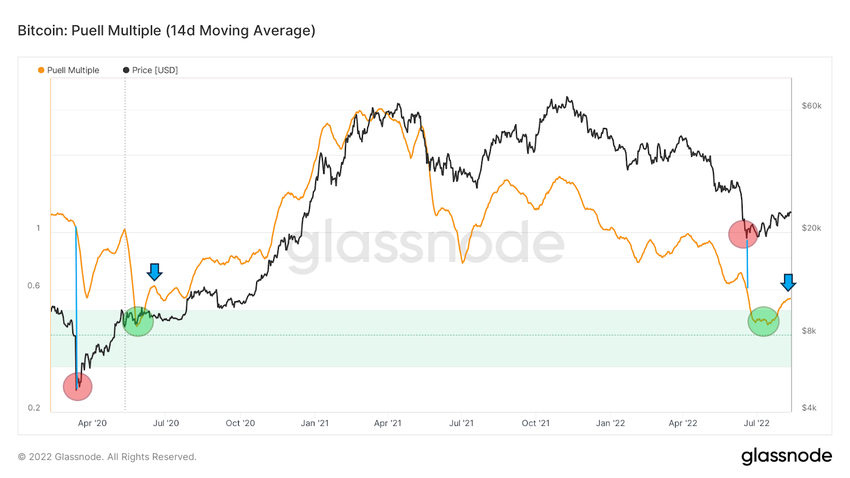
Looking at the current readings, we see that Puell Multiple has just broken out of the green oversold area (blue arrow). Of course, the breakout from the oversold area was made possible by the rise in the BTC price, which is today about 36% above its June 18 bottom at $17,622.
It is interesting to compare the current movement of the Puell Multiple with the previous situation when the indicator left the green area. This occurred during the COVID-19 crash in March-June 2020, when Bitcoin reached a macro bottom at $3782 (red circle).
However, the Puell Multiple did not fall into oversold territory until a few weeks later (green circle). By then, Bitcoin was already in the middle of a V-shaped recovery, rising by about 150% and leading the indicator to break out of the green oversold area. We are seeing a similar pattern today.
Waiting for a retest
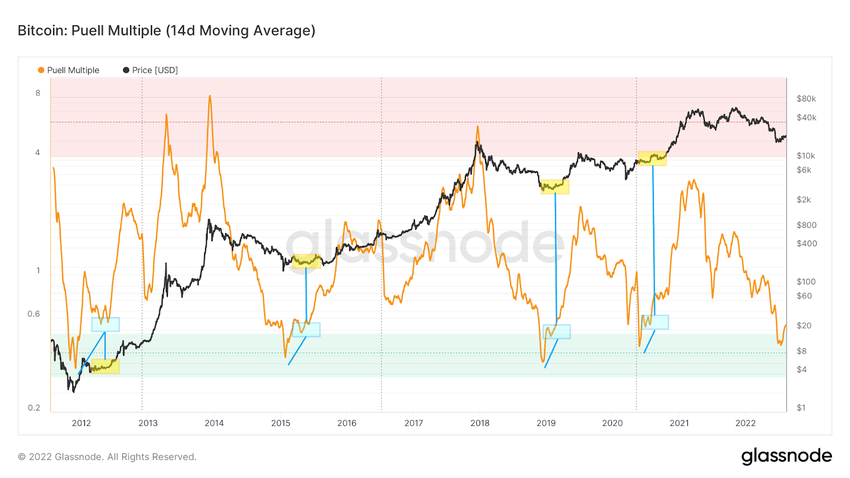
Looking once again at the long-term chart of the Puell Multiple, we see a certain correlation between a breakout from the green area and the price of BTC. First of all, every time after a breakout, the indicator seems to return to confirm the oversold area (blue rectangle). It doesn’t always do it exactly and touch the green area, but the corrective movement after the first upward phase is clear.
Then, after confirming the oversold area as support, the Puell Multiple continues its upward movement. Interestingly, the rise of the indicator in the first weeks is not correlated with the rise of the BTC price. During this period, Bitcoin always undergoes a roughly 3-month accumulation phase, which begins a few weeks after the macro bottom is generated (yellow rectangle).
If a similar situation were to repeat now, the start of an uptrend for BTC could be initiated around October-November 2022. In addition, it would be worth waiting for the aforementioned retest of the Puell Multiple indicator, which would have to hold above the green oversold area. A clear consolidation of the indicator and the BTC price would be strong indications for the thesis that BTC reached a macro bottom in June.
For Be[in]Crypto’s latest Bitcoin (BTC) analysis, click here.


