


For the first time in 2023 and the first time in 5 months, a blue signal to buy Bitcoin from the Hash Ribbons indicator has flashed. Historically, this signal has high efficiency and is directly related to the health of the Bitcoin network as well as the activity of miners.
Despite this, the Hash Ribbons buy signal is not infallible. Until late 2021, it seemed almost impossible to lose when buying Bitcoin after this signal fired. Not only did the price seem to always rise after this signal, but BTC was also supposed to never again drop below the low that immediately preceded this signal.
However, as we will see in the analysis below, the 2022 bear market shattered this myth as well. It turned out that the previous year’s declines led the price to levels below the lows correlated with the blue signal from Hash Ribbons on two occasions.
Yesterday, the buy signal flashed again. Will it work this time, as it has usually worked in the past, and will BTC never again drop below the bottom at $15,479 set on November 21, 2022?
Bitcoin Network Hash Rate Reaches New Peaks
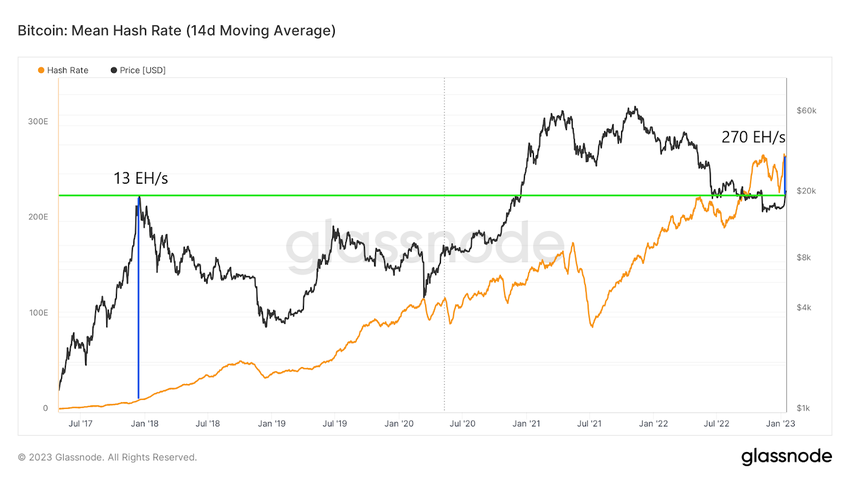
The Hash Ribbons indicator is based on the hash rate, which is a fundamental indicator of the performance of the Bitcoin network. Hash rate represents the amount of computing power that all BTC miners are currently generating.
Interestingly, despite the huge declines in the price of BTC and the fact that as recently as November it was 77% below its all-time high (ATH), the network’s computing power has been growing for most of 2022. A huge increase of the hash rate was observed in the first two weeks of 2023.
As a result, the indicator’s 14-day moving average has just recorded a new all-time high (270 EH/s), despite the fact that the BTC price is currently at levels of the 2017 bull market peak (13 EH/s). The current computing power of the Bitcoin network today is more than 20x greater than five years ago. The price of Bitcoin is almost identical: around $20,000.
What is Hash Ribbons?
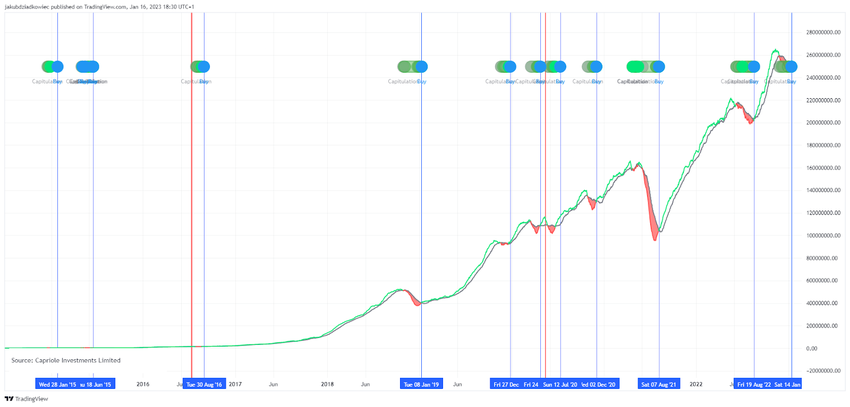
Hash Ribbons are based on the relationship between the two moving averages (SMAs) of the hash rate indicator: the 30-day SMA and the 60-day SMA. In addition, the indicator refers to the 10-day and 20-day moving averages of the BTC price. In a nutshell, the generation of a blue buy signal proceeds in 3 stages:
- Miners capitulation: 30D SMA falls below 60D SMA, and the Hash Ribbons chart turns red.
- End of capitulation: 30D SMA rises above 60D SMA, the green dot lights up, and the Hash Ribbons chart becomes green.
- Recovery of BTC price momentum: 10D SMA of Bitcoin price rises above 20D SMA, blue dot lights up with a signal to buy.
In the chart below, we see all the instances when the Hash Ribbons buy signal has flashed since 2015. It is worth adding that before 2015, the signal flashed a few times, but the returns were so huge that we do not include them in this analysis.
Historical Returns After Hash Ribbons Signal
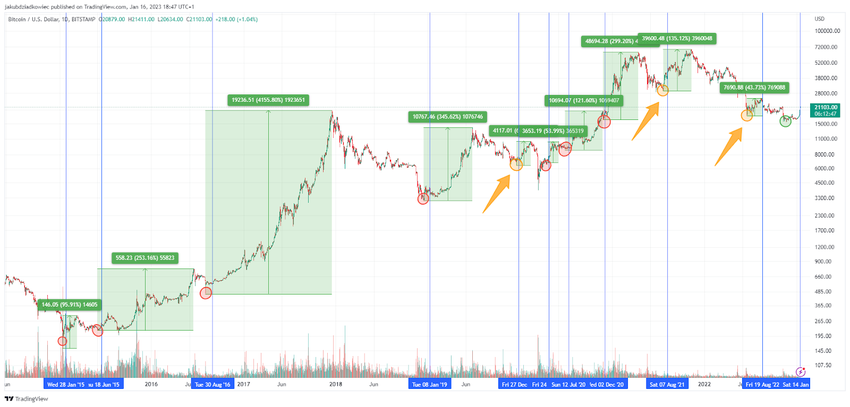
One interpretation of the buy signal from Hash Ribbons is that the Bitcoin price bottom is generated immediately before the signal is a macro market bottom. In other words, the BTC price should no longer drop below the lows seen before the signal.
This interpretation – although mostly accurate – has already been falsified 3 times in the last few years (orange arrows). This happened for the signals of December 2019, and August 2021, and the previous signal of August 2022. In each of these cases, the BTC price declined (twice in 2022) below previous lows.
However, in the remaining 7 out of 10 historical cases, the buy signal from Hash Ribbons was indeed an indicator of the macro bottom of the Bitcoin price (red circles). Moreover, even in the 3 cases where this did not happen, the BTC price initially surged.
Thus, if one wanted to calculate all the increases from the 10 previous signals and then average them, the result is 557%. That’s how much Bitcoin increased on average from the bottom preceding the signal from Hash Ribbons to the top of the bull market or the next signal. If BTC were to currently increase by 557%, measured from the bottom at $15,479 (green circle), it would cost $101,697 at the peak of the upcoming bull market.
Has Bitcoin Reached a Macro Bottom Yet?
On January 14, 2023, the buy signal from Hash Ribbons flashed again. If the historical performance of the indicator is sustained this time, it could provide further confirmation that the macro bottom of the BTC price has already been reached. In this case, it would be the $15,479 level (green line).
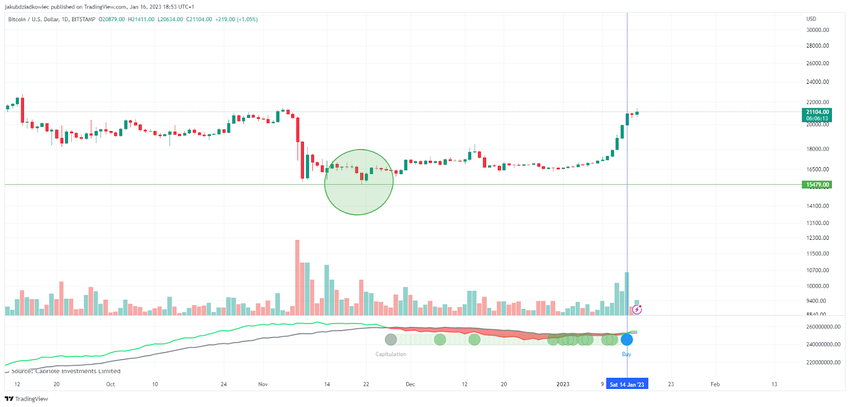
Hash Ribbons indicator creator @caprioleio tweeted yesterday that “a price low typically forms during the capitulation and before we see hash rate recover.” If so, then, as in many historical cases, the capitulation of Bitcoin miners would correlate with a macro bottom in the BTC price.
On the other hand, the brutal bear market of 2022 showed that no single indicator can be blindly trusted. Both on-chain analysis, technical indicators, and price action in the previous year have debunked many of the myths surrounding Bitcoin and the cryptocurrency market.
Will Hash Ribbon regain its reputation or remain just a historical curiosity? The next few months will provide the answer.
For BeInCrypto’s latest crypto market analysis, click here.


