


Ethereum’s price rally in May reignited investor interest in ETH-backed exchange-traded funds (ETFs). During the 31-day period, capital inflows into these investmemt products exceeded $550 million, marking the highest monthly netflow into ETH ETFs since the year began.
While the coin’s price has witnessed a pullback over the past week, technical indicators hint at a possible near-term rebound.
ETH ETFs Log Highest Monthly Inflows of 2025
According to data from SosoValue, ETH spot ETFs recorded a combined inflow of $564.18 million in May, surpassing all previous monthly totals this year.
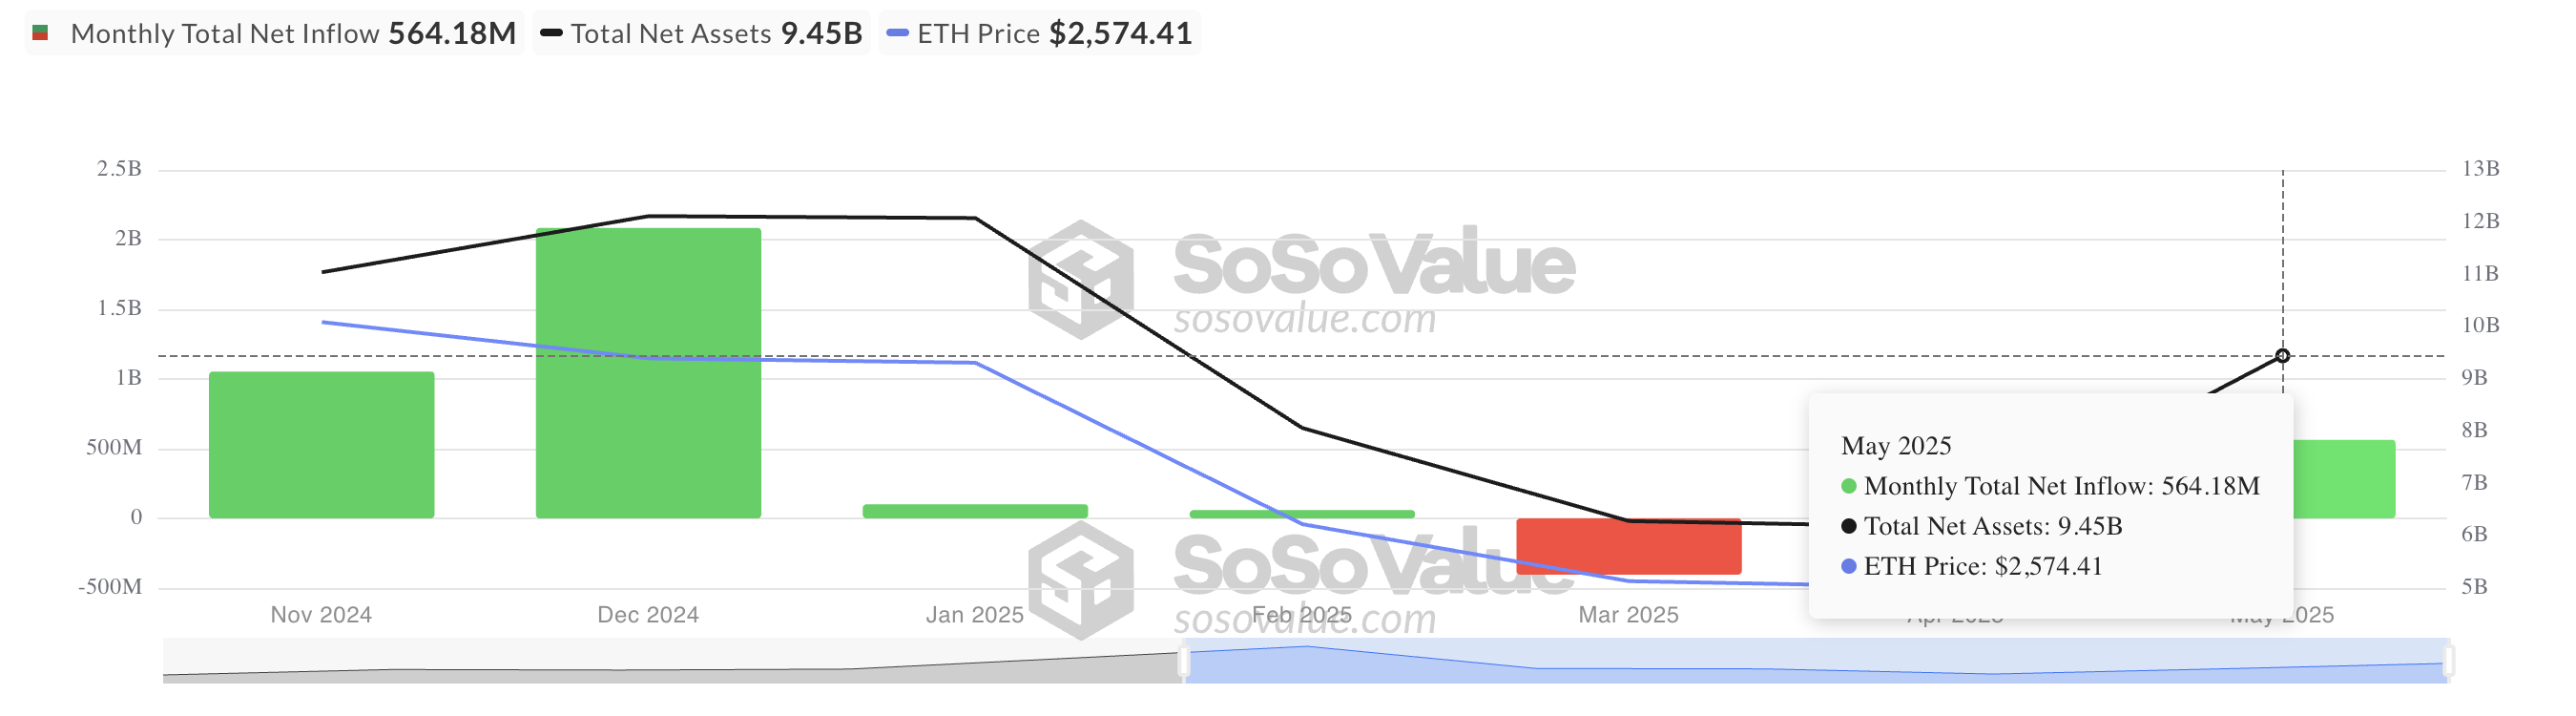
The influx of capital was largely driven by ETH’s strong performance, with the leading altcoin breaking above the critical $2,000 level and attempting to consolidate gains above $2,500 during the month. This renewed bullish sentiment encouraged institutional investors to increase their exposure through spot ETFs and position ahead of a sustained rally in the coin’s price.
Ethereum Prepares for Next Leg Up
Readings from the daily chart show that ETH witnessed a 49% surge between May 8 and May 13, before settling into a consolidation phase that has now formed a bullish pennant pattern.
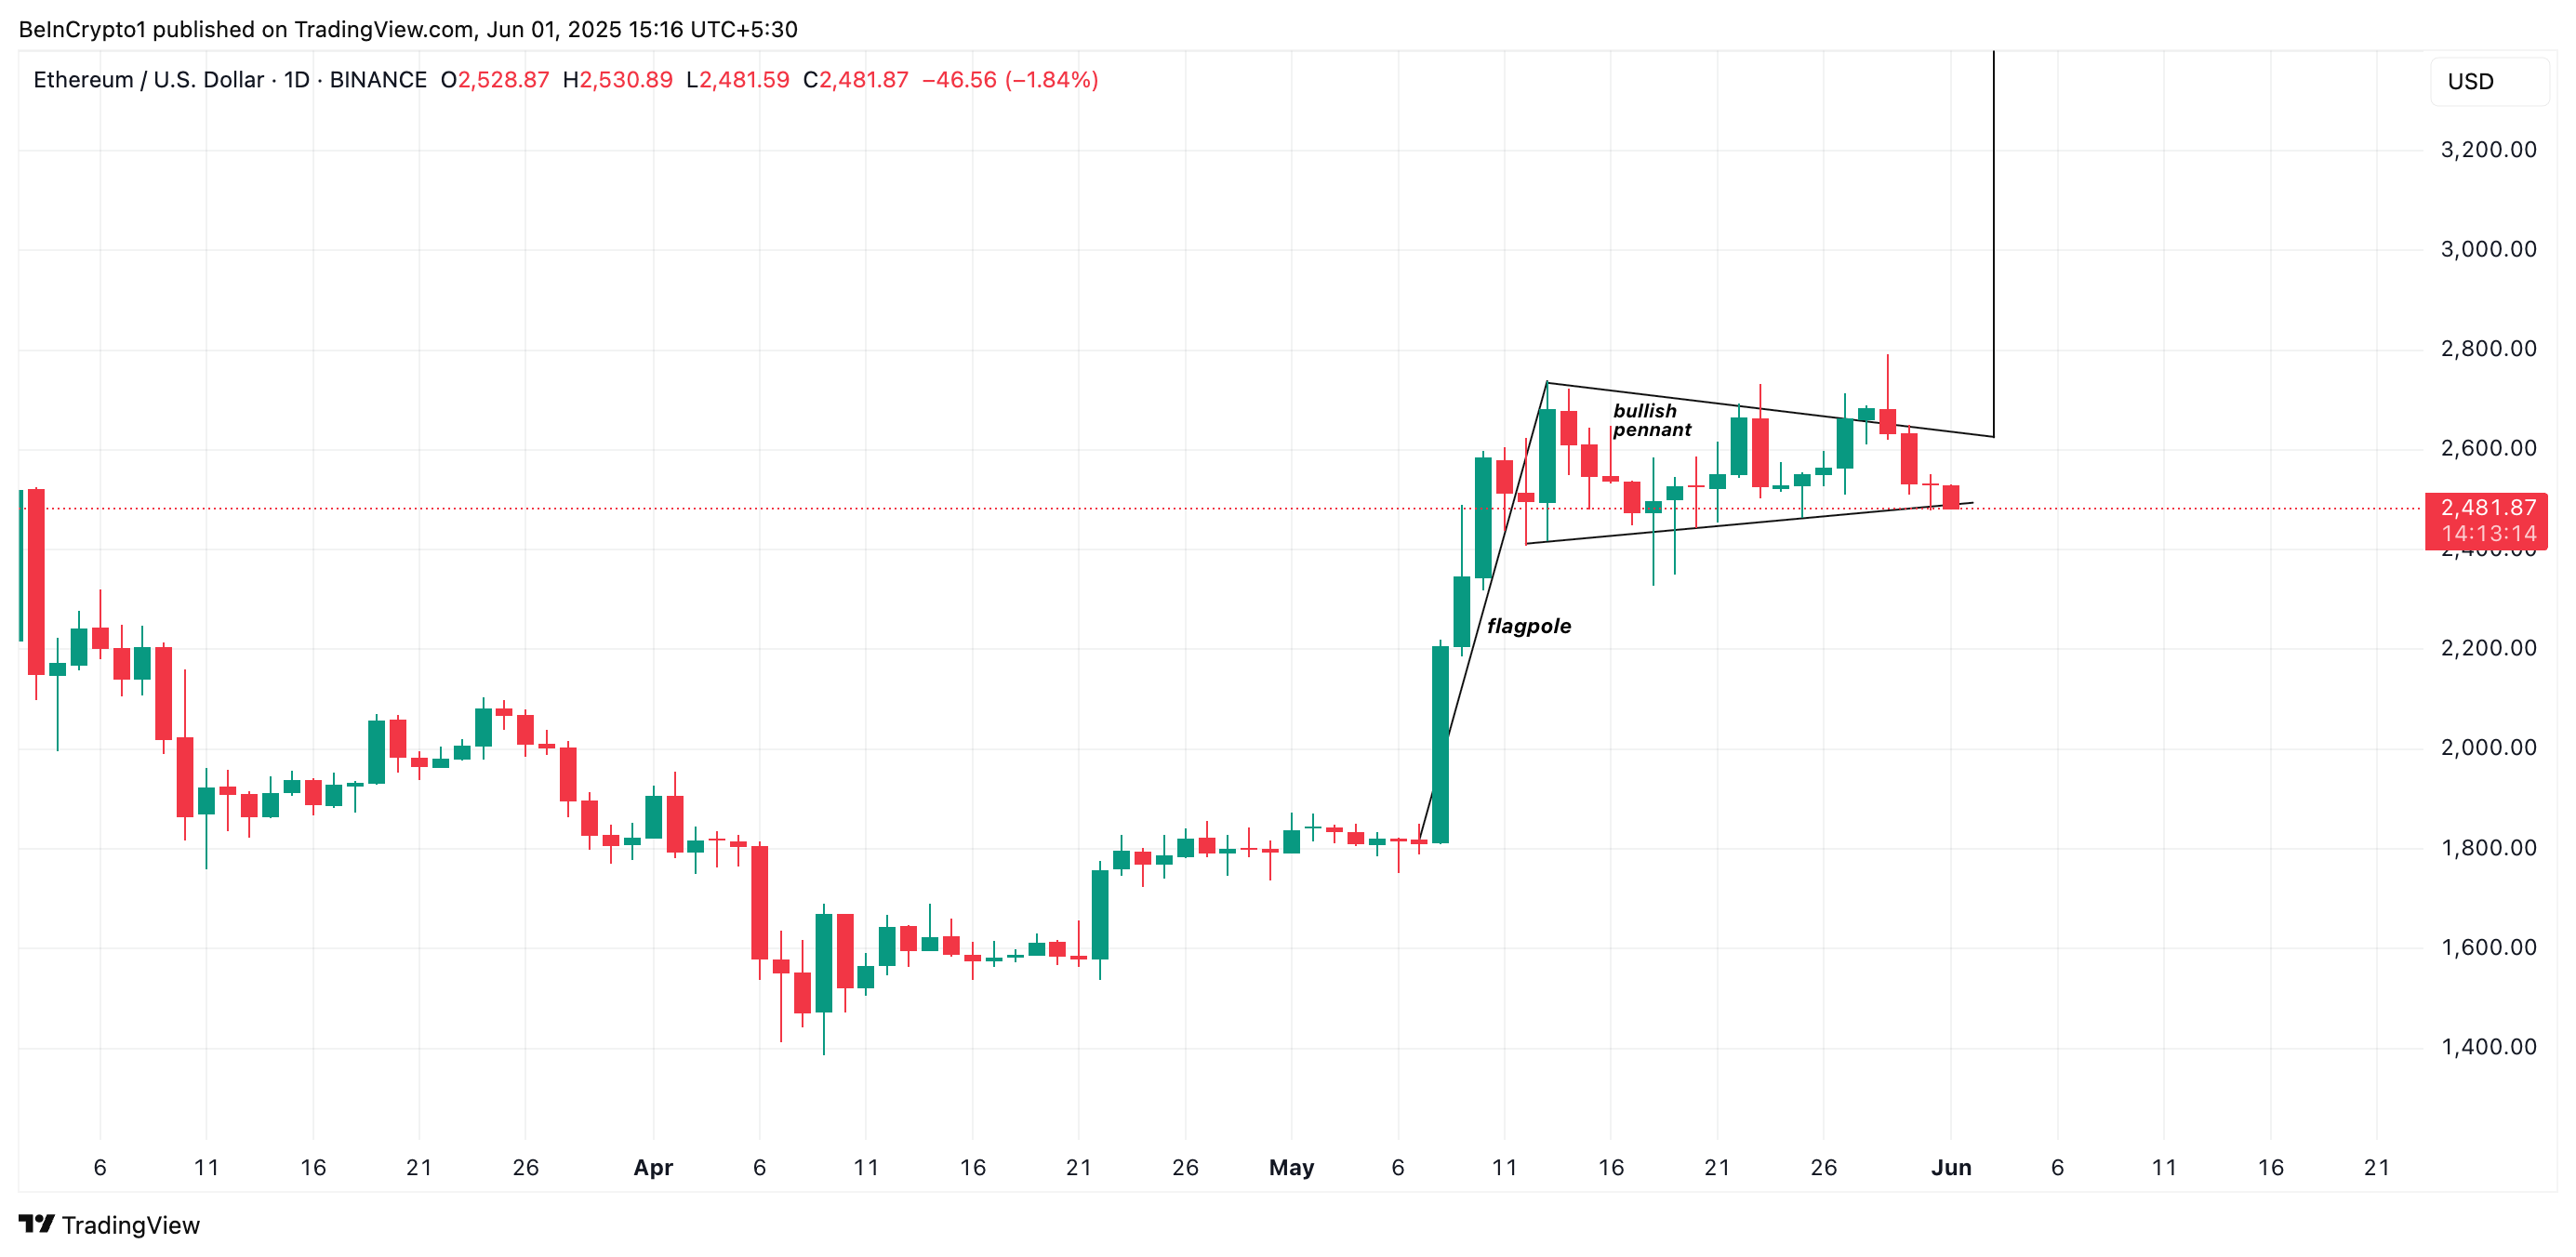
A bullish pennant pattern is formed when a strong upward price movement (flagpole) is followed by a period of consolidation that resembles a small symmetrical triangle (the pennant). This pattern suggests that buyers are temporarily pausing before continuing the uptrend.
If ETH breaks out of the pennant to the upside, it could trigger a renewed rally that mirrors the initial 49% surge. Such a breakout would confirm continued bullish momentum and attract additional capital inflows.
Moreover, the coin’s funding rate continues to print values above zero, indicating a preference for long positions even amid the ongoing consolidation phase. As of this writing, ETH’s funding rate stands at 0.0046%.
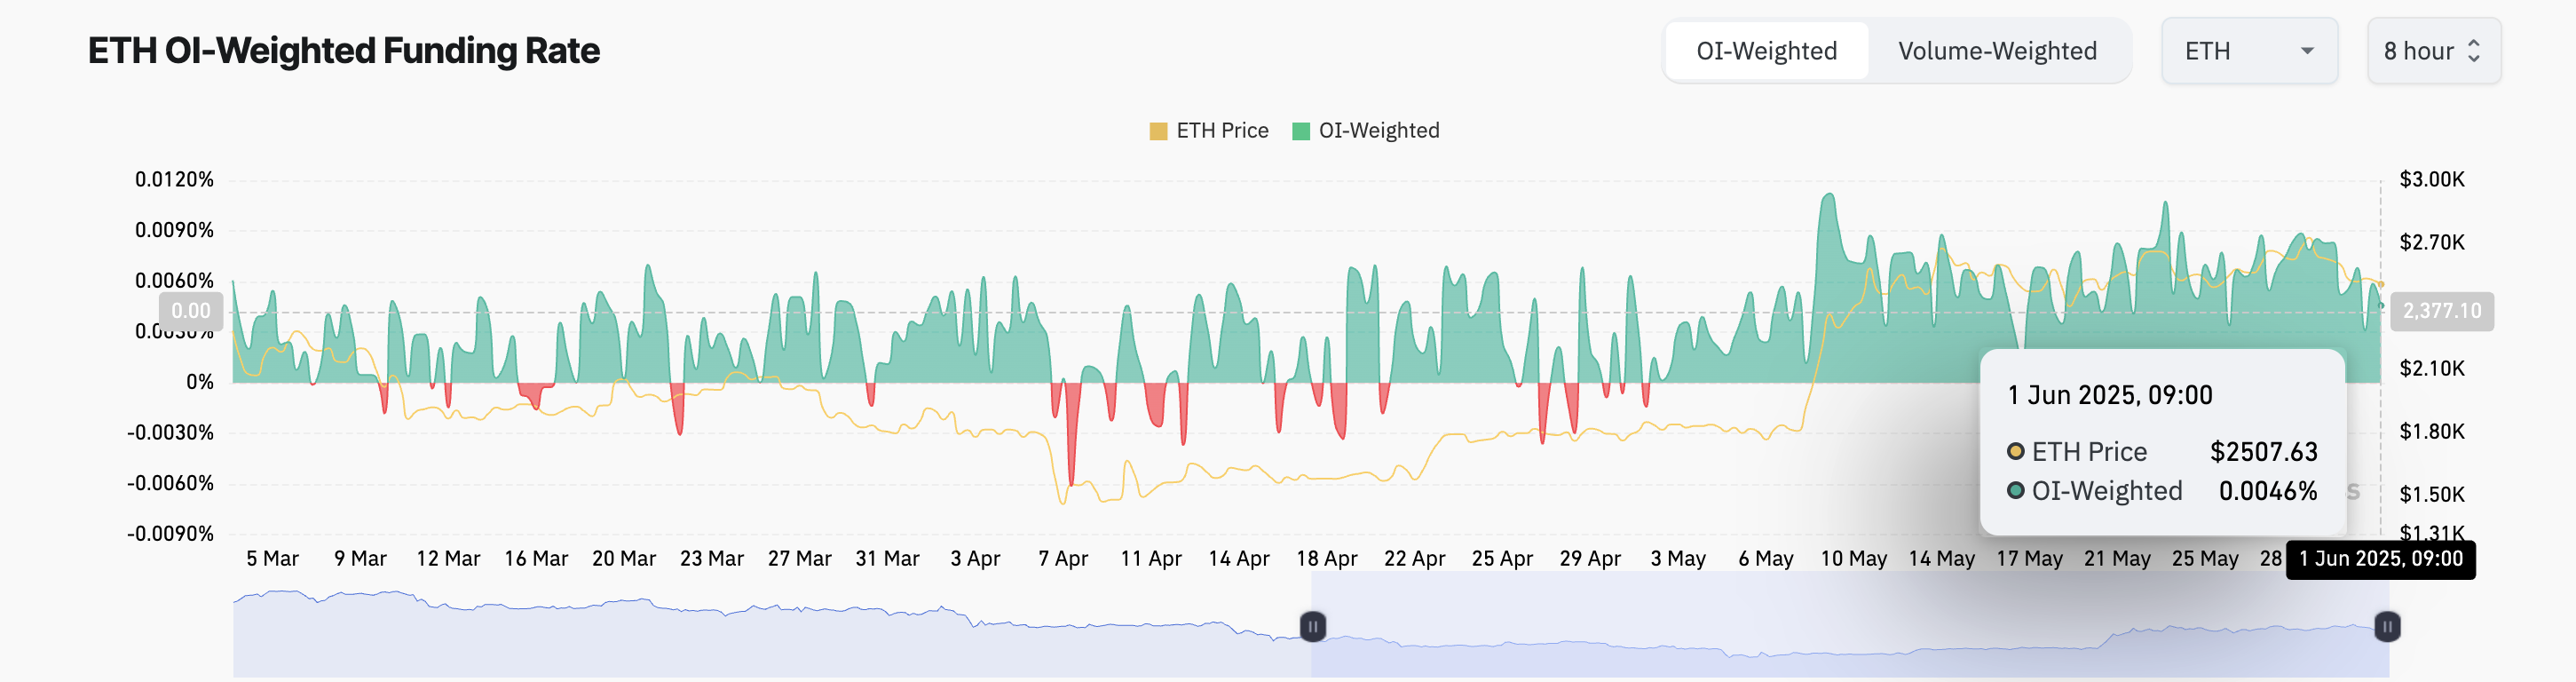
A positive funding rate like this means that long-position holders are paying short-position holders, indicating bullish sentiment and that more traders are betting on price increases.
Ethereum’s Next Move: Can Bulls Push ETH 49% Higher From Here?
ETH currently trades at $2,489, sitting above the lower line of its pennant, which forms support at $2,479. If a bullish breakout occurs, ETH’s price could rally by the flagpole’s length (49%) to trade at $3,907.
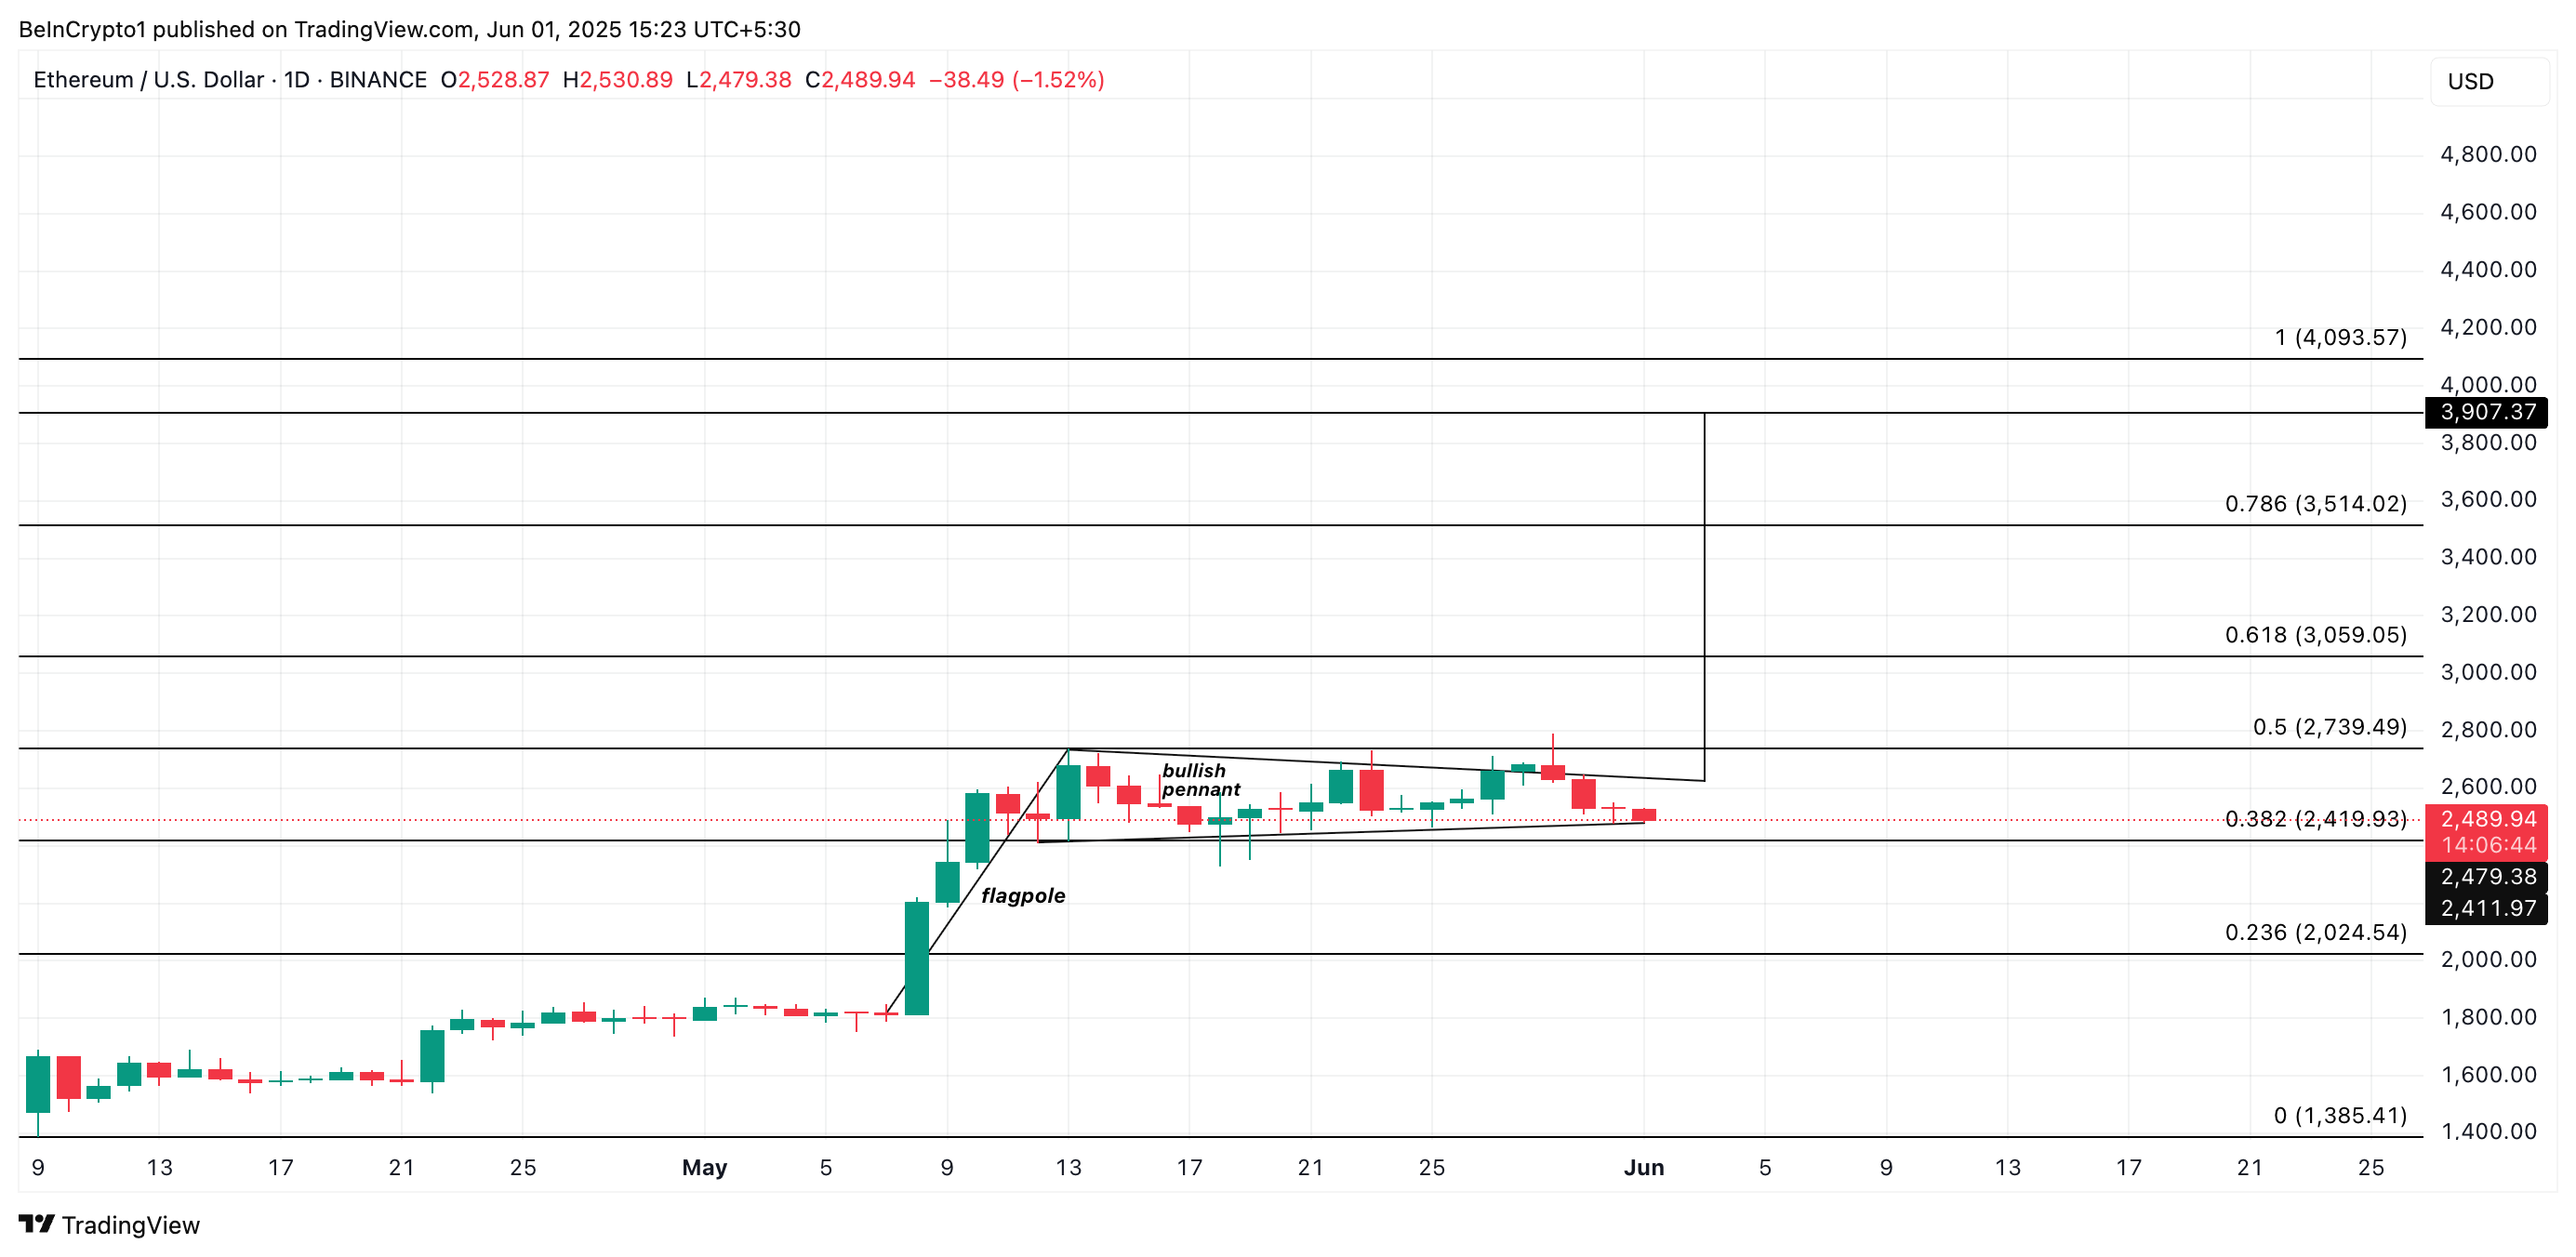
However, if selloffs resume, the coin’s price could break below the pennant and trade at $2,419.



