


One of the first remarkable facts a crypto newbie learns is Bitcoin’s long-term chart shape. The systematically rising logarithmic curve is evidence of the explosion in BTC’s price over the past 15 years.
Bitcoin’s impressive performance prompted Willy Woo to juxtapose the oldest cryptocurrency with today’s largest asset classes. Comparing the annual performance of all major assets, it turns out that in 3 out of 4 years, Bitcoin outperforms all its competitors. However, 1 in 4 years, it regularly finds itself at the bottom of the pile, recording huge losses.
Bitcoin Outperforms All Asset Classes – 3 out of 4 Years
In a recent chart on X, Willy Woo compares the annual performance of the largest asset classes against Bitcoin. These include gold, the S&P 500 Total Return Index (SPX), the S&P U.S. Aggregate Bond Indes (AGG), the U.S. High Yield Corporate Bond Index (HY), the Dow Jones Emerging Markets Total Return Index (EM), and the Dow Jones Commodity Index (CMT).
Willy Woo compiles results from the last 11 years: from 2013 to 2023. During this time, the cryptocurrency market has gone through almost three 4-year cycles and experienced 3 bear markets. The annual declines periodically cause BTC to fall to the bottom of the global asset ranking, recording drops ranging from -58% to -73% per year.
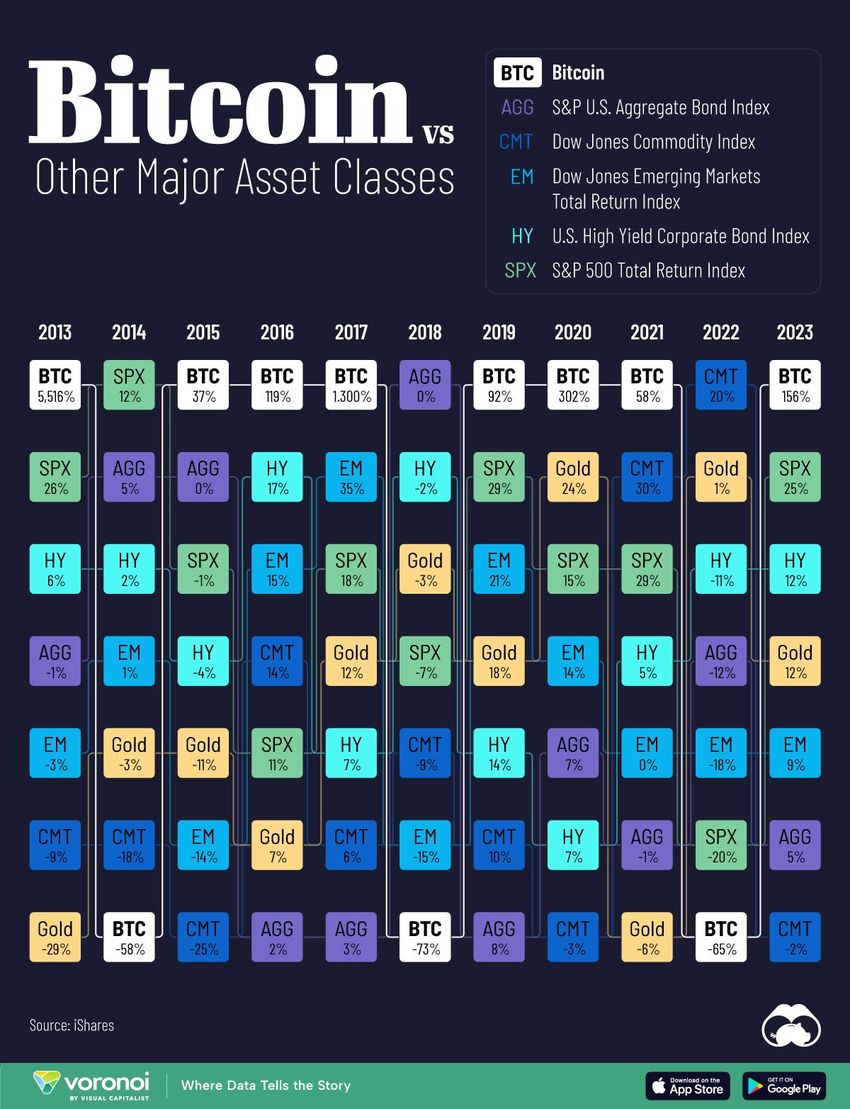
However, apart from those bearish years (2014, 2018, and 2022), when it is better to stay away from the cryptocurrency market, Bitcoin is the clear leader of the pack. On an annual basis, in bullish years, BTC generated profits ranging from 37% (2015) to as much as 5516% (2013).
The Dow Jones Emerging Markets Total Return Index (EM) boasted the largest gain of 35% over the 11 years analyzed. In a commentary on his compilation, Willy Woo adds an ironic remark in relation to the recently launched Bitcoin ETF by Blackrock:
“Blackrock will actually tell you this, now that they have a product to offer you.”
Gold Is Bleeding Against BTC
For confirmation of Bitcoin’s dominance, highlighted today by Willy Woo, one can look at the long-term charts of gold and SPX against BTC. In the former, we compare the return on $1 investment when Bitcoin received its first market price in 2009.
If BTC were bought for $1 some 14.5 years ago and not sold it until today, the investment would amount to $38.5 million today. By contrast, investing the same $1 in gold at the time would return $1.94.
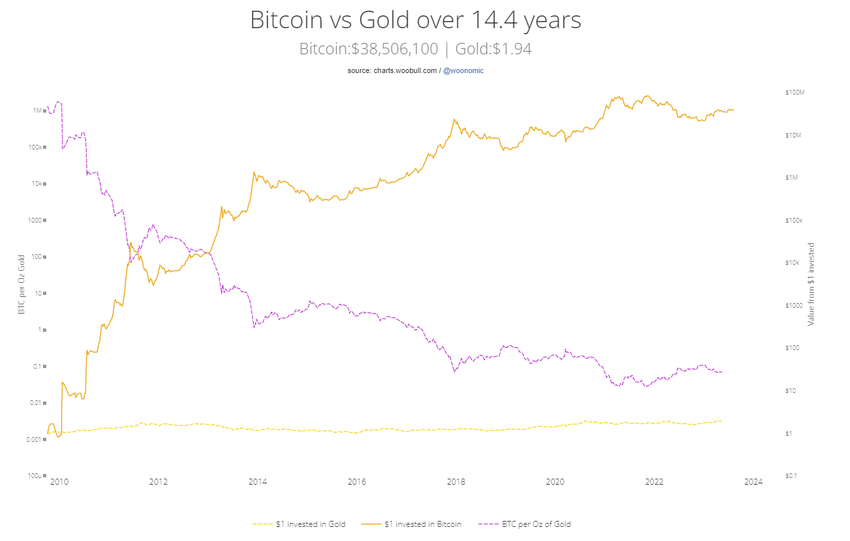
Therefore, we can see how the gold value chart against BTC (pink) has steadily declined, recording lower and lower peaks and lows.
What’s more, profits from investing in BTC could be made not only by buying the oldest cryptocurrency when it entered the market, but at almost any time. This is how Willy Woo compares buying BTC at any time for $1 against buying gold for the same amount:
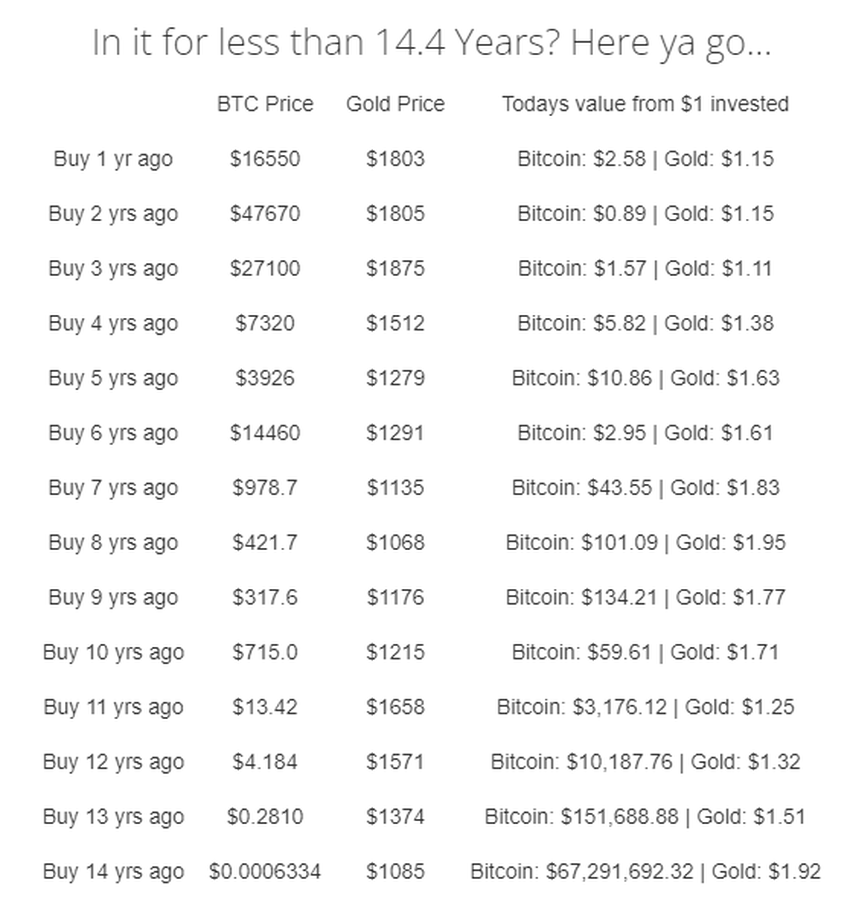
Clearly, Willy Woo refers to Peter Schiff, who has been promoting gold by criticizing Bitcoin for years. That is why the analyst includes this comment under the chart:
“I humbly dedicate this chart to @PeterSchiff to honour his tireless promotion of Bitcoin to his audience. We are eternally grateful to him,” Peter Schiff said.
BTC Volatility Beats S&P 500
However, gold – widely regarded as a safe haven – is not the only global asset that looks extremely bearish against Bitcoin. The situation is very similar when looking at a chart of a basket of leading US companies’ S&P 500 index (SPX).
Admittedly, unlike gold, the SPX (green line) generates profits year-on-year and is high in Willy Woo’s analysis. However, it definitely bleeds against the long-term chart of BTC (red line).
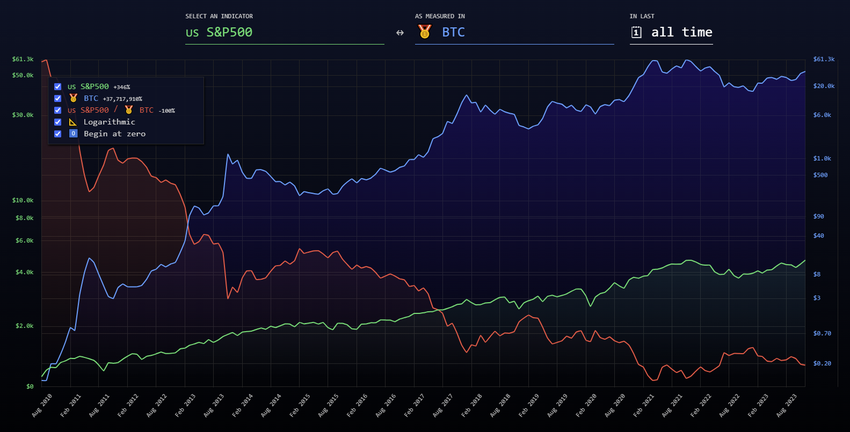
This is why Bitcoin, the cryptocurrency market leader, is the world’s most volatile yet profitable asset. For those able to identify long-term bull and bear markets and 4-year cycles in the crypto market, BTC is a true haven with the potential for large increases during bull market periods.
For BeInCrypto’s latest crypto market analysis, click here.


