


In a previous article, BeInCrypto predicted the Bitcoin price surge to $72,000, supported by our comprehensive analysis of on-chain metrics.
BeInCrypto prediction is validated by the recent price movement, emphasizing the importance of continuous monitoring and analysis of these indicators.
Delving Deeper Into Bitcoin on-Chain Data
By analyzing key indicators such as Hash Ribbons and the 90-day Moving Average of Coin Days Destroyed (CDD), we can gain a deeper understanding of market dynamics.
This continuous monitoring approach is crucial for making informed decisions and highlights the importance of keeping up with expert analyses like those from BeInCrypto.
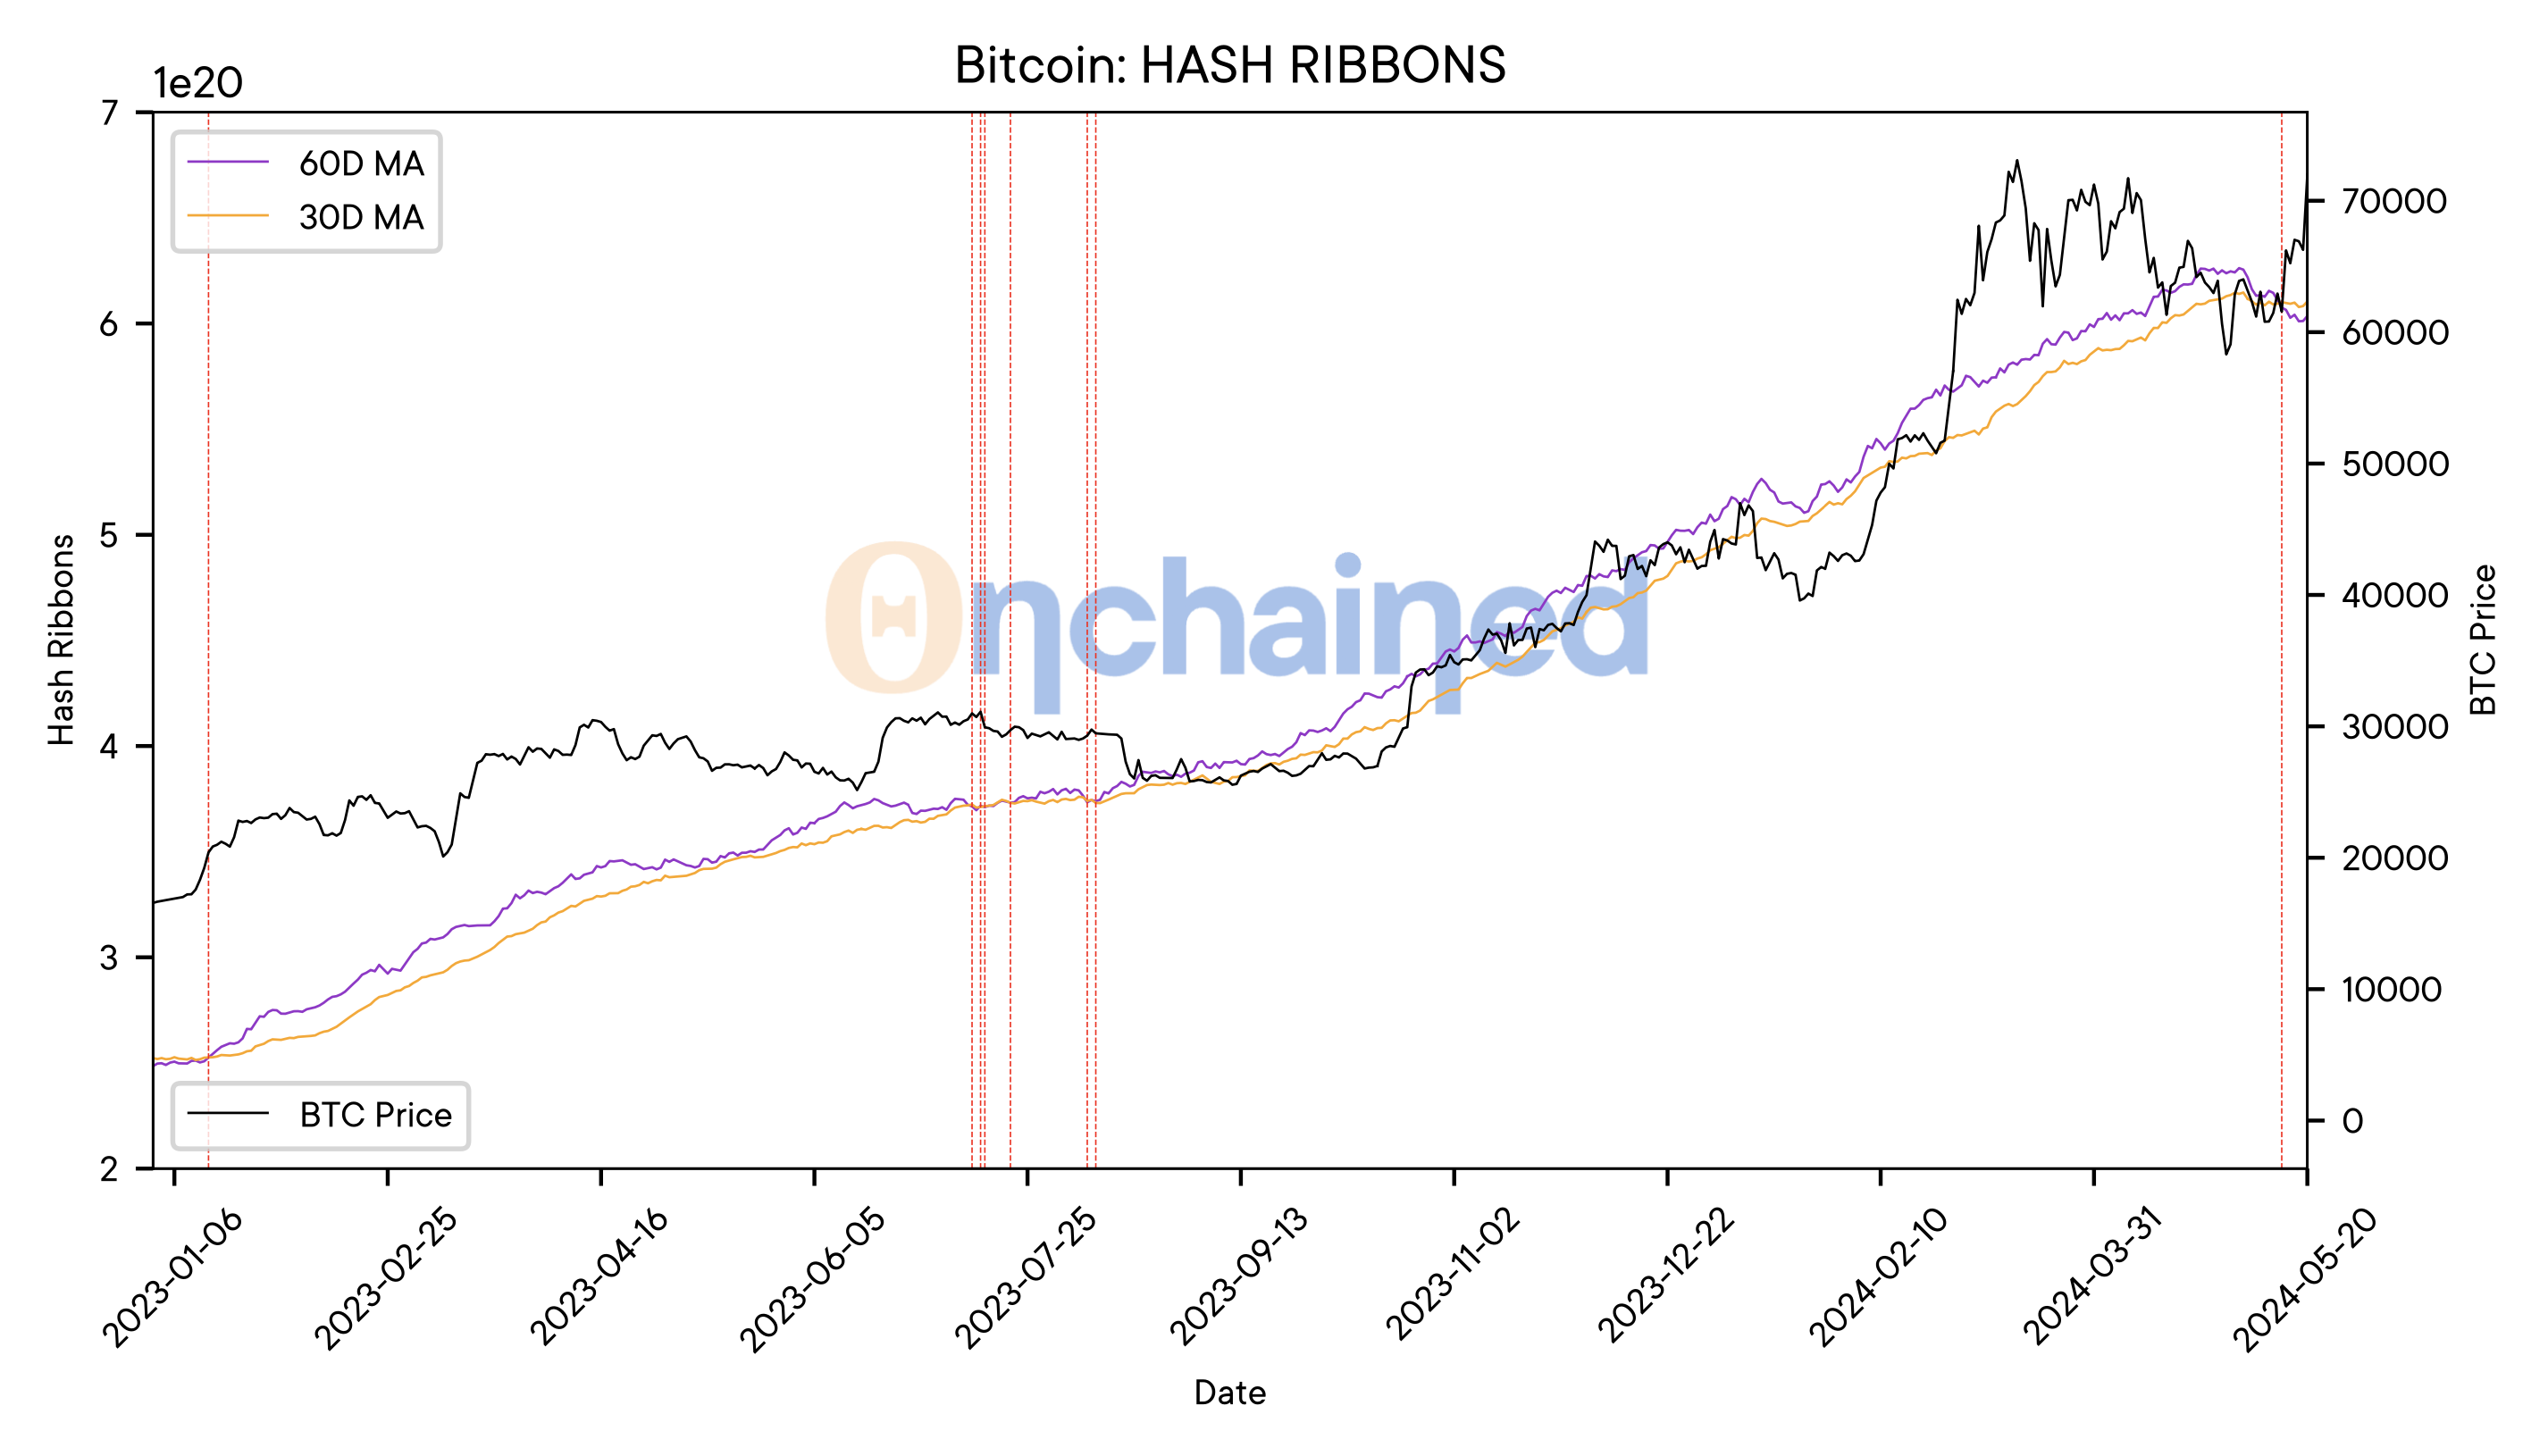
What Are Bitcoin Hash Ribbons?
Hash Ribbons are a powerful metric that identifies when BTC miners are capitulating or giving up and when they are starting to recover. Miners are essential for securing the Bitcoin network by solving complex transaction validation problems.
When mining becomes unprofitable, miners may shut down their machines, causing the network’s hash rate to drop.
The chart highlights periods where the 30-day moving average exceeds the 60-day moving average, indicating miner capitulation. These periods often precede significant price recoveries.
In the early part of 2023, the chart shows a capitulation phase, followed by a recovery where the 30-day average crosses above the 60-day average. This crossover aligns with the recent price surge to $73,000, validating the effectiveness of the Hash Ribbons indicator in predicting market bottoms.
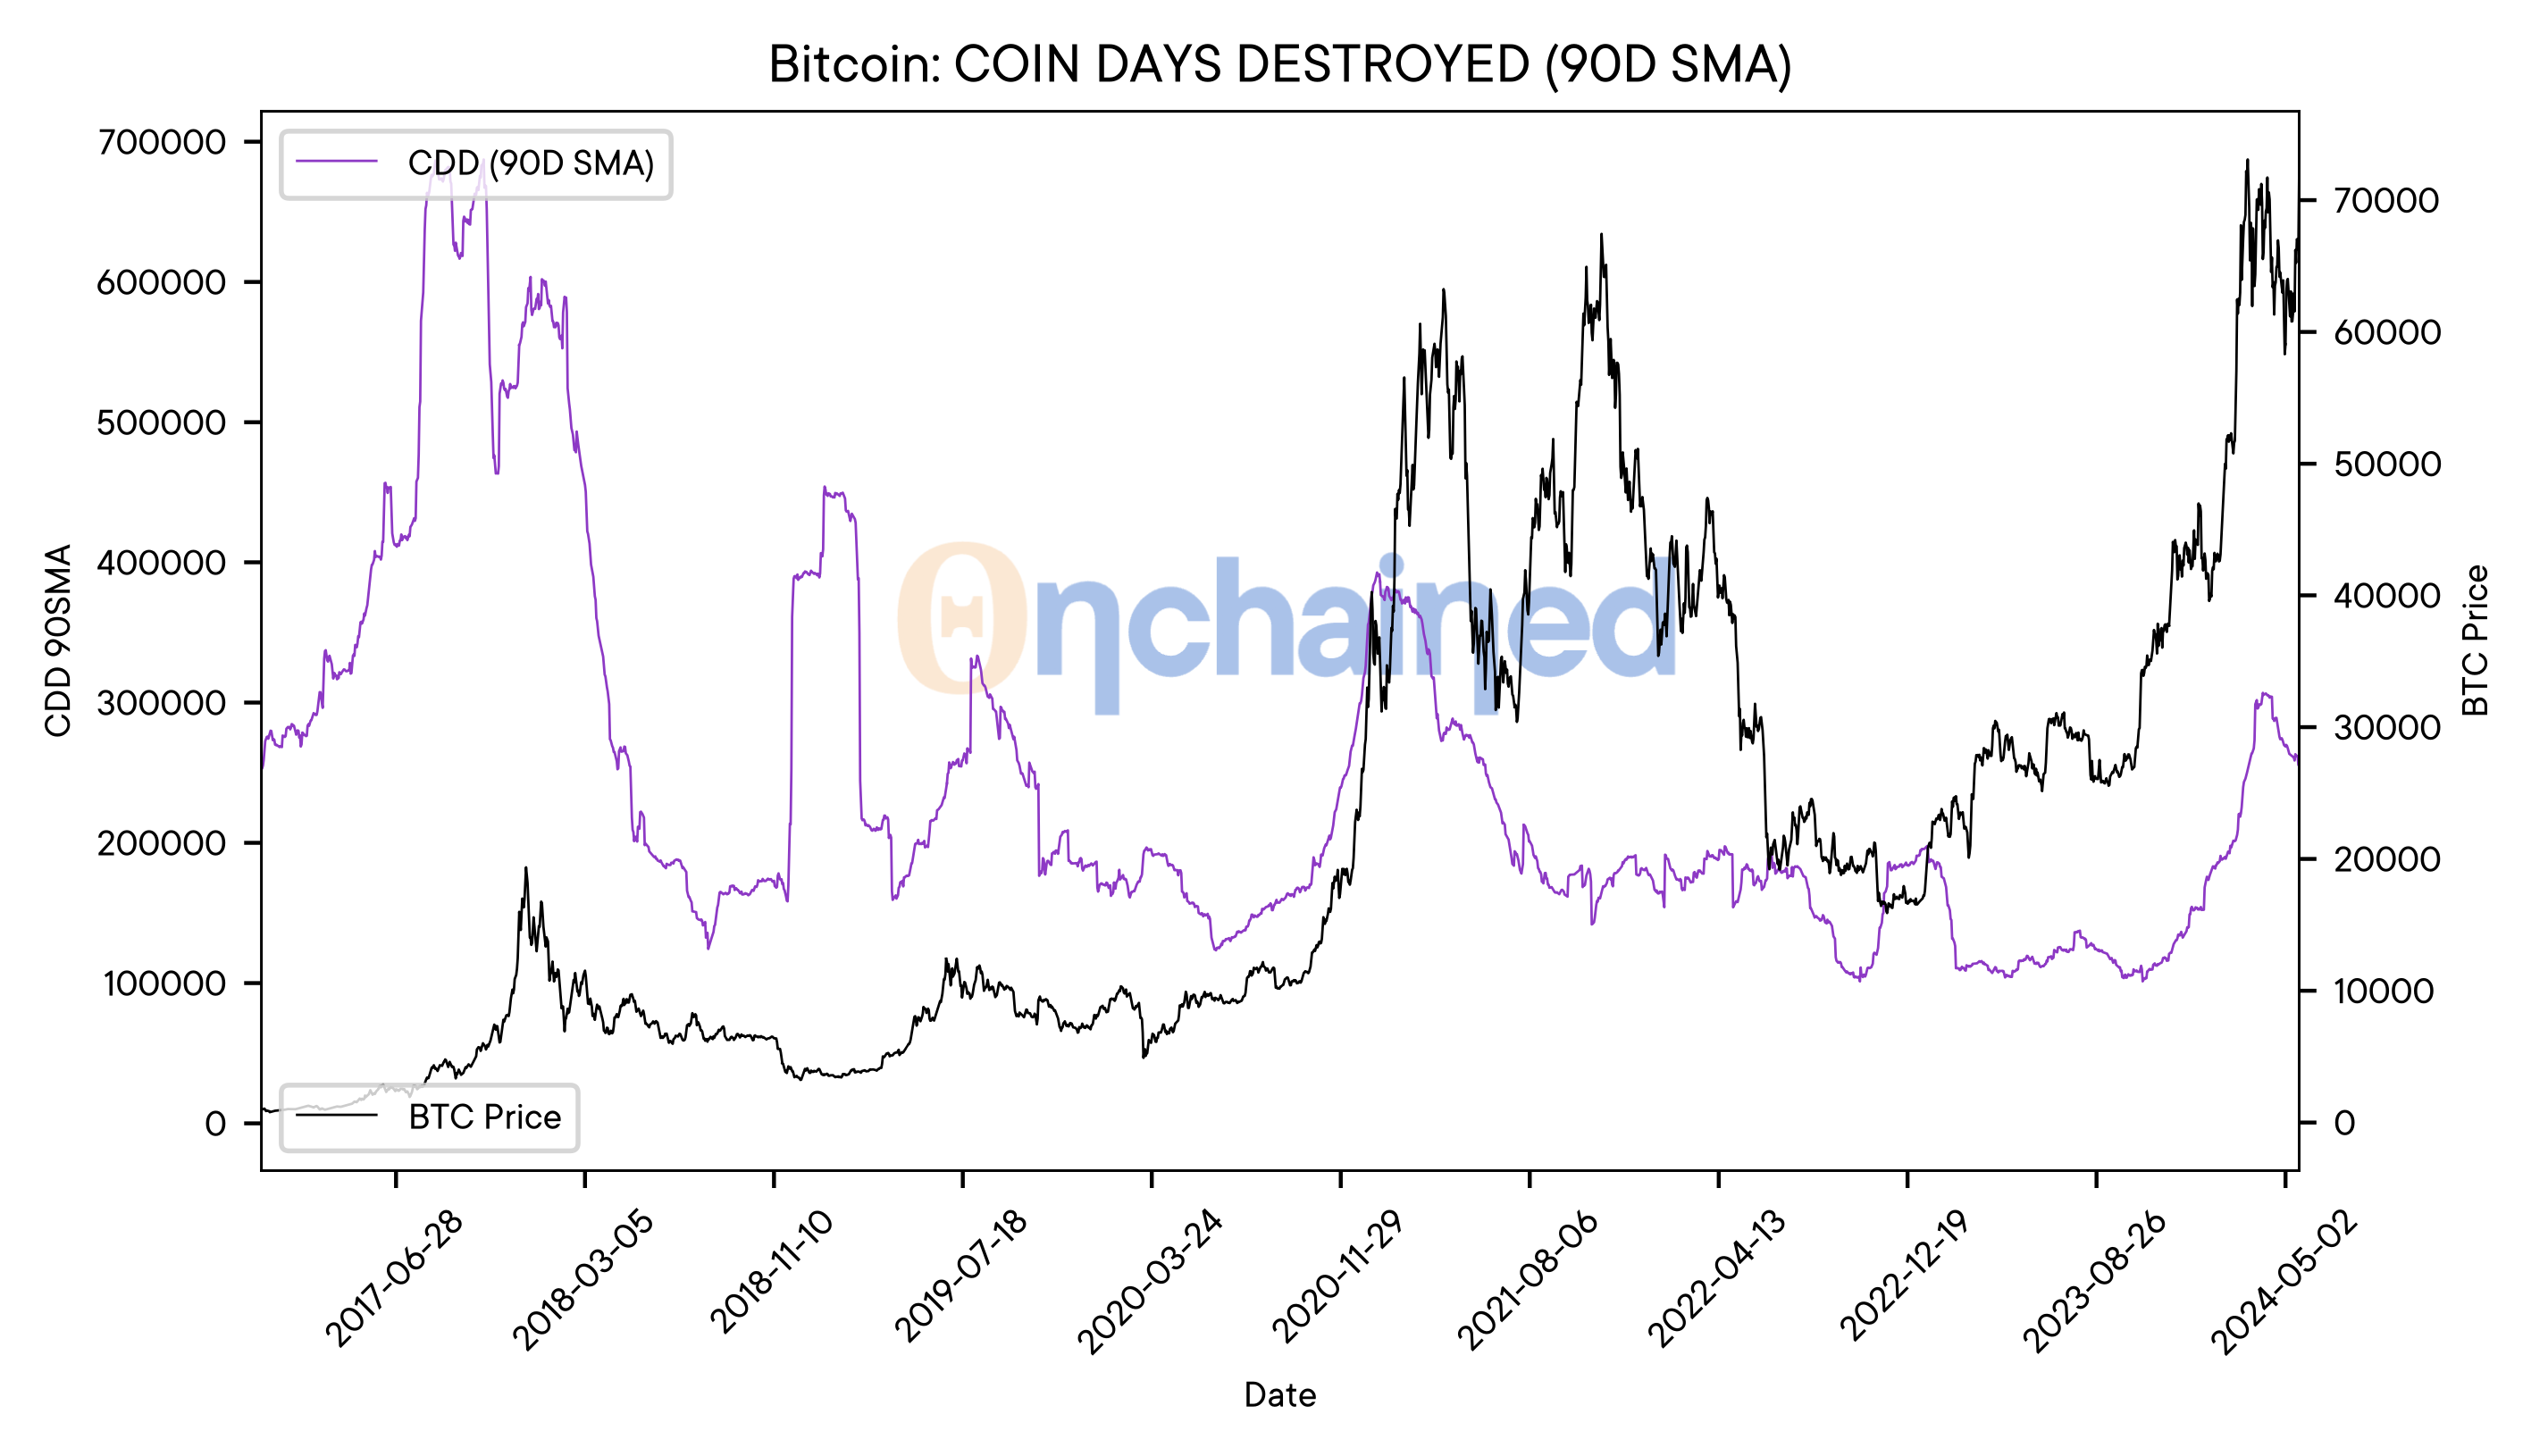
What Is Coin Days Destroyed (CDD)?
Coin Days Destroyed (CDD) measures the activity of long-term BTC holders.
Each Bitcoin accumulates “coin days,” for every day it remains untouched. When it is finally moved, these coin days are “destroyed.” This metric helps identify significant shifts in market sentiment among long-term holders.
CDD is calculated by multiplying the amount of Bitcoin moved by the number of days it was held. The 90-day SMA smooths out daily fluctuations, providing a clearer view of long-term trends.
The 90-day SMA of CDD has shown a steady increase in 2023, indicating growing activity among long-term holders.
However, recent decreases in CDD indicate reduced selling pressure from long-term holders, suggesting confidence in continued price appreciation. This aligns with the recent bullish momentum in Bitcoin’s price, further supporting our analysis.
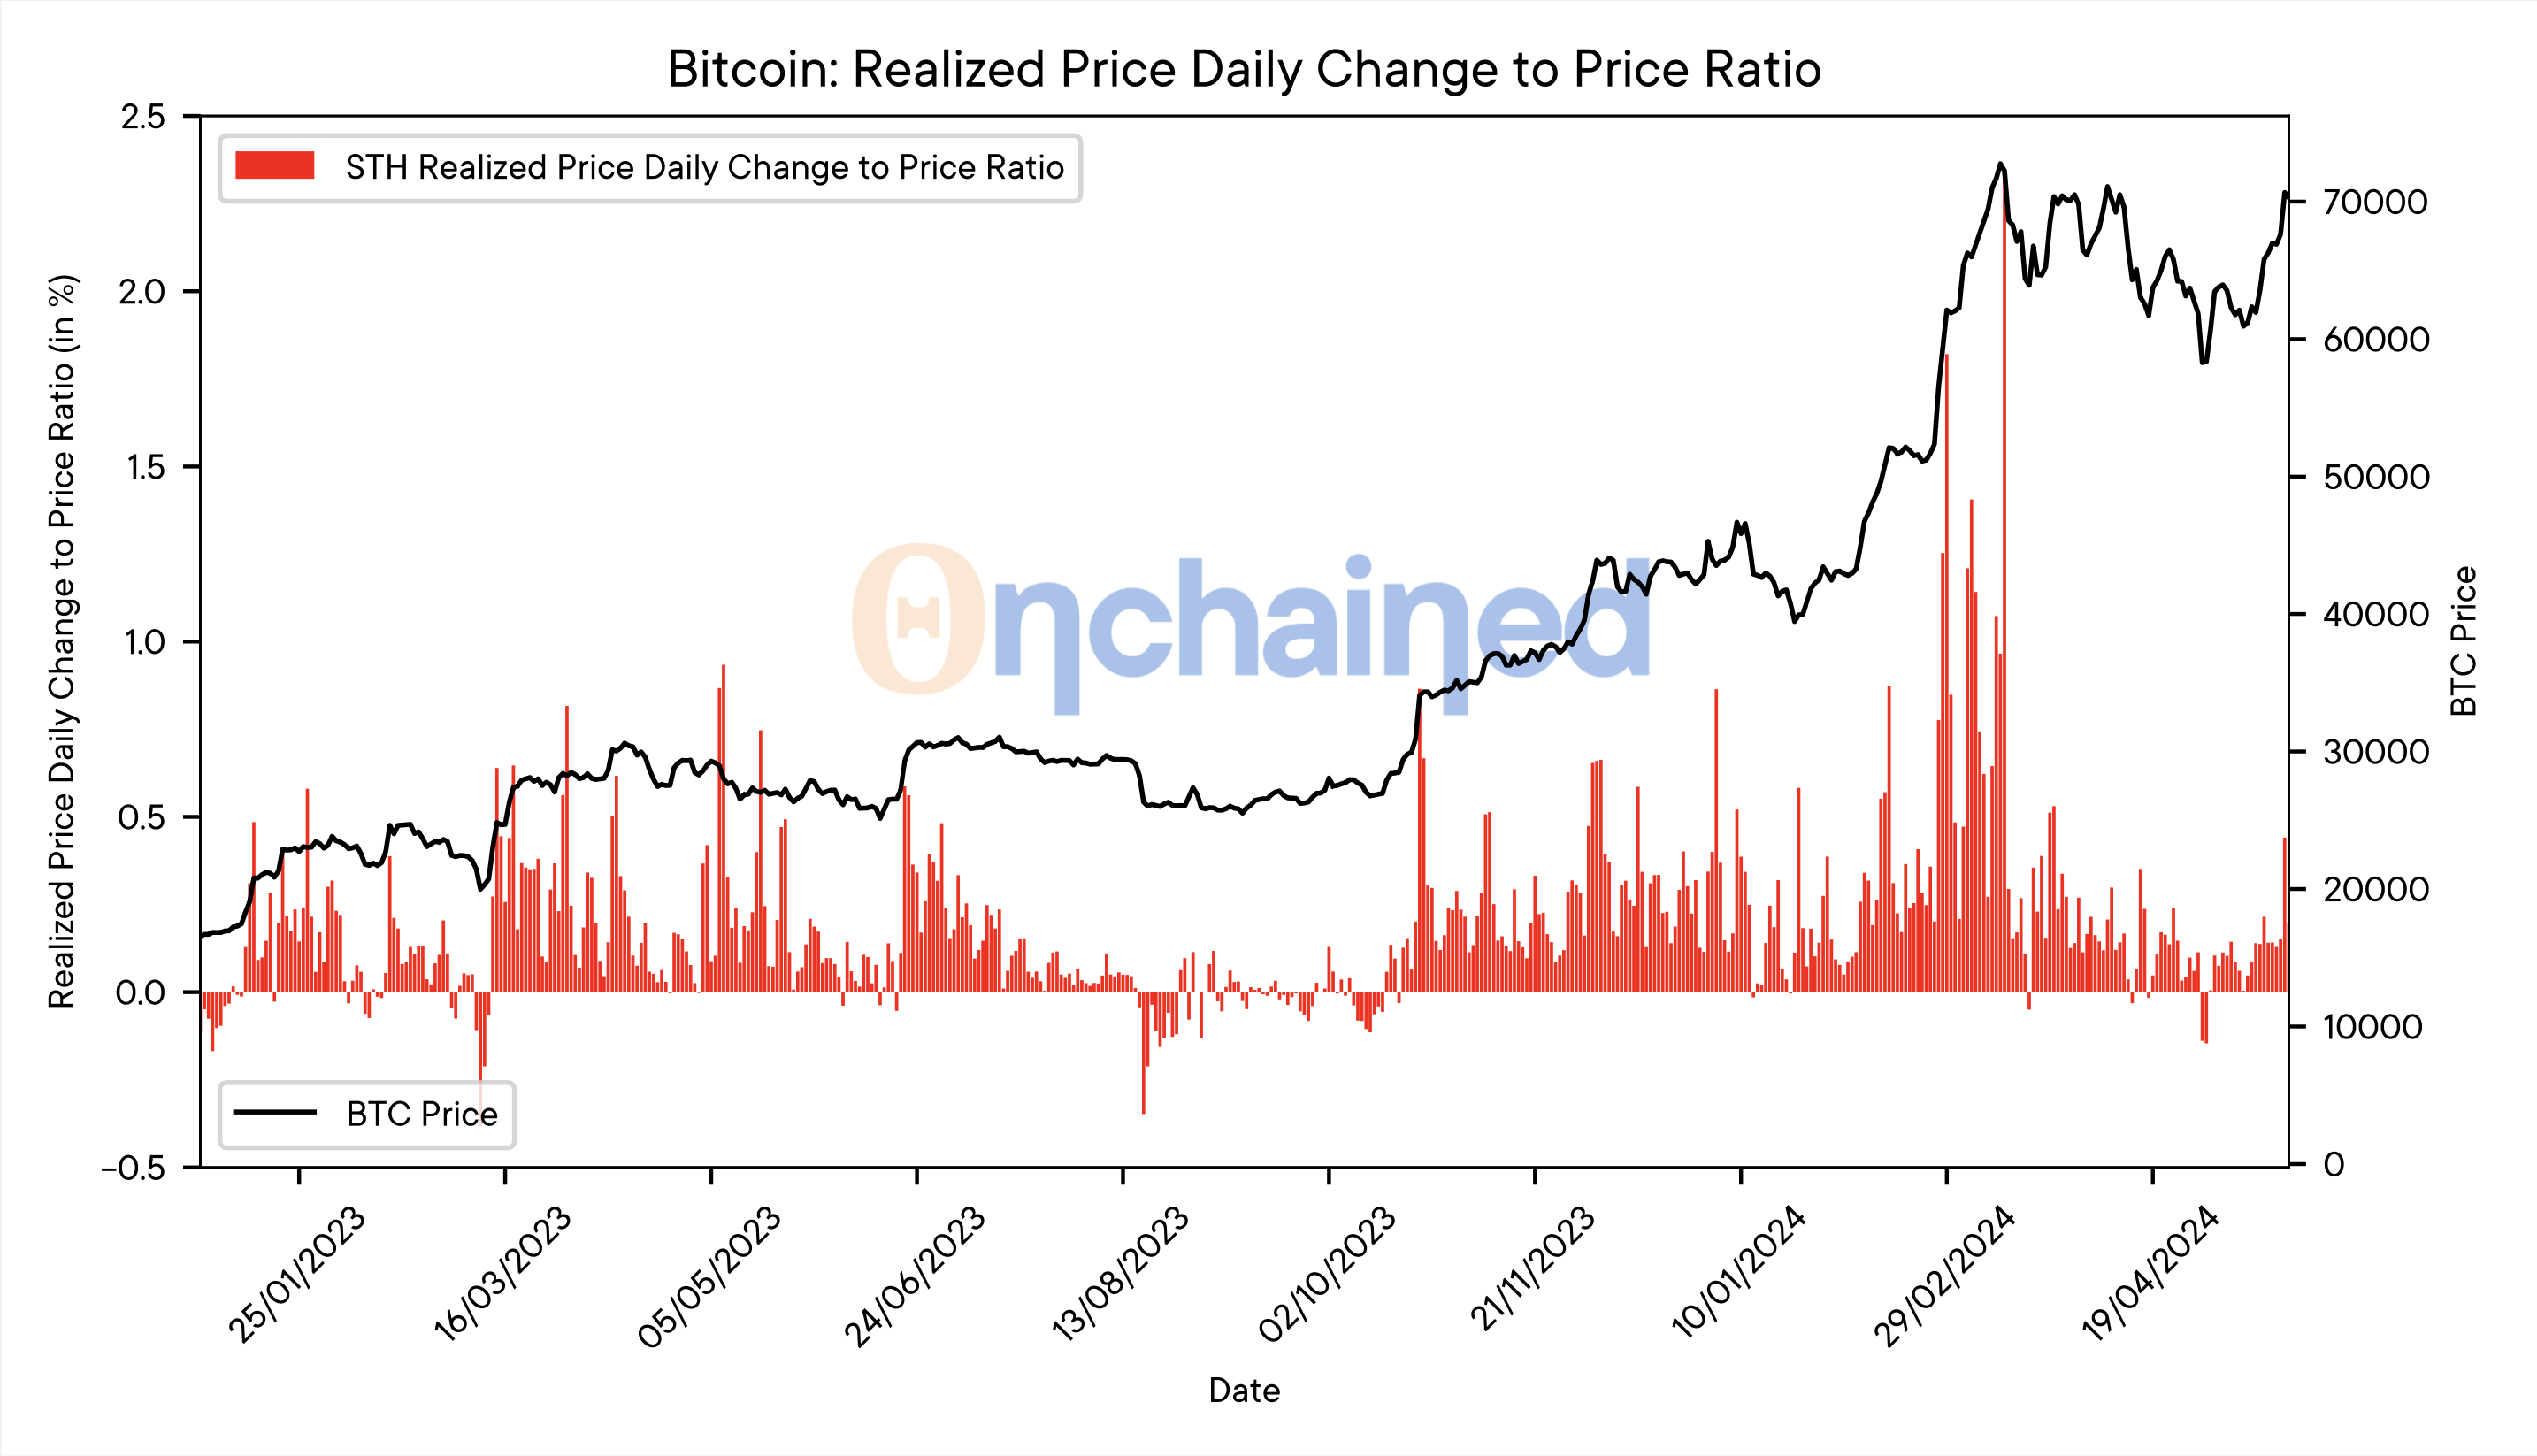
What Is the STH RP Daily Change to Price Ratio?
The Short-Term Holders Realized Price to Price Ratio (STH RP/PR) is an innovative indicator identifying potential buy signals during bull markets. This metric compares the realized price daily change of short-term holders to the current market price, highlighting periods of negative sentiment as potential buying opportunities.
Negative STH RP/PR values suggest that short-term holders capitulate, often marking good entry points for new investments.
We can observe that the Short-Term Holders’ Realized Price-to-Price Ratio (STH RP/PR) increased during Bitcoin’s appreciation to $72,000. This suggests that the price could continue to rise, as short-term holders, on average, are not facing unrealized losses relative to the current BTC price.
Strategic Recommendations and Future Price Projections
On-chain data and Bitcoin fundamentals indicate a looming bull run. A sustained break above the $73,000 resistance level could easily propel the price to $82,000.
Obviously, a sustained drop below $68,000 could reverse market trends, but the likelihood of this happening is diminishing. As highlighted in previous BeInCrypto analyses, the majority of on-chain data has shown positive signals for weeks.
BeInCrypto will continuously monitor these metrics and provide updates to keep you informed about key market movements and opportunities. Stay tuned for detailed future outlooks and strategic insights.


