
After six consecutive months of red candles, a green monthly candle has finally appeared. However, LINK price still remains below $10. Investors appear to view the sideways movement under $10 in March as an accumulation opportunity.
On-chain data for LINK shows notable signals that support a positive outlook for the coming month.
Chainlink Accumulation Reaches Record Levels as Whales Aggressively Buy
Data from Arkham Intelligence shows several large LINK purchases this week. These include 217,000 tokens ($2 million) acquired OTC from Cumberland and 83,000 tokens ($800,000) bought on Binance.
In addition, a large investor (0x91c) purchased 384,000 LINK (~$3.49 million) OTC from B2C2 Group and Galaxy Digital.
According to data from the analytics platform Santiment, the number of wallets holding at least 1,000 LINK has risen to 25,420. This marks the highest level since December 3, 2025.
This figure reflects a clear trend: mid-sized and large investors are actively increasing their LINK holdings rather than selling.
“While LINK remains in the $9 to $10 range since early February, larger capital wallets have gradually returned to the network in anticipation of a future breakout,” Santiment reported.
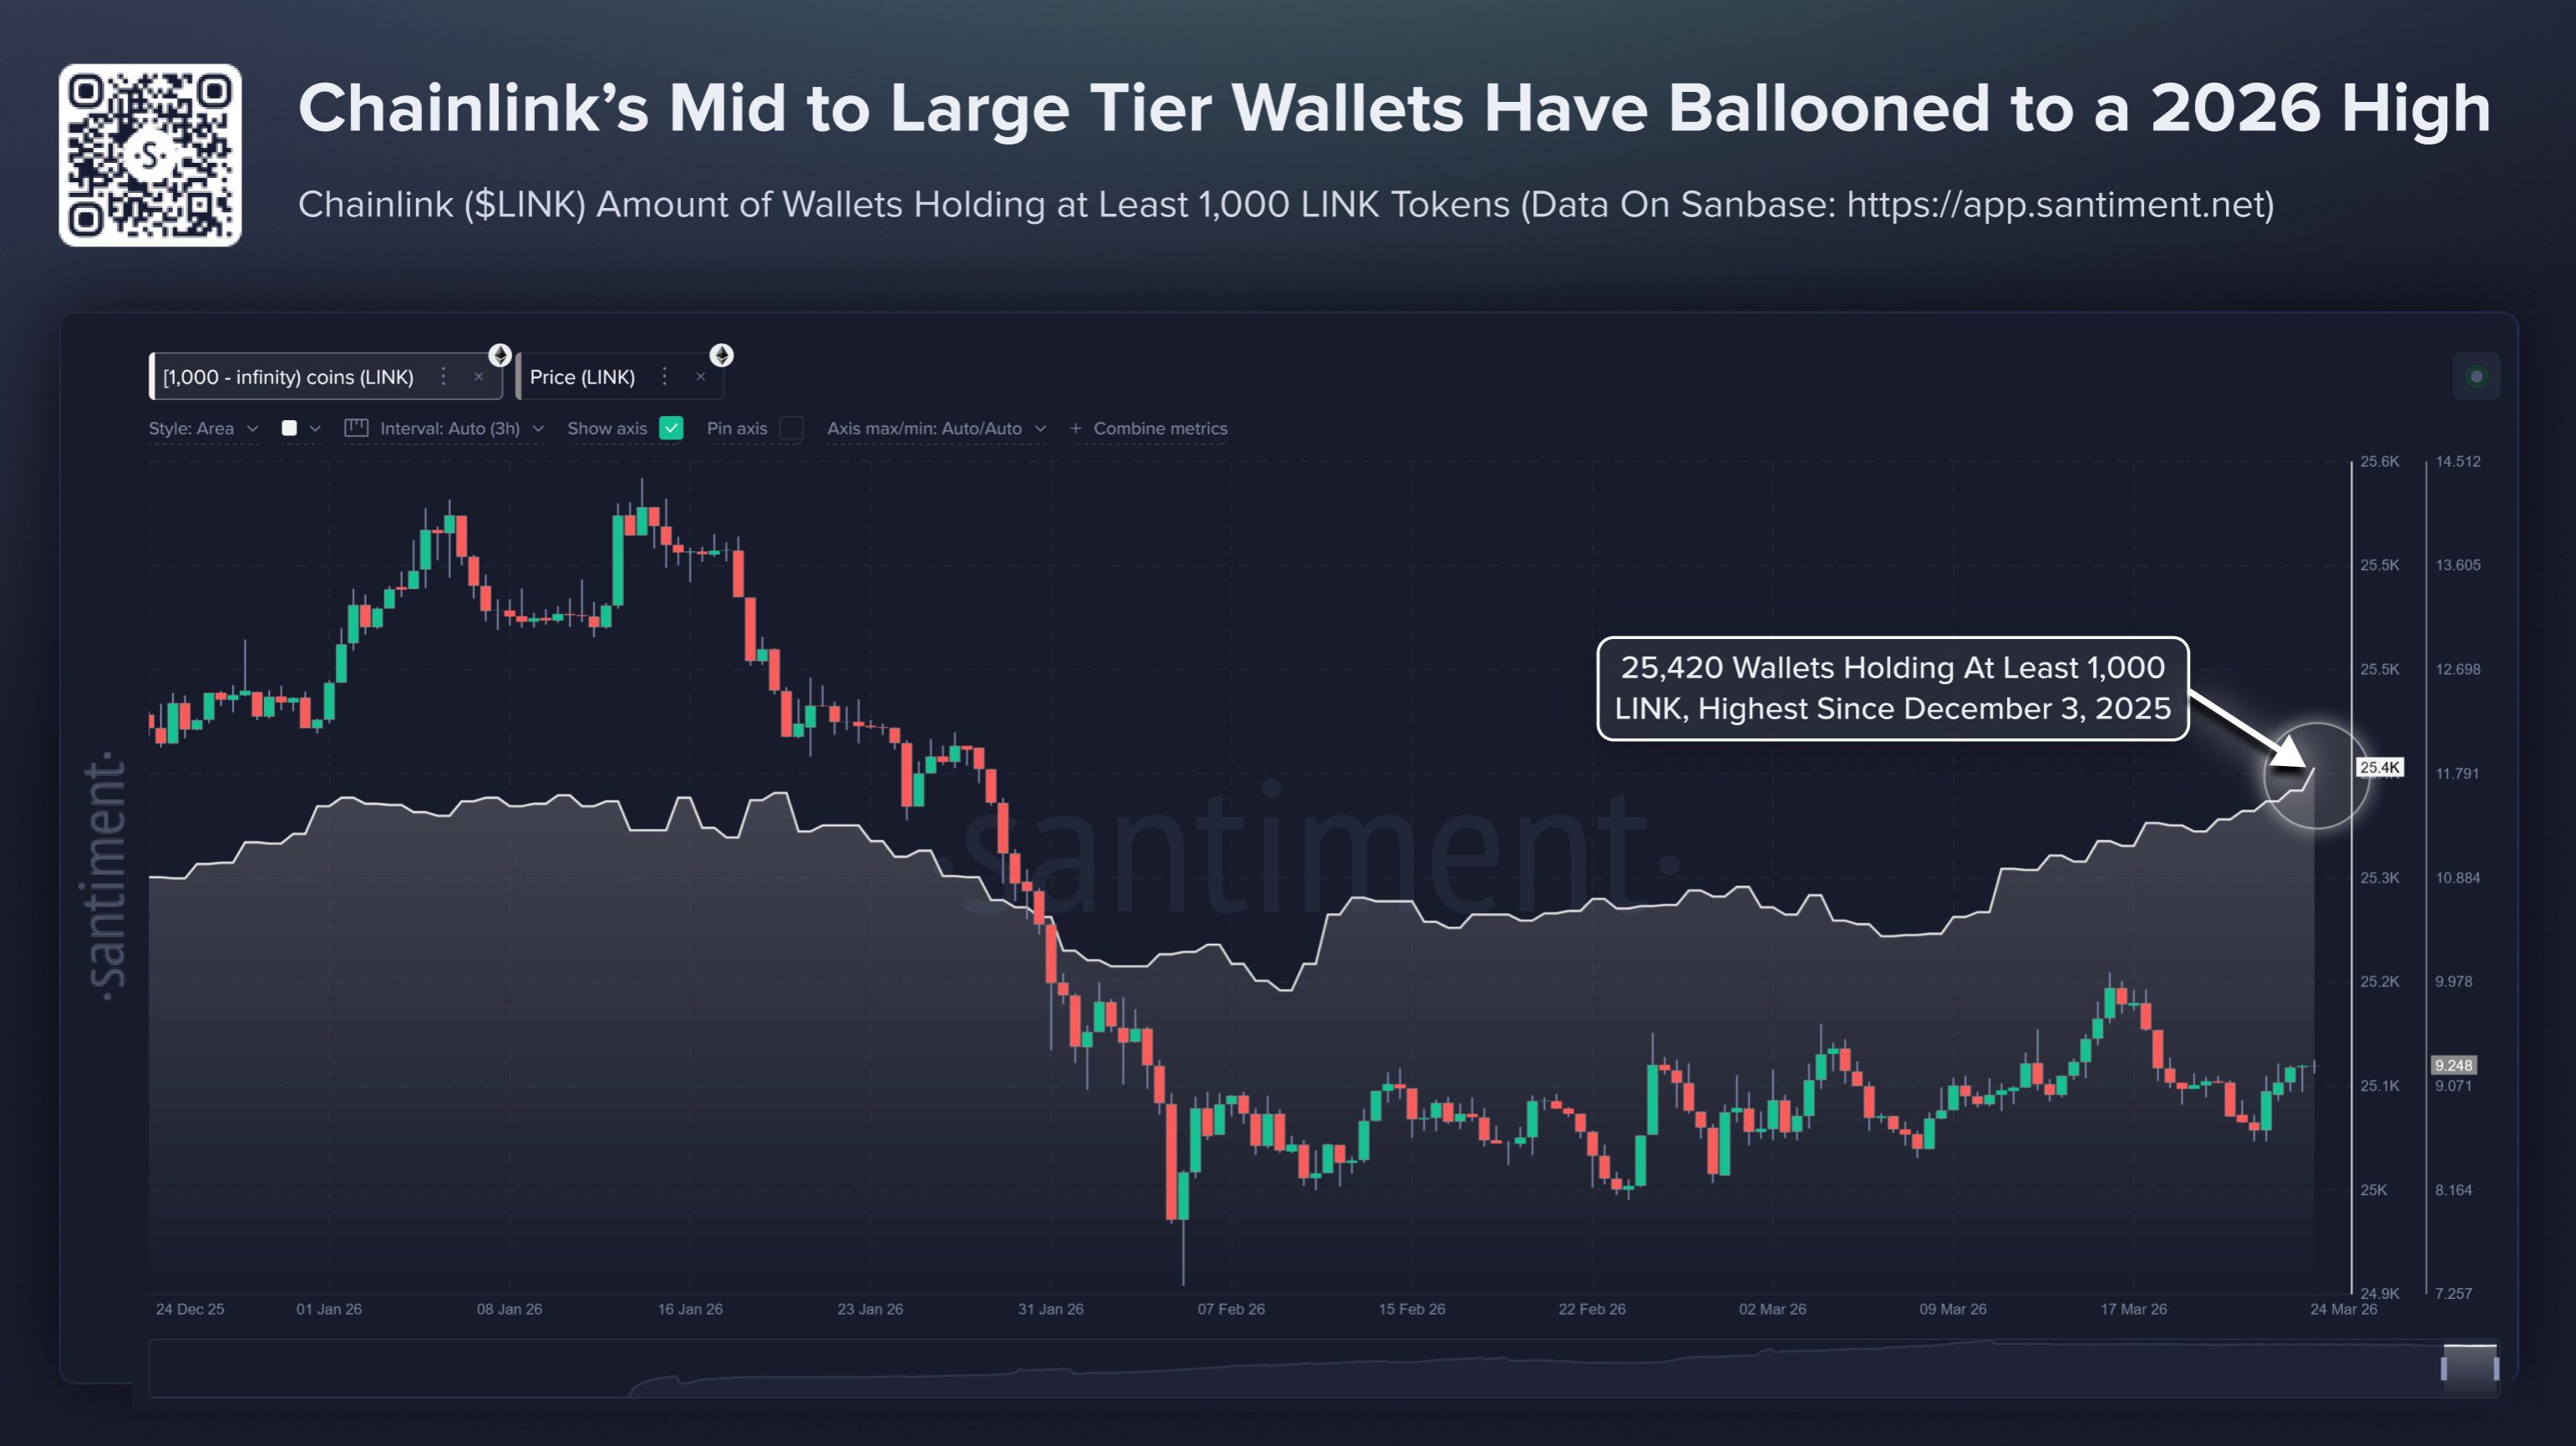
Price stability combined with a rising number of holding wallets is a classic on-chain signal. It often indicates hidden buying pressure building beneath the surface.
Institutional capital is also flowing into Chainlink through traditional financial products. In March 2026, spot LINK ETFs in the United States reached a new record in total net assets, currently standing at $93.74 million.
Data from SosoValue shows that the total net assets of LINK ETFs have increased since early February. The chart forms a steep upward line throughout March.
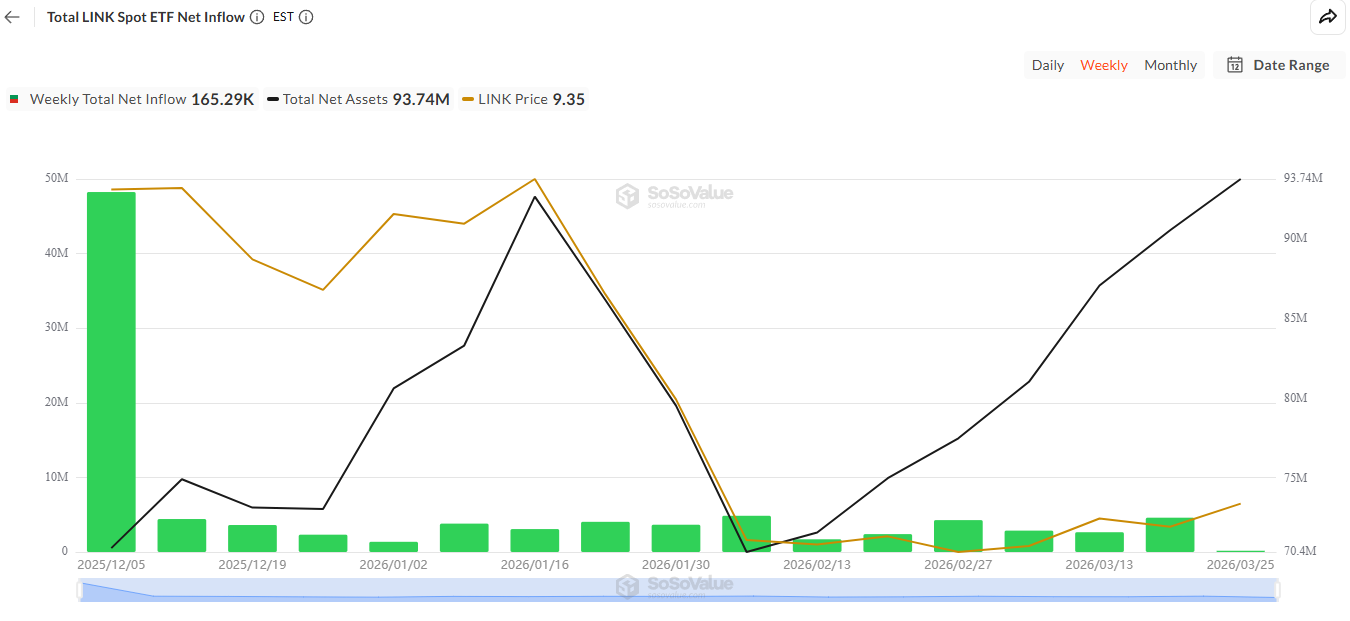
Weekly net inflows have remained consistently positive, with no negative weeks recorded. This trend shows that institutional demand for LINK exposure remains strong.
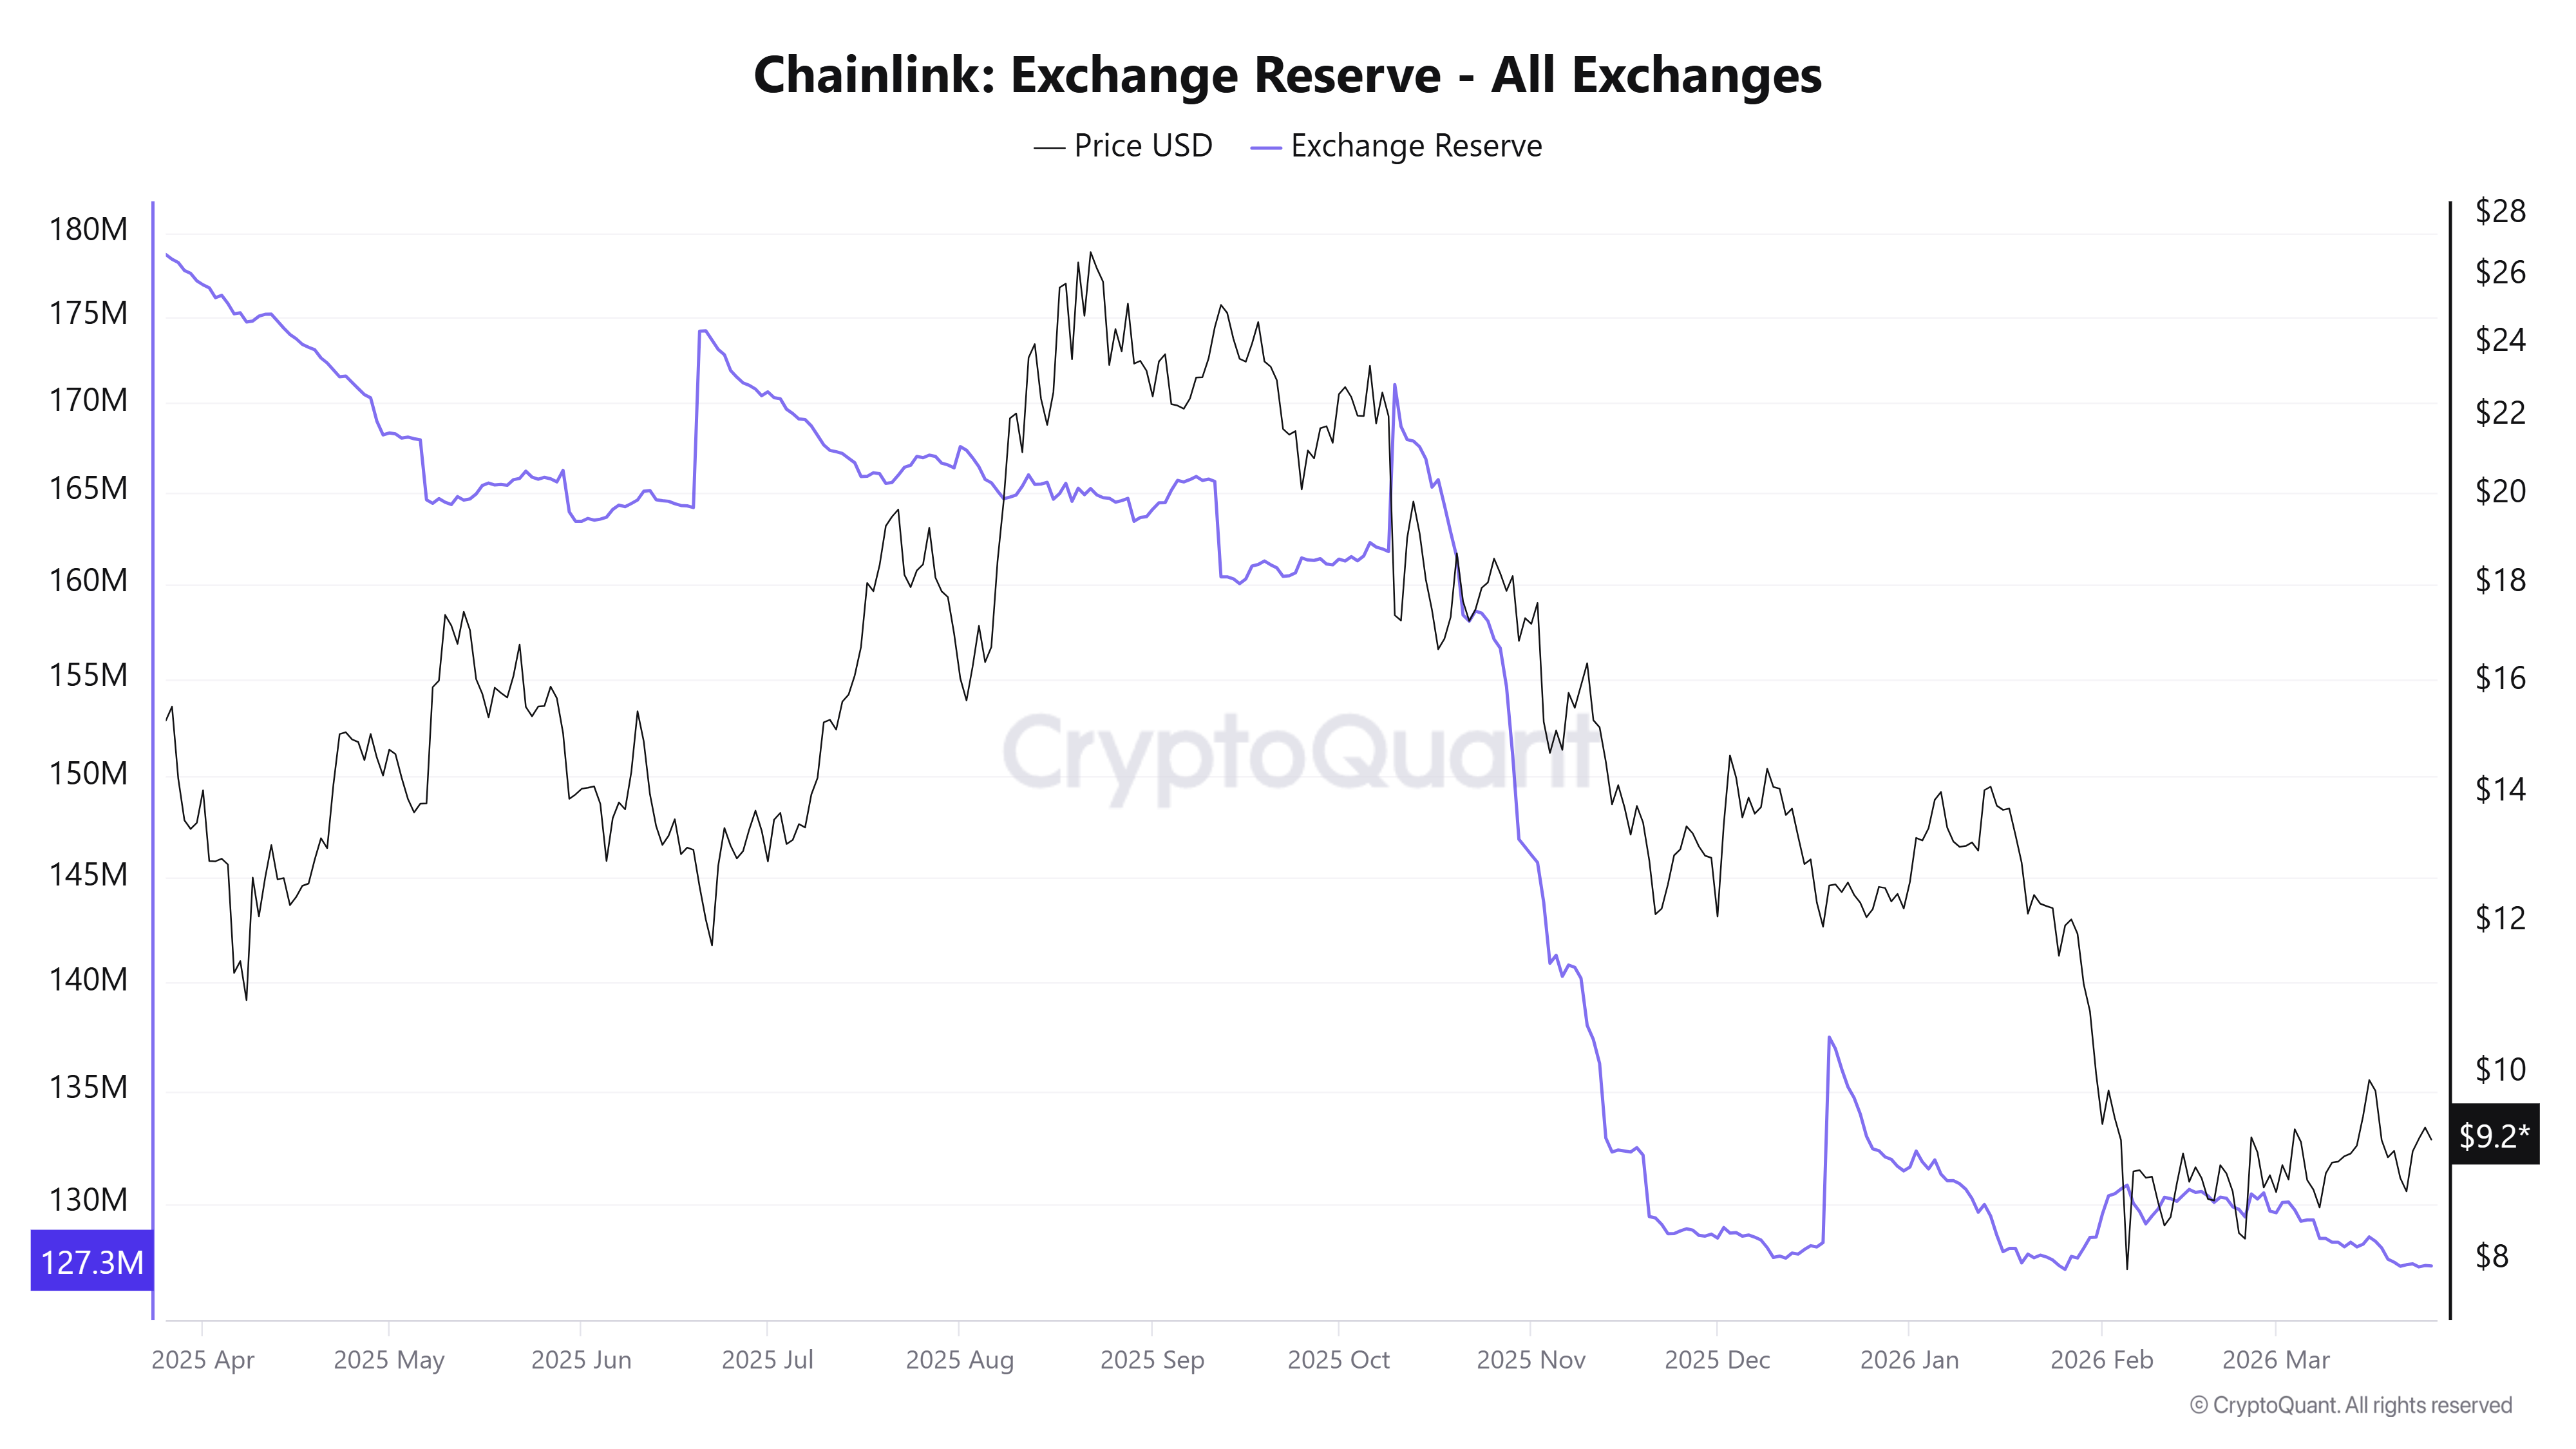
Furthermore, data from CryptoQuant shows that LINK reserves on exchanges have steadily declined while the price has moved sideways below $10.
Current exchange reserves stand at 127.3 million LINK. Lower available supply on exchanges, combined with increasing accumulation, creates a foundation for potential recovery.
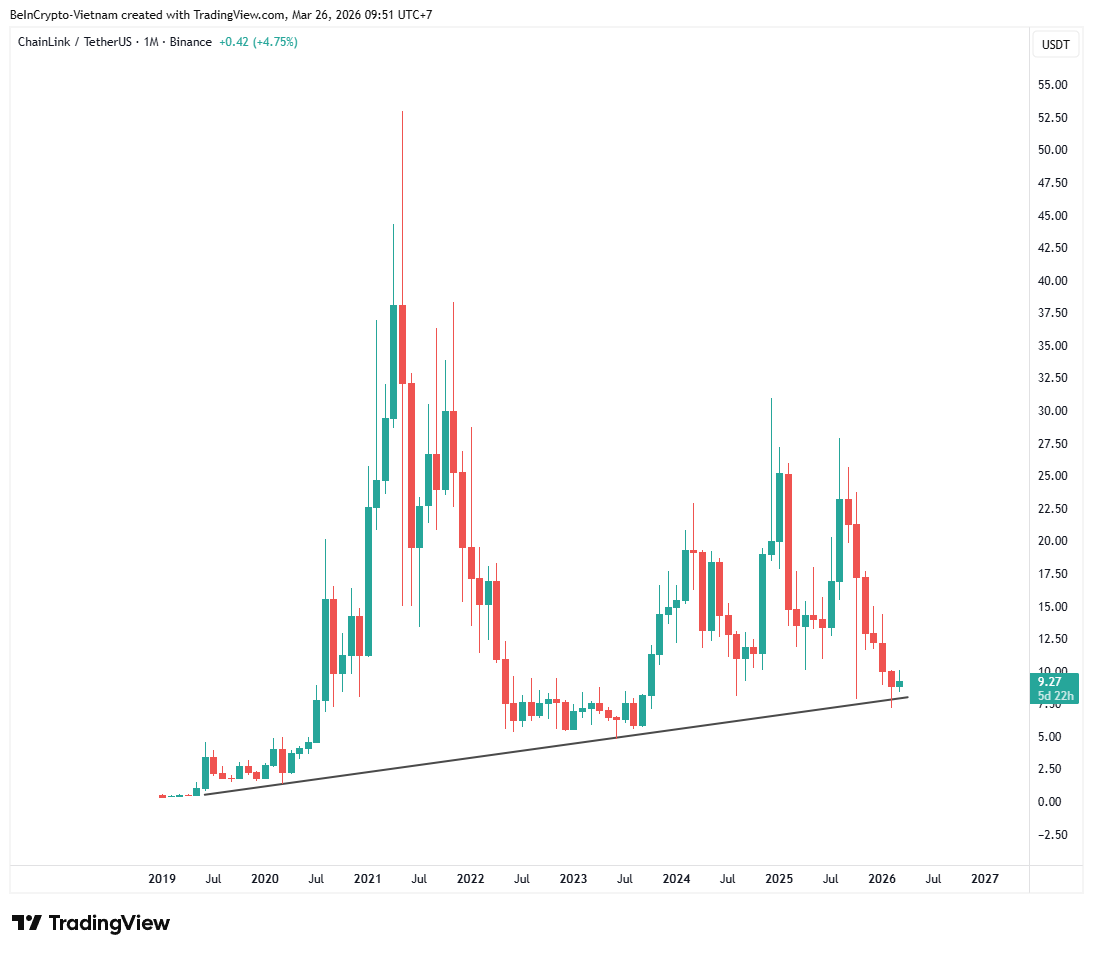
From a technical analysis perspective, LINK is approaching a critical moment. Analysis on TradingView shows that LINK price is currently at its most important support zone since 2019. Holding this level could mark a major shift in price structure.
Historically, long-term support zones like this often provide strong recovery potential. The combination of solid technical support, whale and institutional accumulation, and declining exchange supply creates a setup worth close monitoring.
However, the cryptocurrency market is inherently unpredictable. A recent report from BeInCrypto states that altcoin trading volume has dropped by 85% amid macroeconomic uncertainty, as investors shift toward Bitcoin.
Therefore, even if a recovery occurs in April, LINK’s upside may be limited due to persistent cautious market sentiment.
