

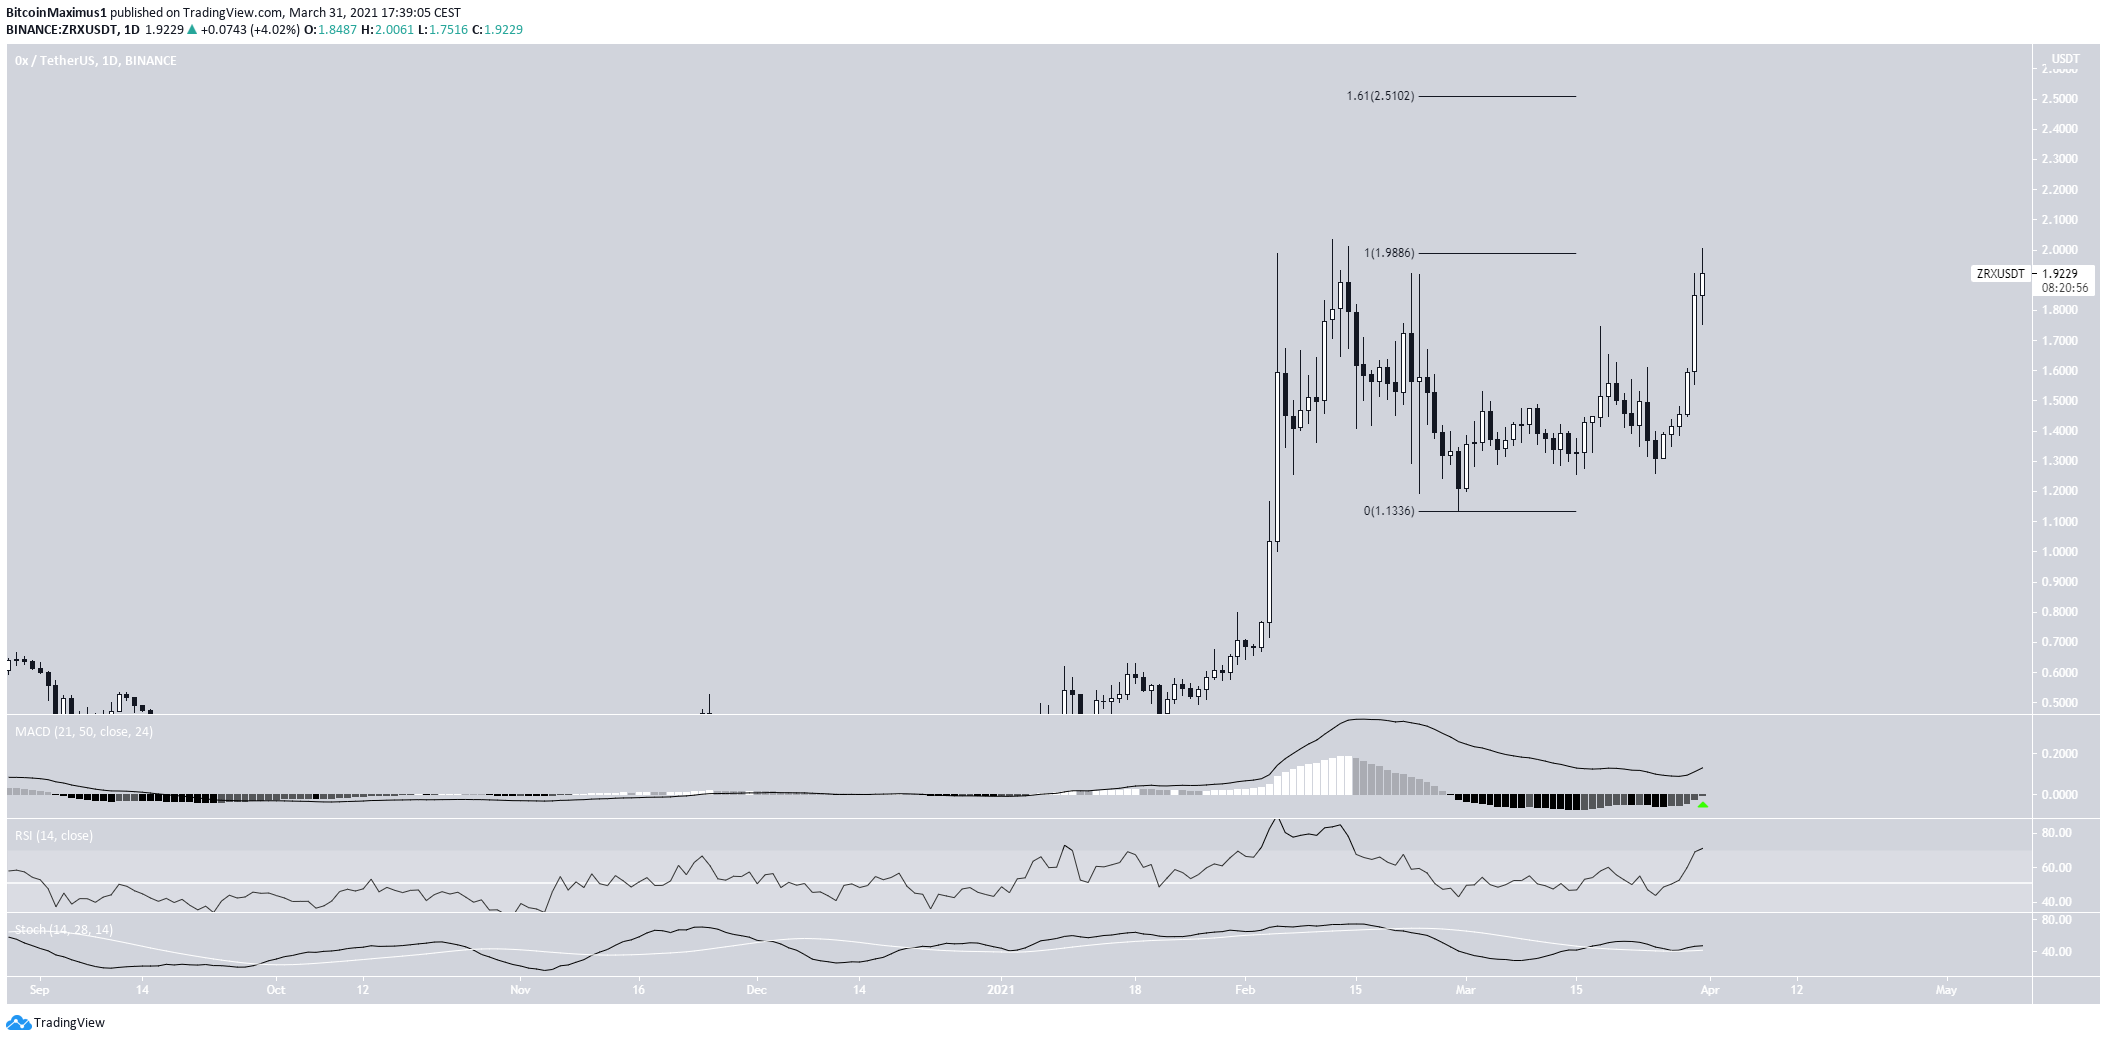
0x (ZRX) is attempting to break out above a long-term resistance level at $2.
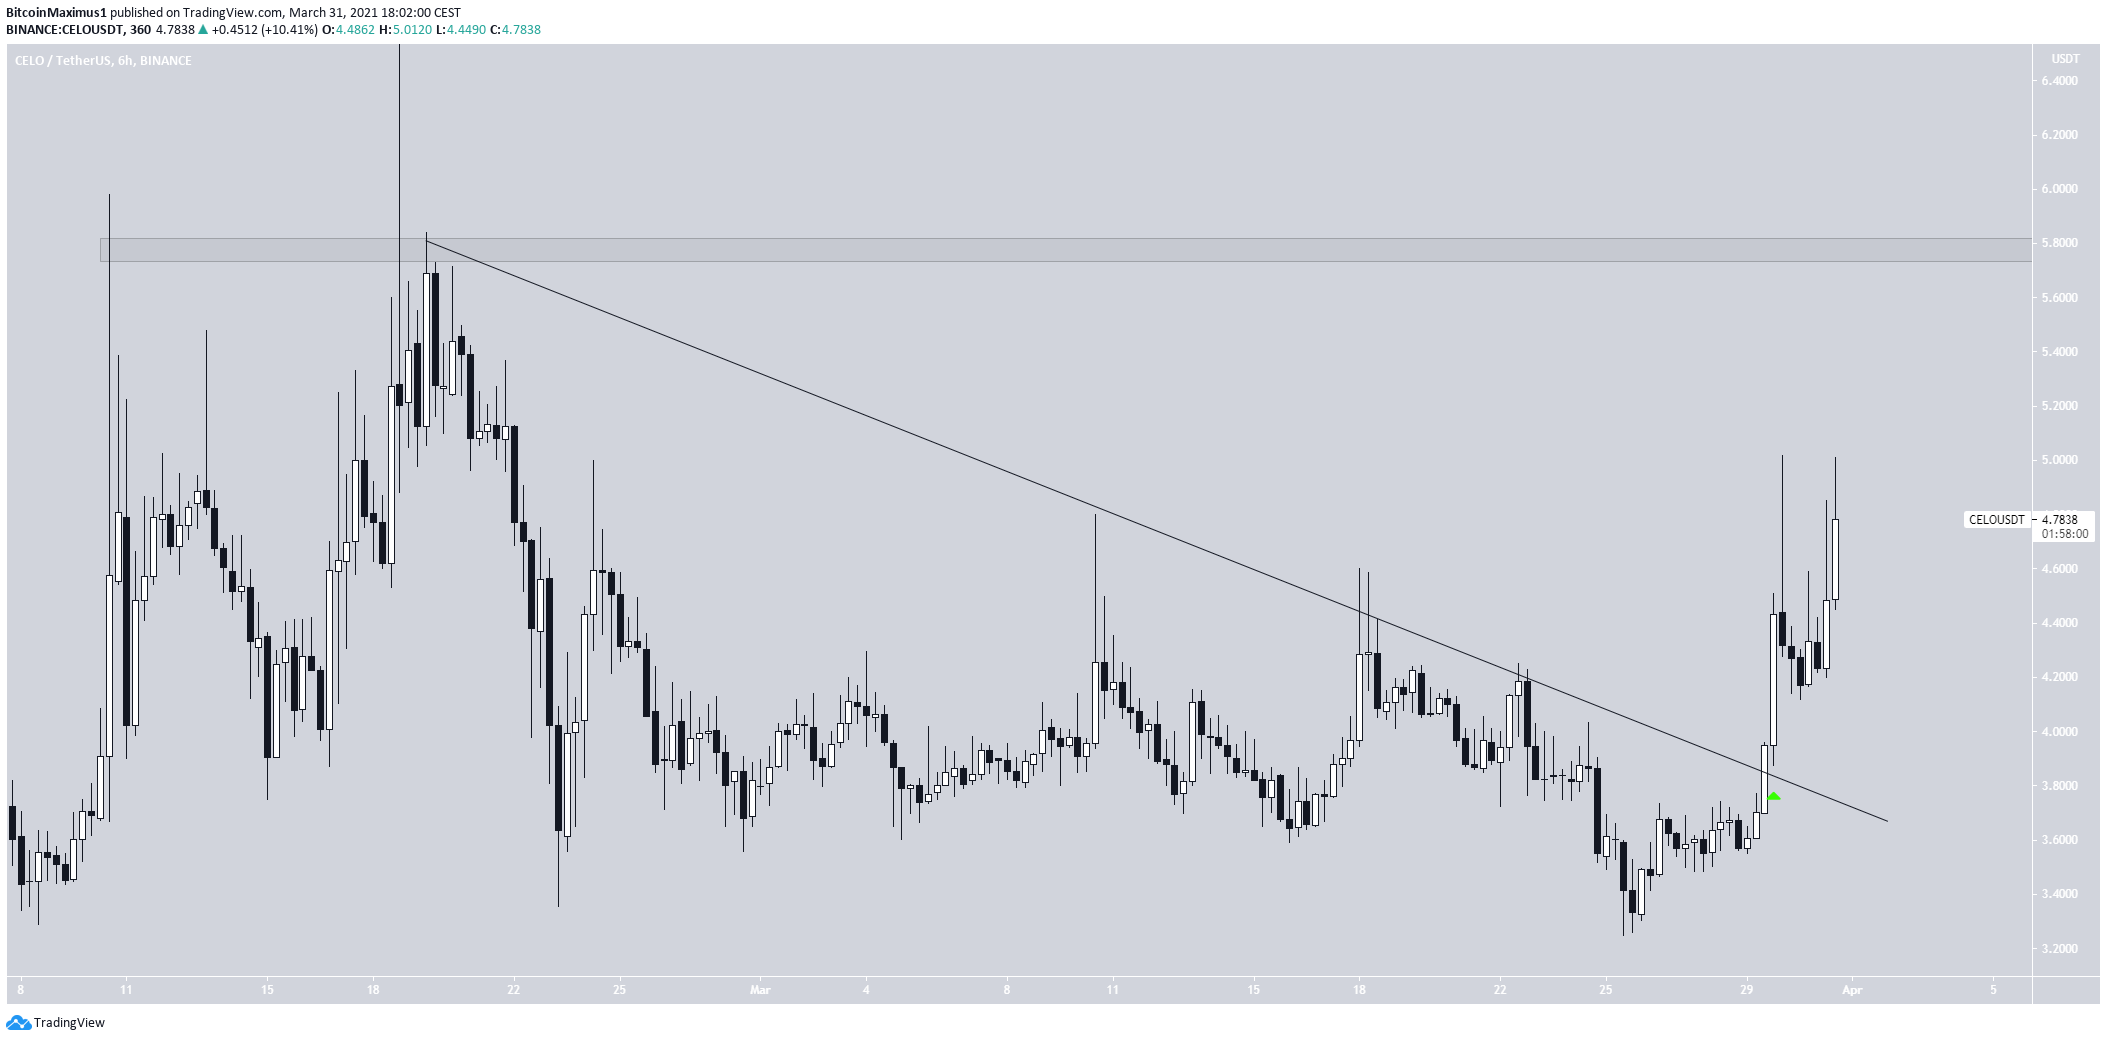
CELO (CELO) has been increasing since reclaiming the $3.60 support area.
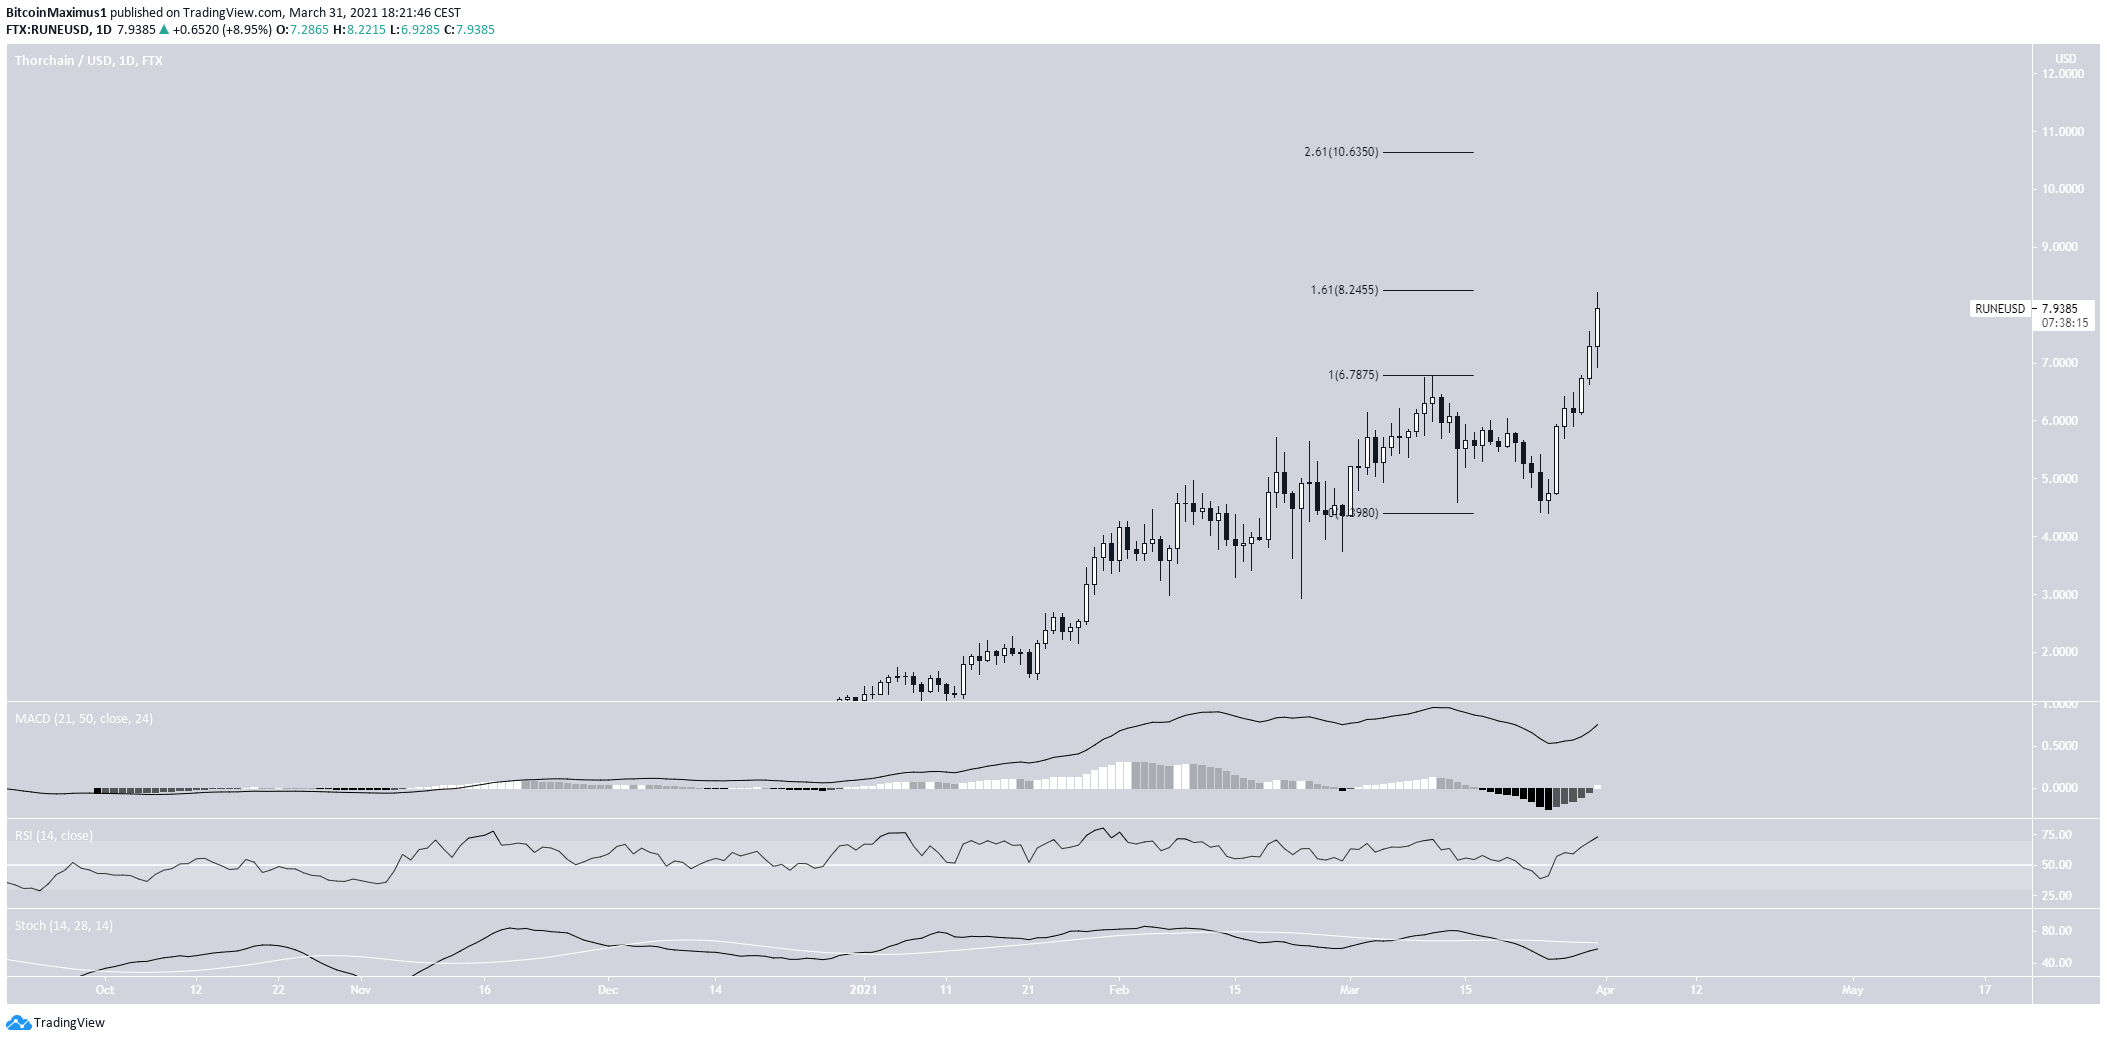
THORChain (RUNE) reached a new all-time high price on March 31.
0x (ZRX)
ZRX has been decreasing since Feb. 12, when it reached a high of $2.036. After dropping for two weeks, ZRX bounced at the $1.13 level and is currently making another breakout attempt.
Technical indicators in the daily time-frame are bullish.
The MACD has nearly crossed into positive territory, and the RSI is crossing above 70. Furthermore, the Stochastic oscillator has made a bullish cross.
If ZRX breaks out, the next resistance area would be found at $2.50.
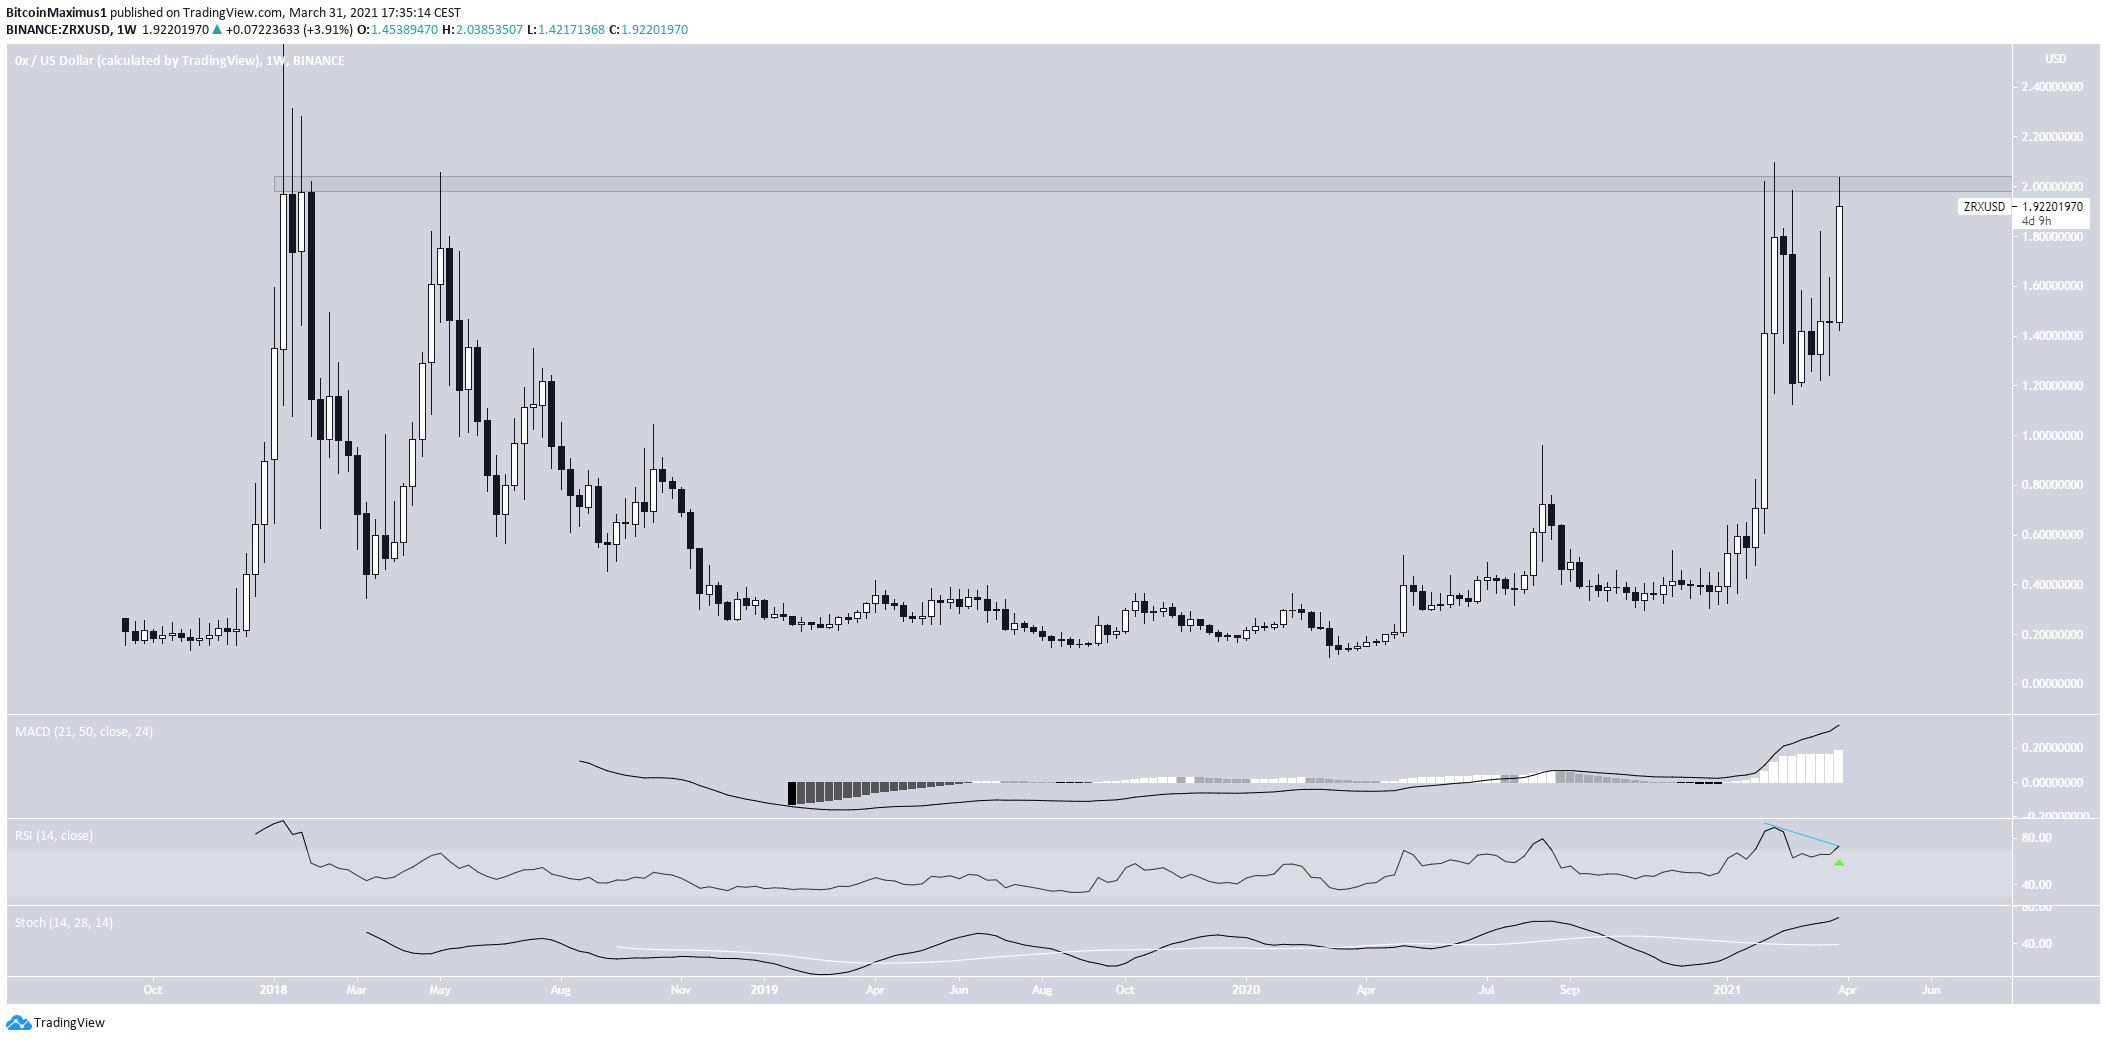
The weekly chart also supports the possibility of a breakout. The main resistance area is $2, and ZRX has never reached a weekly close above it.
While there is a potential bearish divergence in the RSI, it is still unconfirmed. Also, both the MACD & Stochastic oscillator are moving upwards.
Therefore, ZRX is expected to break out.
Highlights
- ZRX is trading below long-term resistance at $2.
- Weekly and daily technical indicators are bullish.
Celo (CELO)
On March 24, CELO deviated below the $3.70 support area. However, it reclaims the $3.60 support area shortly afterward and has been moving upwards since.
Technical indicators are bullish. Therefore, it is likely that the CELO trend is bullish.

The short-term chart shows a breakout from a descending resistance line.
Therefore, CELO is expected to increase towards the all-time high resistance area of $5.80.
Highlights
- CELO has reclaimed the $3.60 support area.
- It has broken out from a descending resistance line.
THORChain (RUNE)
On March 11, RUNE reached a high of $6.77 and fell immediately afterward.
However, it reversed the trend on March 25 and reached a new all-time high price five days later.
Technical indicators are bullish, as evidenced by the positive MACD and the RSI cross above 70.
Currently, RUNE is trading at the $8.25 resistance area, which is the 1.61 external Fib retracement of the most recent drop.
The next resistance area is found at $10.63, the 2.61 external Fib of the same drop.
Highlights
- RUNE is trading close to resistance at $8.25.
- The next resistance area is found at $10.63.
For BeInCrypto’s latest bitcoin (BTC) analysis, click here.
Trusted
Disclaimer
In line with the Trust Project guidelines, this price analysis article is for informational purposes only and should not be considered financial or investment advice. BeInCrypto is committed to accurate, unbiased reporting, but market conditions are subject to change without notice. Always conduct your own research and consult with a professional before making any financial decisions. Please note that our Terms and Conditions, Privacy Policy, and Disclaimers have been updated.
