
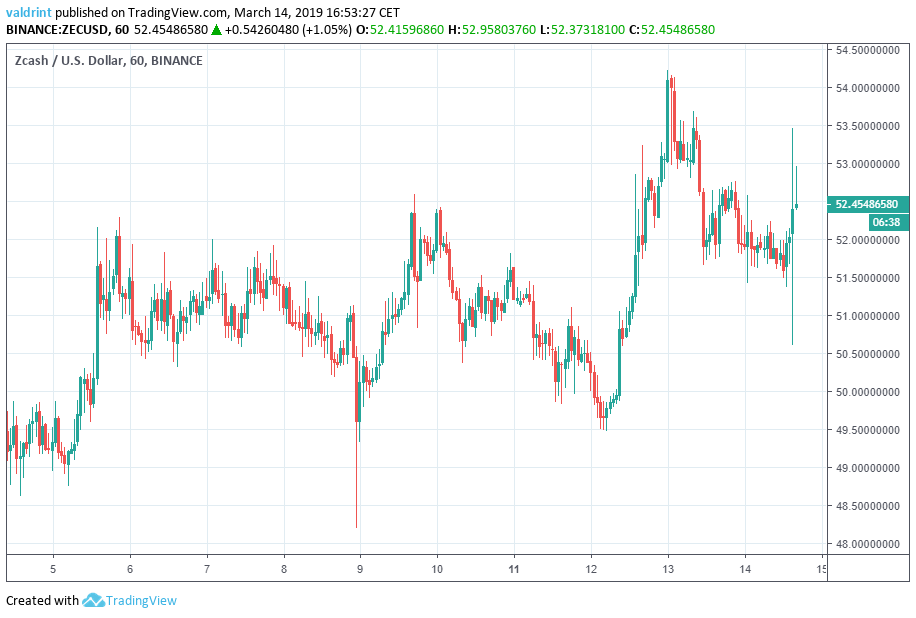
After a gradual price increase that began on Mar 5, Zcash (ZEC) spiked to highs of over $54 on Mar 12 and 13.
A small dip has since followed, but prices are still much higher than before the Mar 12 spike began. Here is a look at the prices of ZEC between Mar 5 and Mar 14:
Key Highlights For Mar 14
- The price of ZEC has been on an uptrend since Mar 9.
- ZEC initiated a rapid upward move on Mar 12.
- The MACD and SMAs have triggered a buy signal.
- There are resistance areas near $54 and $60.
- There are support areas near $48 and $40.
Tracing Support
The price of ZEC on Binance is analyzed at 30-minute intervals from Mar 5 to Mar 14. The price made a low of $48.75 on Mar 5. It immediately initiated an upward move before retracing. After every market cycle, the lows have been higher than the preceding ones. Tracing these lows gives us an ascending support line.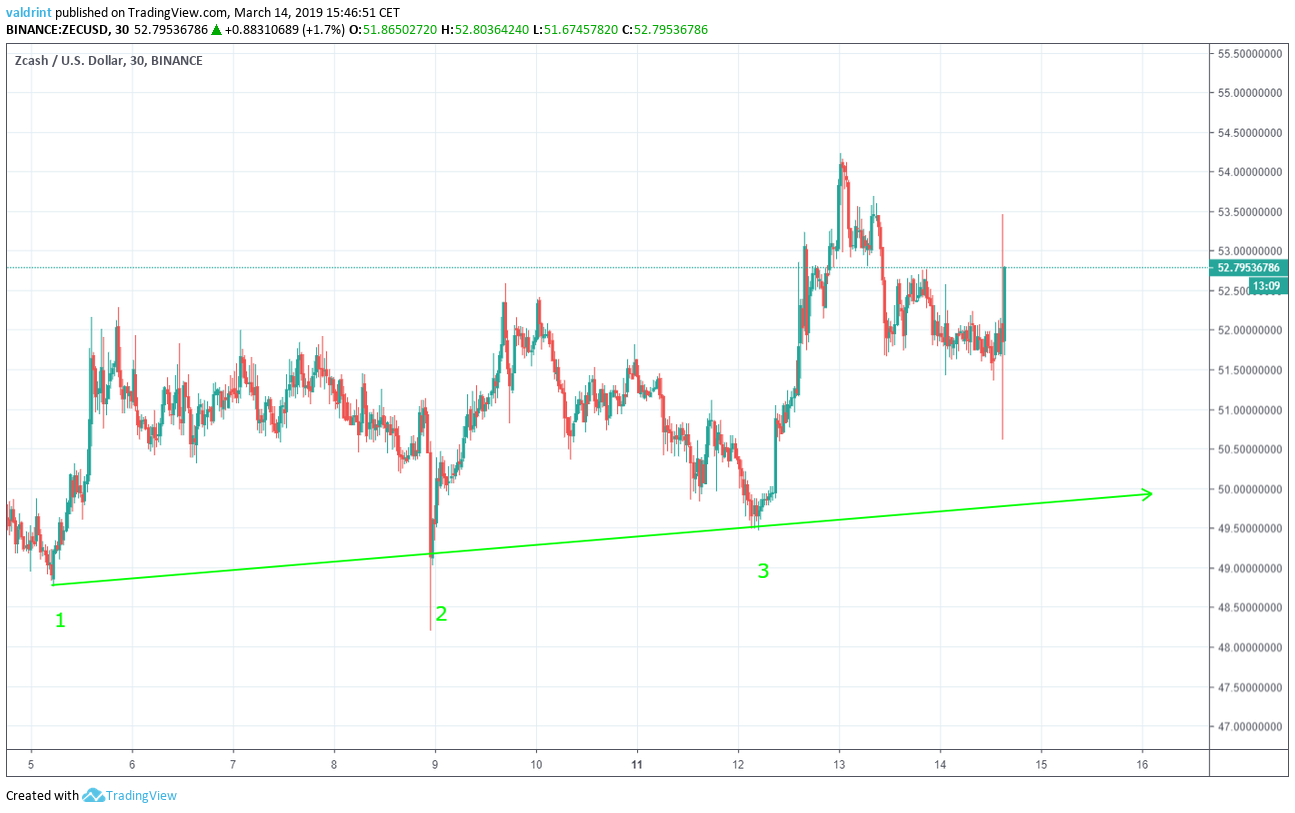
Ascending Triangle
The price of ZEC on Binance is analyzed at one-hour intervals from Feb 25 to Mar 14 in order to better visualize the creation of the resistance line. The price made a high of $54.9 on Feb 25. While it has made several downward moves since it has revisited the same level three more times. Tracing these highs gives us a horizontal resistance line. Similar to the support line, the resistance line can act as a ceiling to price, preventing further upward movement.
The resistance and support lines combine to create an ascending triangle. This is a bullish pattern and suggests forthcoming prices increases as predicted by the support line.
Based on this pattern, it is likely that the price of ZEC continues increasing at the rate projected by the support line while remaining within the confines of the ascending triangle. At a point of convergence between the support and resistance, ZEC is projected to break out of the resistance or breakdown below support. If price continues moving along the current upward trend, a breakout is more likely.
Similar to the support line, the resistance line can act as a ceiling to price, preventing further upward movement.
The resistance and support lines combine to create an ascending triangle. This is a bullish pattern and suggests forthcoming prices increases as predicted by the support line.
Based on this pattern, it is likely that the price of ZEC continues increasing at the rate projected by the support line while remaining within the confines of the ascending triangle. At a point of convergence between the support and resistance, ZEC is projected to break out of the resistance or breakdown below support. If price continues moving along the current upward trend, a breakout is more likely.
Signal Triggered
The moving average convergence divergence (MACD) is a trend indicator that shows the relationship between moving averages (long and short-term) and the price. It is used to measure the strength of a move. Combined with simple moving averages (SMA), MACD can be used as a trigger for buy and sell signals. Signals are triggered whenever the MACD line is above 0 and the price is above the 21 (red) and 50-period (green) SMAs.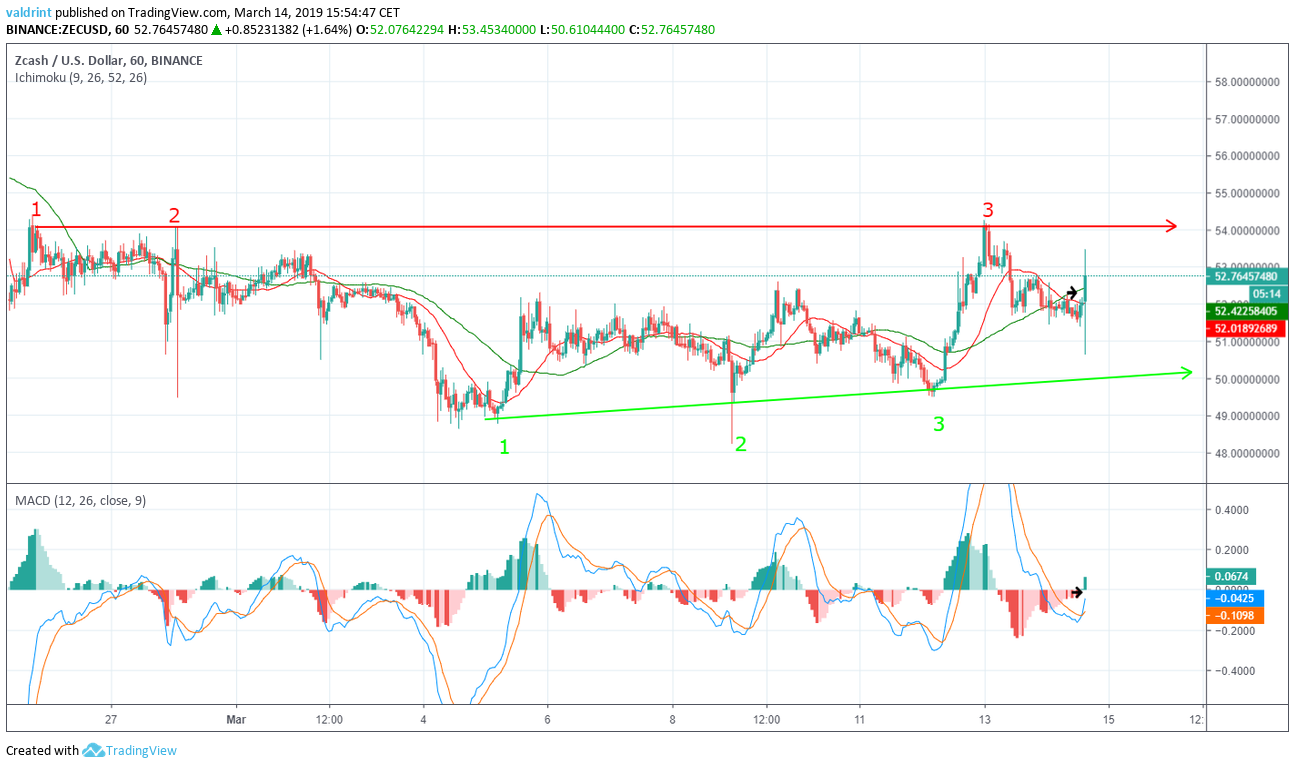 On Mar 14, the price initiated a rapid upward movement. This brought it above the 21 and 50-period moving averages.
During the same interval, the MACD line crossed above 0. This would have triggered a buy signal, indicating that the current trend may be ending and that a more rapid price increase may soon begin.
According to these indicators, it is likely that a new upward trend has started and the price will reach the horizontal resistance line soon.
On Mar 14, the price initiated a rapid upward movement. This brought it above the 21 and 50-period moving averages.
During the same interval, the MACD line crossed above 0. This would have triggered a buy signal, indicating that the current trend may be ending and that a more rapid price increase may soon begin.
According to these indicators, it is likely that a new upward trend has started and the price will reach the horizontal resistance line soon.
Reversal Areas
The price of ZEC on Binance is analyzed at six-hour intervals from Feb 2 to Mar 9 in order to better visualize possible reversal areas.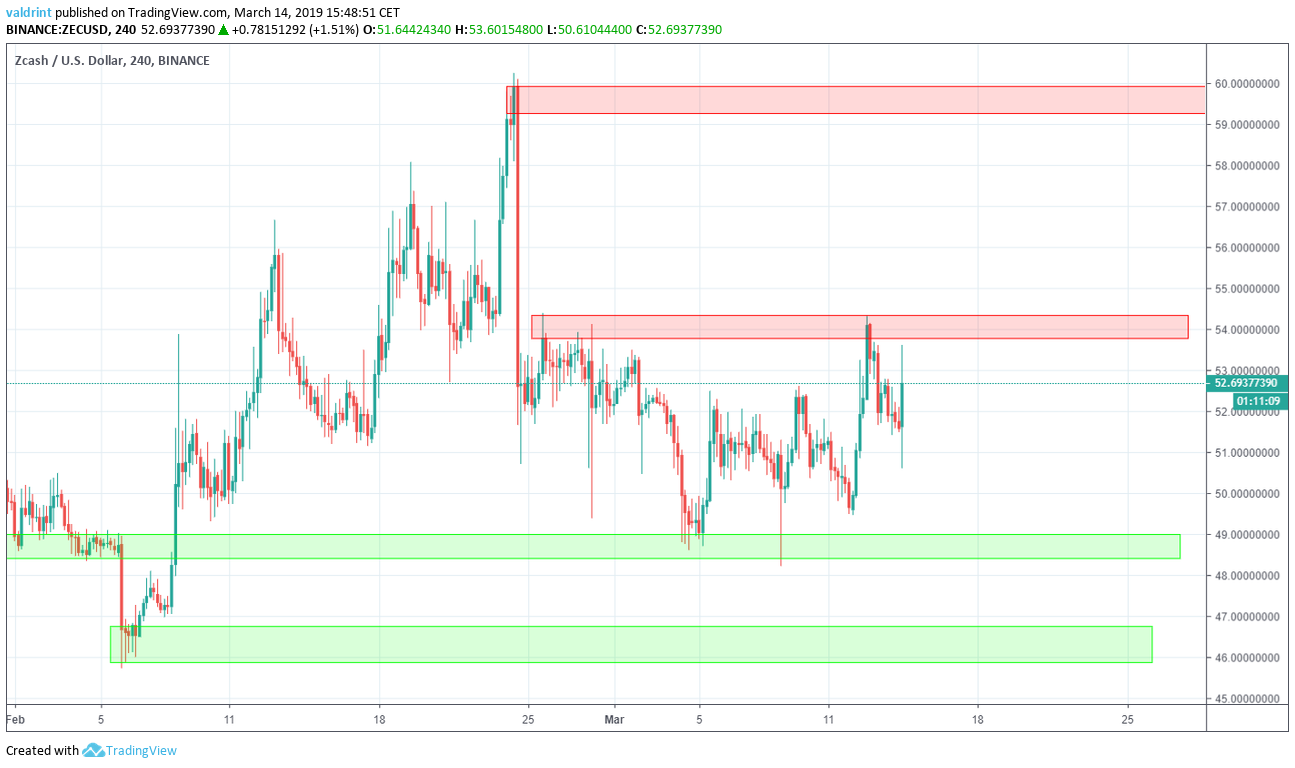
Summary of Analysis
Based on this analysis, the price will likely continue trading inside of the ascending triangle on an upward trend. At a certain period in the near future, it will reach support. It is possible that at this point, a breakout will occur. This is especially true if a more rapid price increases lead price to break out of the resistance. However, we believe that the price will retrace from the support before a breakout. If the price touches the horizontal resistance line, this prediction will be partially validated. A breakout at this point would also partially validate the prediction. Full validation would require the price to retrace from resistance before breaking out. When do you think the price of ZEC will break out of the triangle? Let us know in the comments below. Disclaimer: This article is not trading advice and should not be construed as such. Always consult a trained financial professional before investing in cryptocurrencies, as the market is particularly volatile.
Top crypto projects in the US | April 2024
Trusted
Disclaimer
In line with the Trust Project guidelines, this price analysis article is for informational purposes only and should not be considered financial or investment advice. BeInCrypto is committed to accurate, unbiased reporting, but market conditions are subject to change without notice. Always conduct your own research and consult with a professional before making any financial decisions. Please note that our Terms and Conditions, Privacy Policy, and Disclaimers have been updated.

Valdrin Tahiri
Valdrin discovered cryptocurrencies while he was getting his MSc in Financial Markets from the Barcelona School of Economics. Shortly after graduating, he began writing for several different cryptocurrency related websites as a freelancer before eventually taking on the role of BeInCrypto's Senior Analyst.
(I do not have a discord and will not contact you first there. Beware of scammers)
READ FULL BIO
Sponsored
Sponsored