

The Zcash (ZEC) price is currently in the process of breaking out from a long-term resistance area that has been in place since Aug. 2018.
Both technical indicators and the price action support the possibility of Zcash breaking out.
Zcash Long-Term Levels
The weekly chart shows that ZEC is currently trading inside a long-term resistance area at $105. It hasn’t reached a close above this level since August 2018.
However, this its third attempt at breaking out. Technical indicators are bullish and support the possibility that ZEC will be successful this time around.
If so, the next important resistance areas would be found at $346 and $550. These targets are the 0.382 and 0.618 Fib retracement levels of the entire downward move, measuring from the all-time high price in 2018.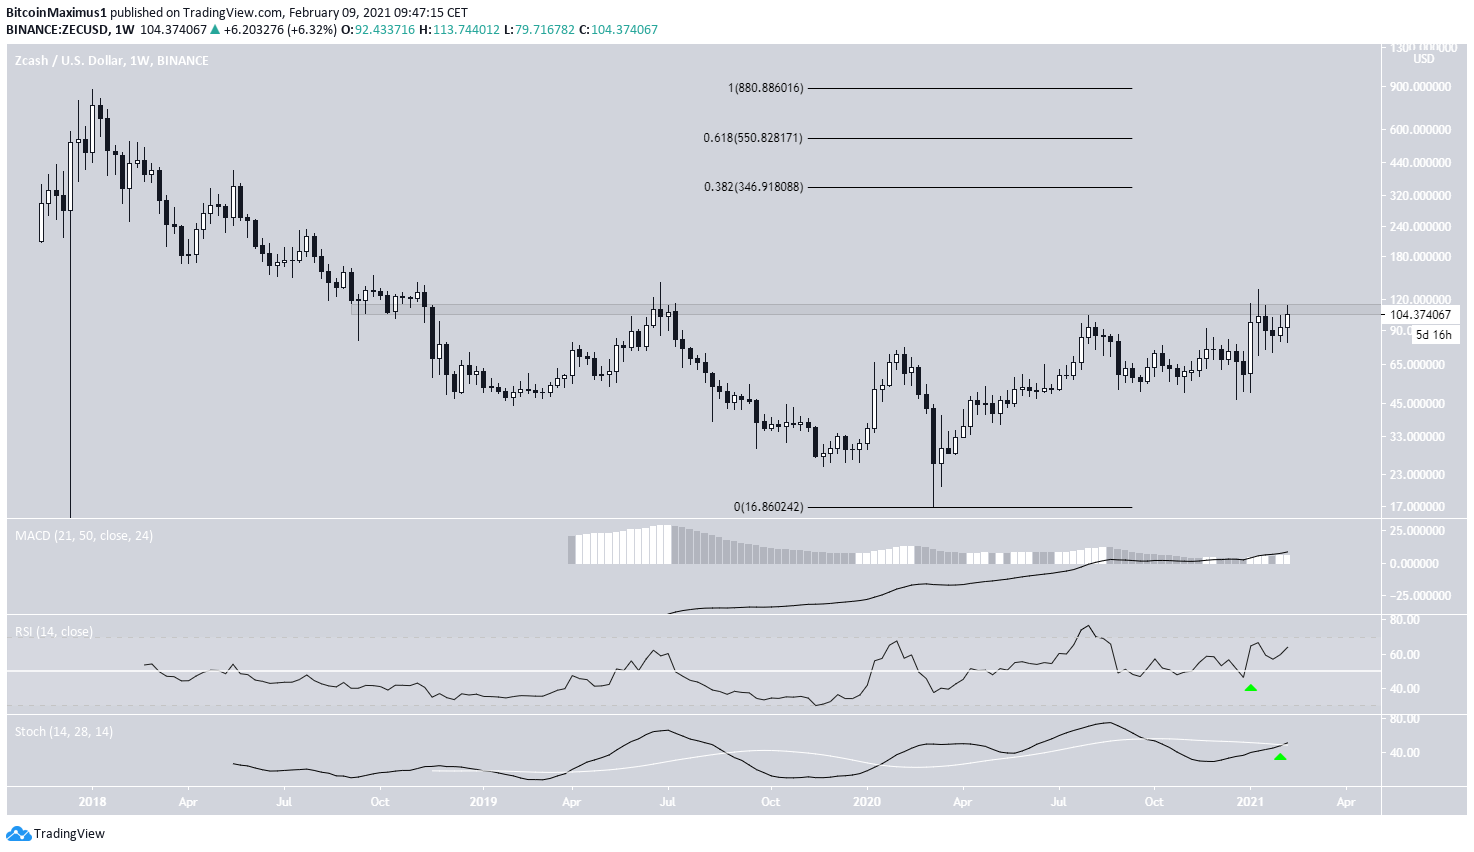 ZEC Chart By TradingView
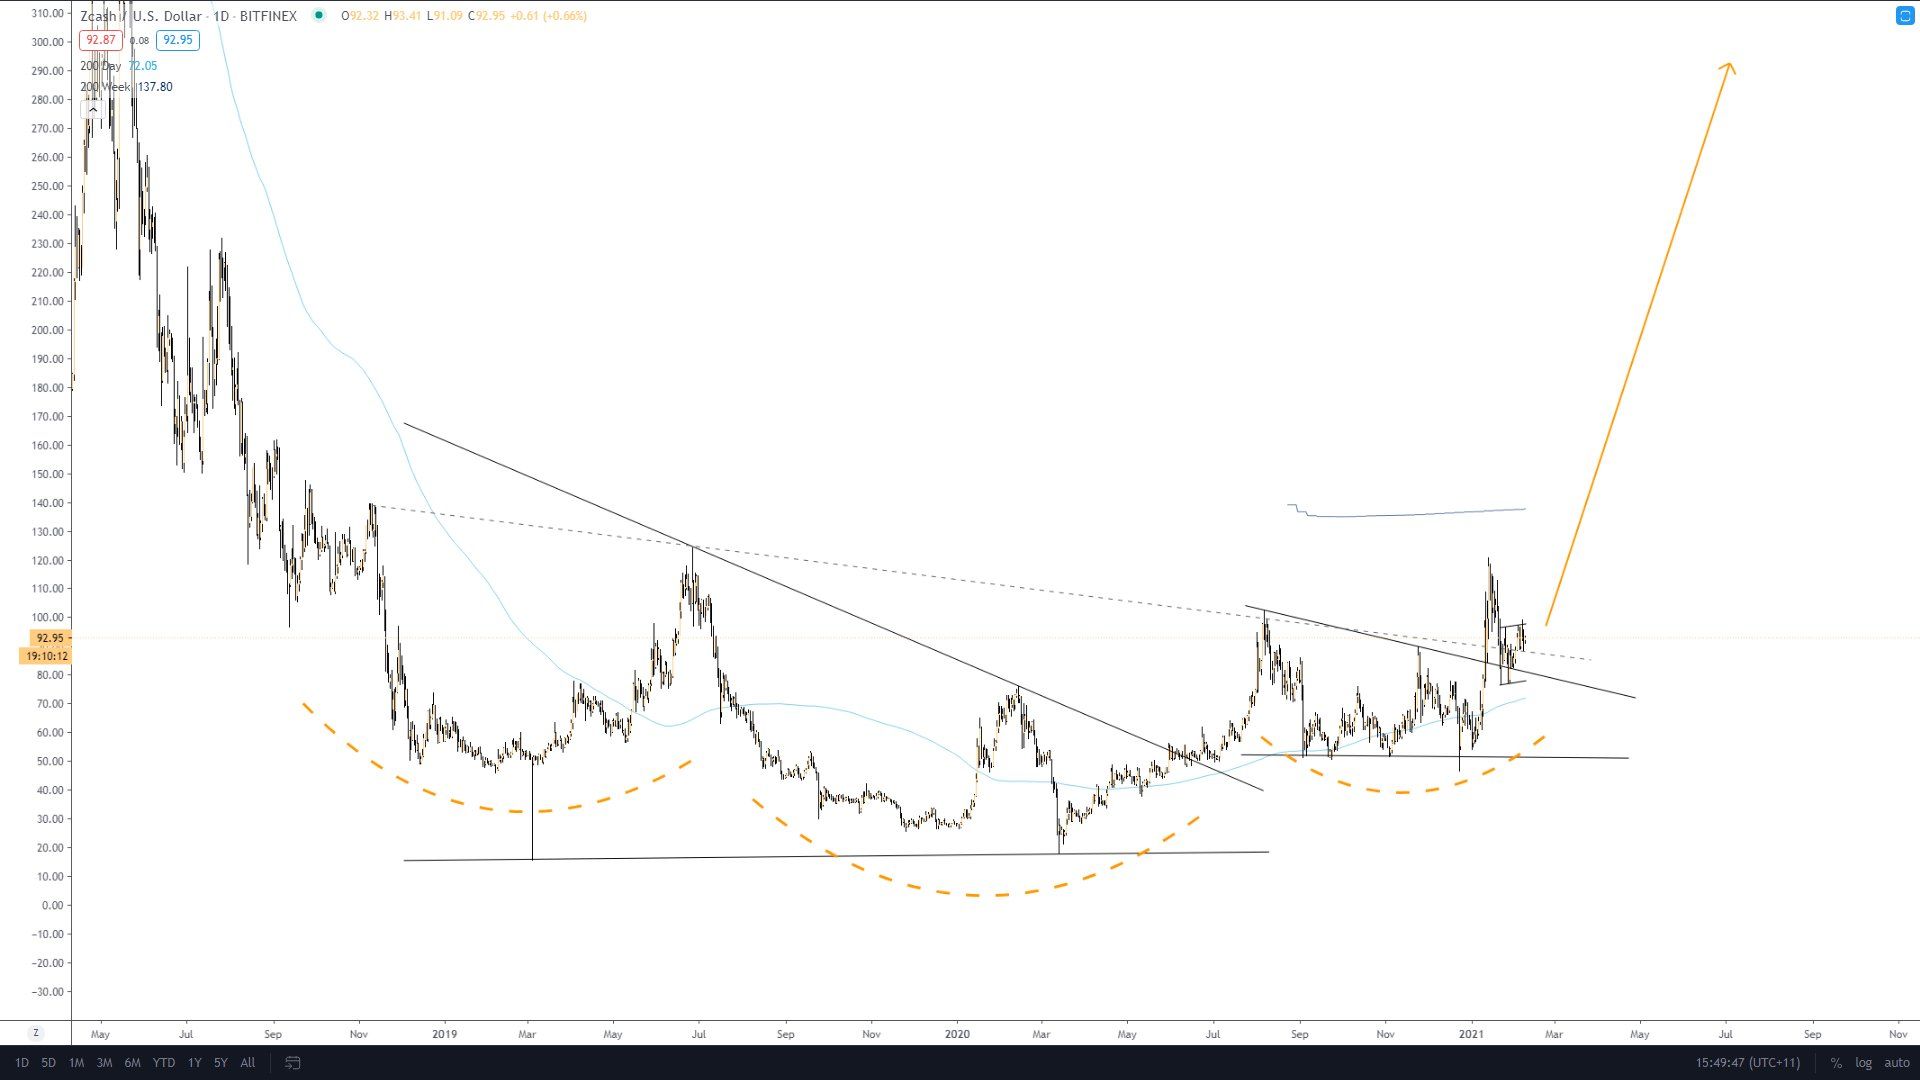
Cryptocurrency trader @ELDtrades outlined a Zcash chart, which shows a long-term bullish pattern (inverse head and shoulders) developing. This pattern could carry ZEC above $200.
The neckline of the pattern nearly coincides with our target $105 resistance area.
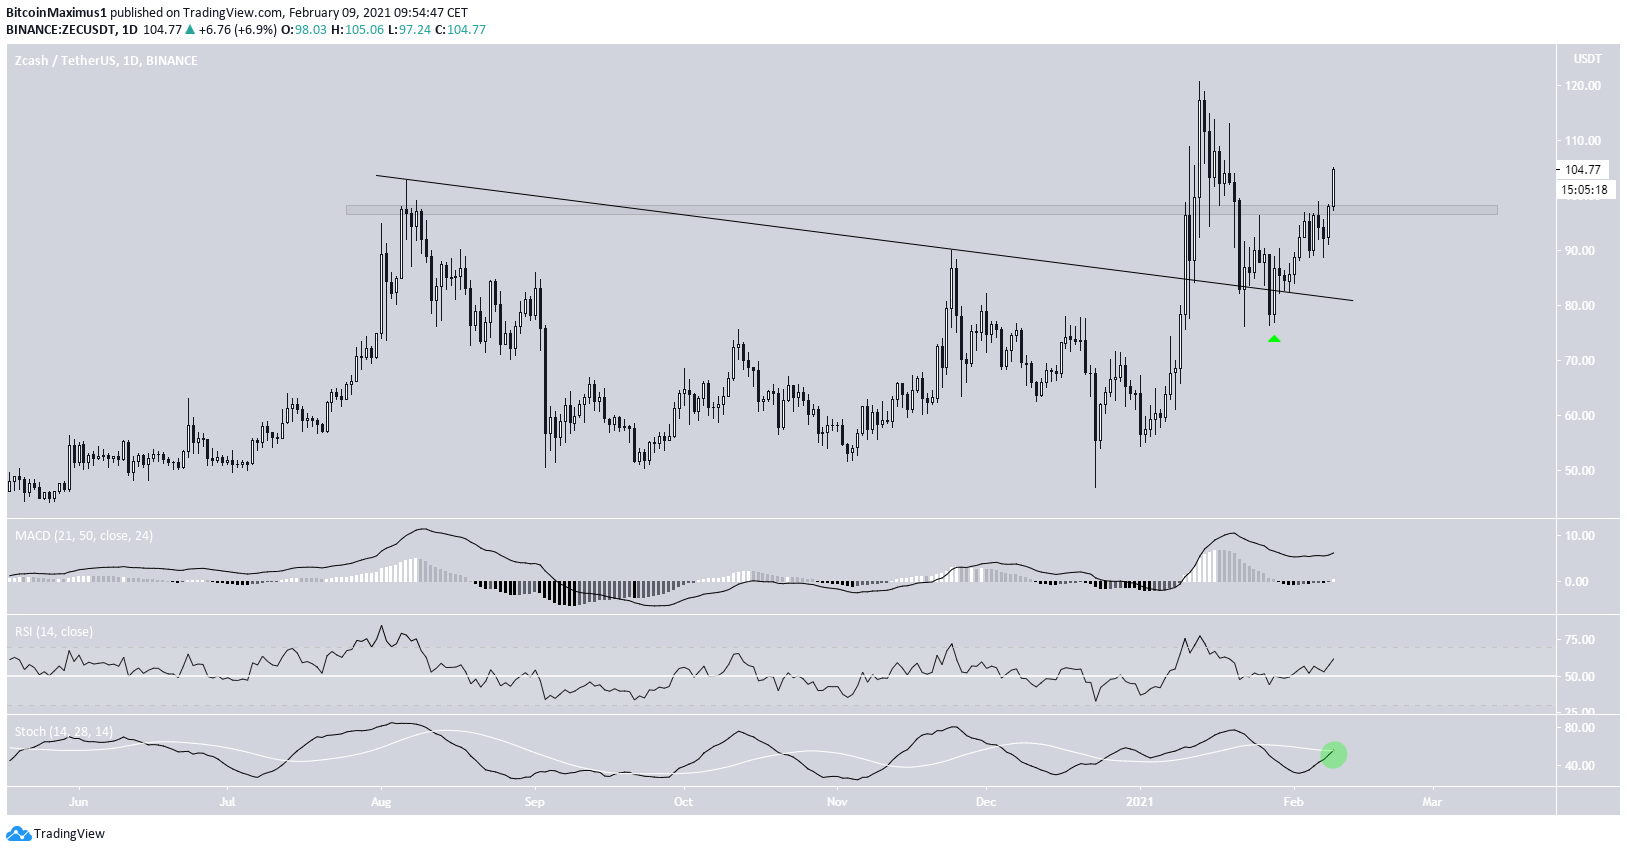
Current Movement
The daily chart supports the possibility of a breakout and a significant upward move.
ZEC has already broken out from a descending resistance line and validated it as support after (green arrow).
ZEC continued its upward move and has now reclaimed the previous resistance area at $98.
Technical indicators are also bullish, supporting the possibility that ZEC will resume its upward movement.
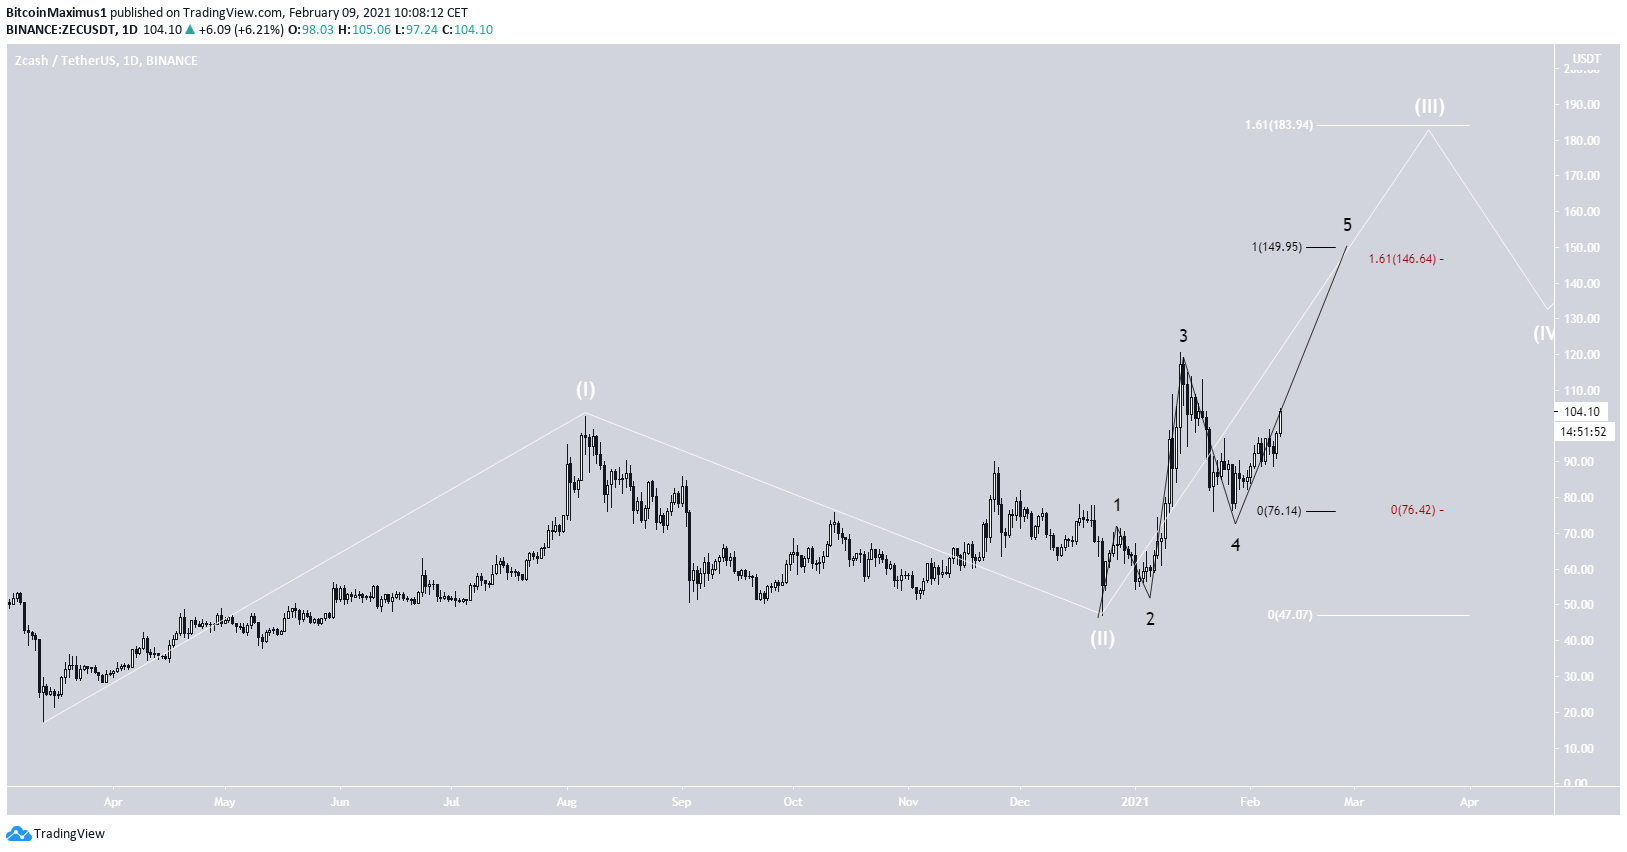
Wave Count
The wave count suggests that ZEC is in wave three (shown in white below) of a bullish impulse that began with the March 2020 lows. The sub-wave count is shown in black, indicating that ZEC is in sub-wave five.
The most likely target for the top of this move is located between $146.50-$149.50, found by using a Fib projection and external retracement.
If wave three (white) extends, ZEC could reach $183 before decreasing.
At the current time, we cannot yet determine if this is a 1-2/1-2 formation or if wave three will extend.
ZEC/BTC
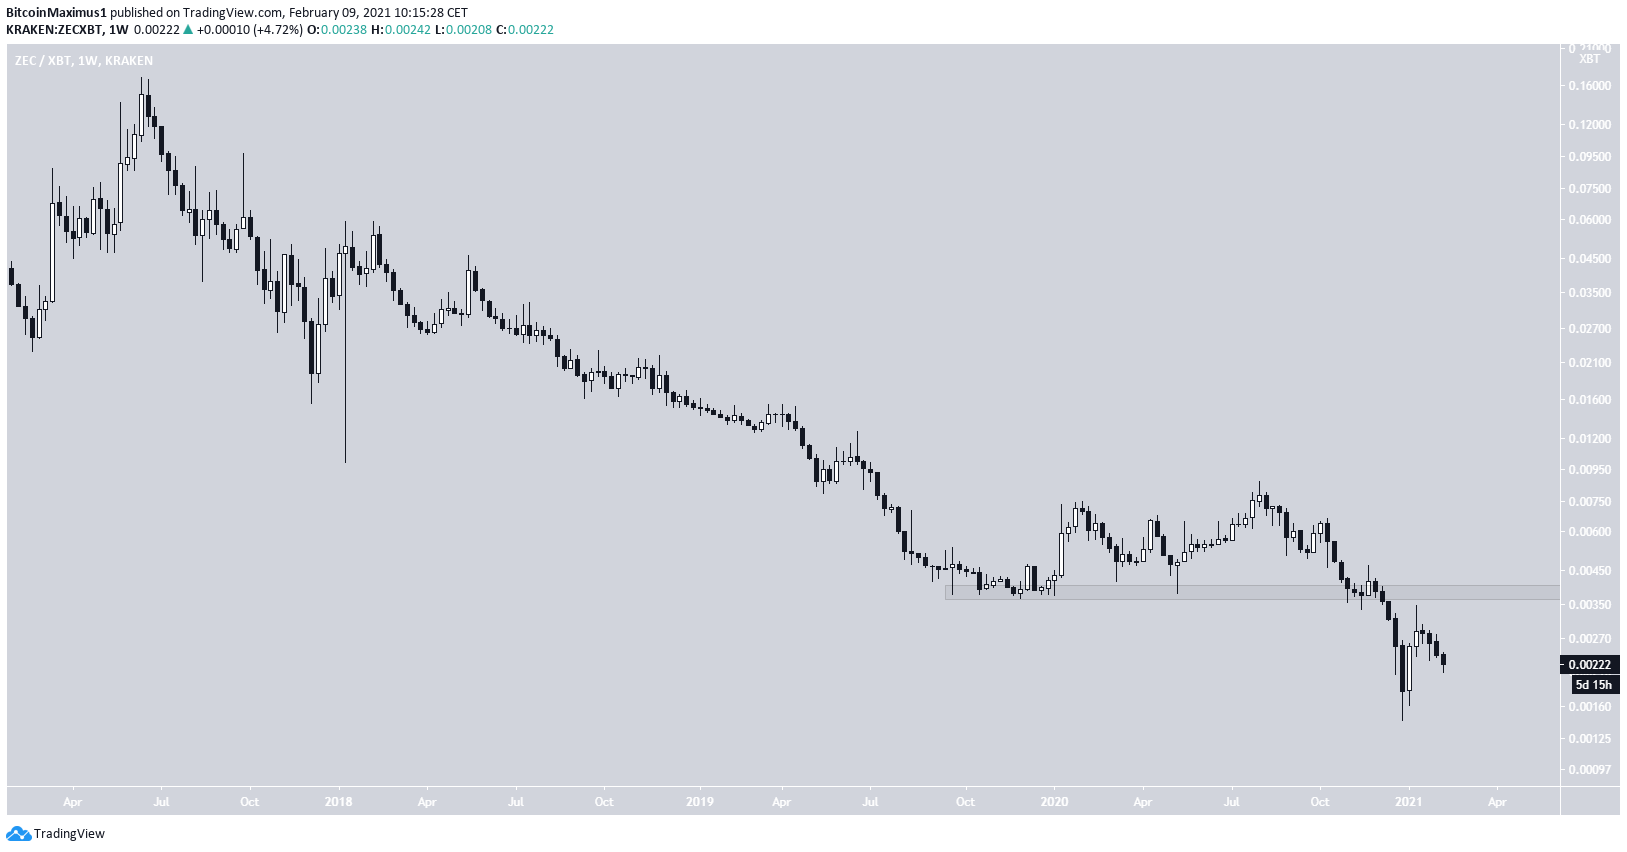
ZEC/BTC has been consistently decreasing since June 2017 and reached an all-time low of ₿0.00145 in December 2020.
While ZEC has been increasing since then, it is still trading below the previous breakdown level at ₿0.0037.
Until ₿0.0037 is reclaimed, we cannot consider the trend bullish.
Conclusion
ZEC/USD is expected to break out from the $105 area and gradually move towards at least $132.
The ZEC/BTC trend is considered bearish until ₿0.0037 is reclaimed.
For BeInCrypto’s latest Bitcoin (BTC) analysis, click here
Trusted
Disclaimer
In line with the Trust Project guidelines, this price analysis article is for informational purposes only and should not be considered financial or investment advice. BeInCrypto is committed to accurate, unbiased reporting, but market conditions are subject to change without notice. Always conduct your own research and consult with a professional before making any financial decisions. Please note that our Terms and Conditions, Privacy Policy, and Disclaimers have been updated.
