

The Zcash (ZEC) price has broken out from a descending resistance line and increased considerably throughout November.
ZEC is expected to continue its ascent towards the resistance levels outlined below.
ZEC Breaks Out
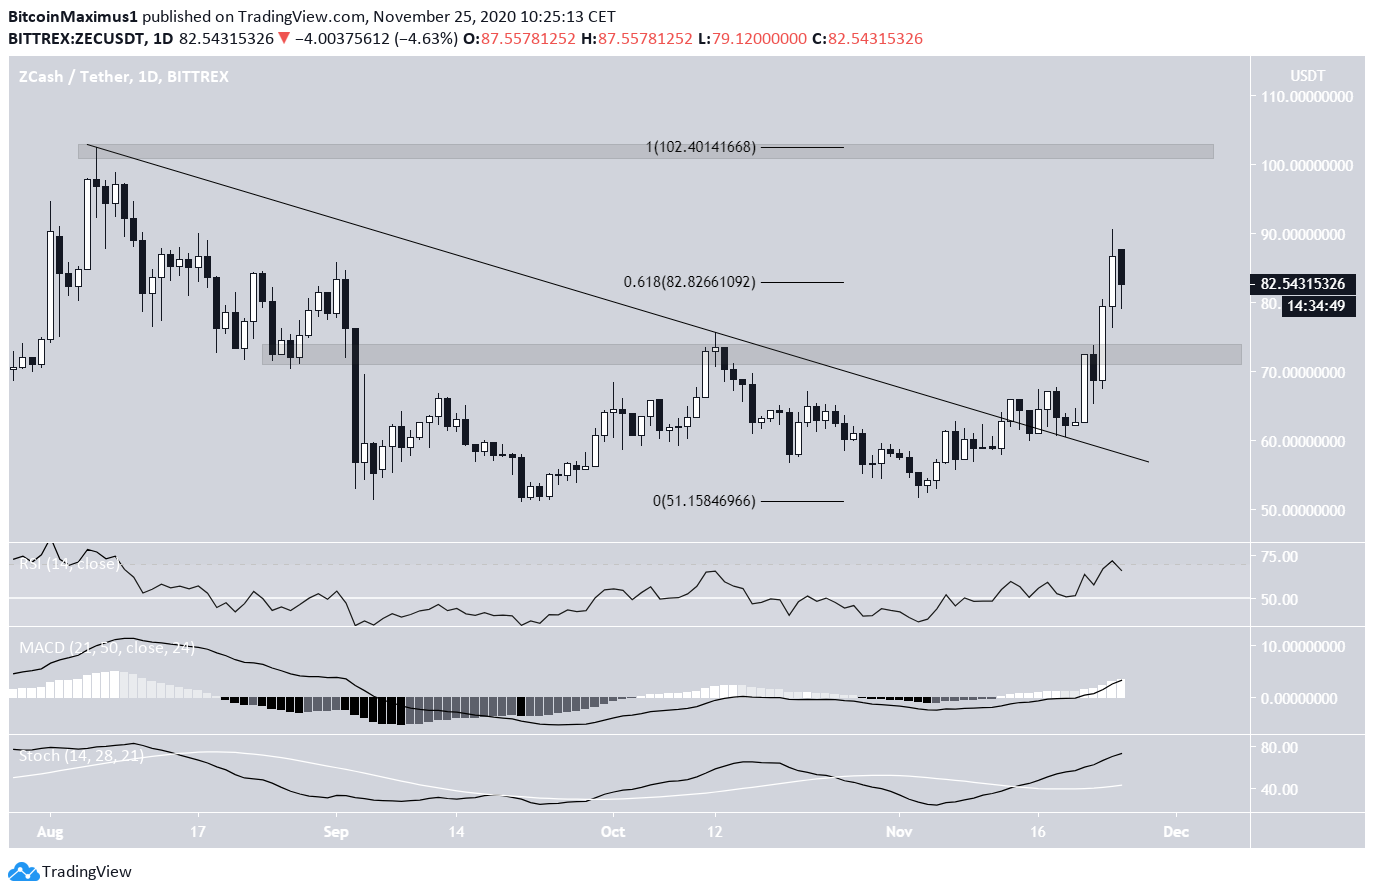
The ZEC price has been increasing since Nov. 3, when it reached a low of $51.69.
Shortly afterward, the price broke out from a descending resistance line that had been in place since Aug. 5, validated it as support, and has been increasing at an accelerated rate since.
The price has already broken out from the $72 resistance area and has even moved above the 0.618 Fib resistance level at $82.80. The next closest resistance area is found at $102.40.
Technical indicators in the daily time-frame are bullish, supporting continuation toward $102.40.
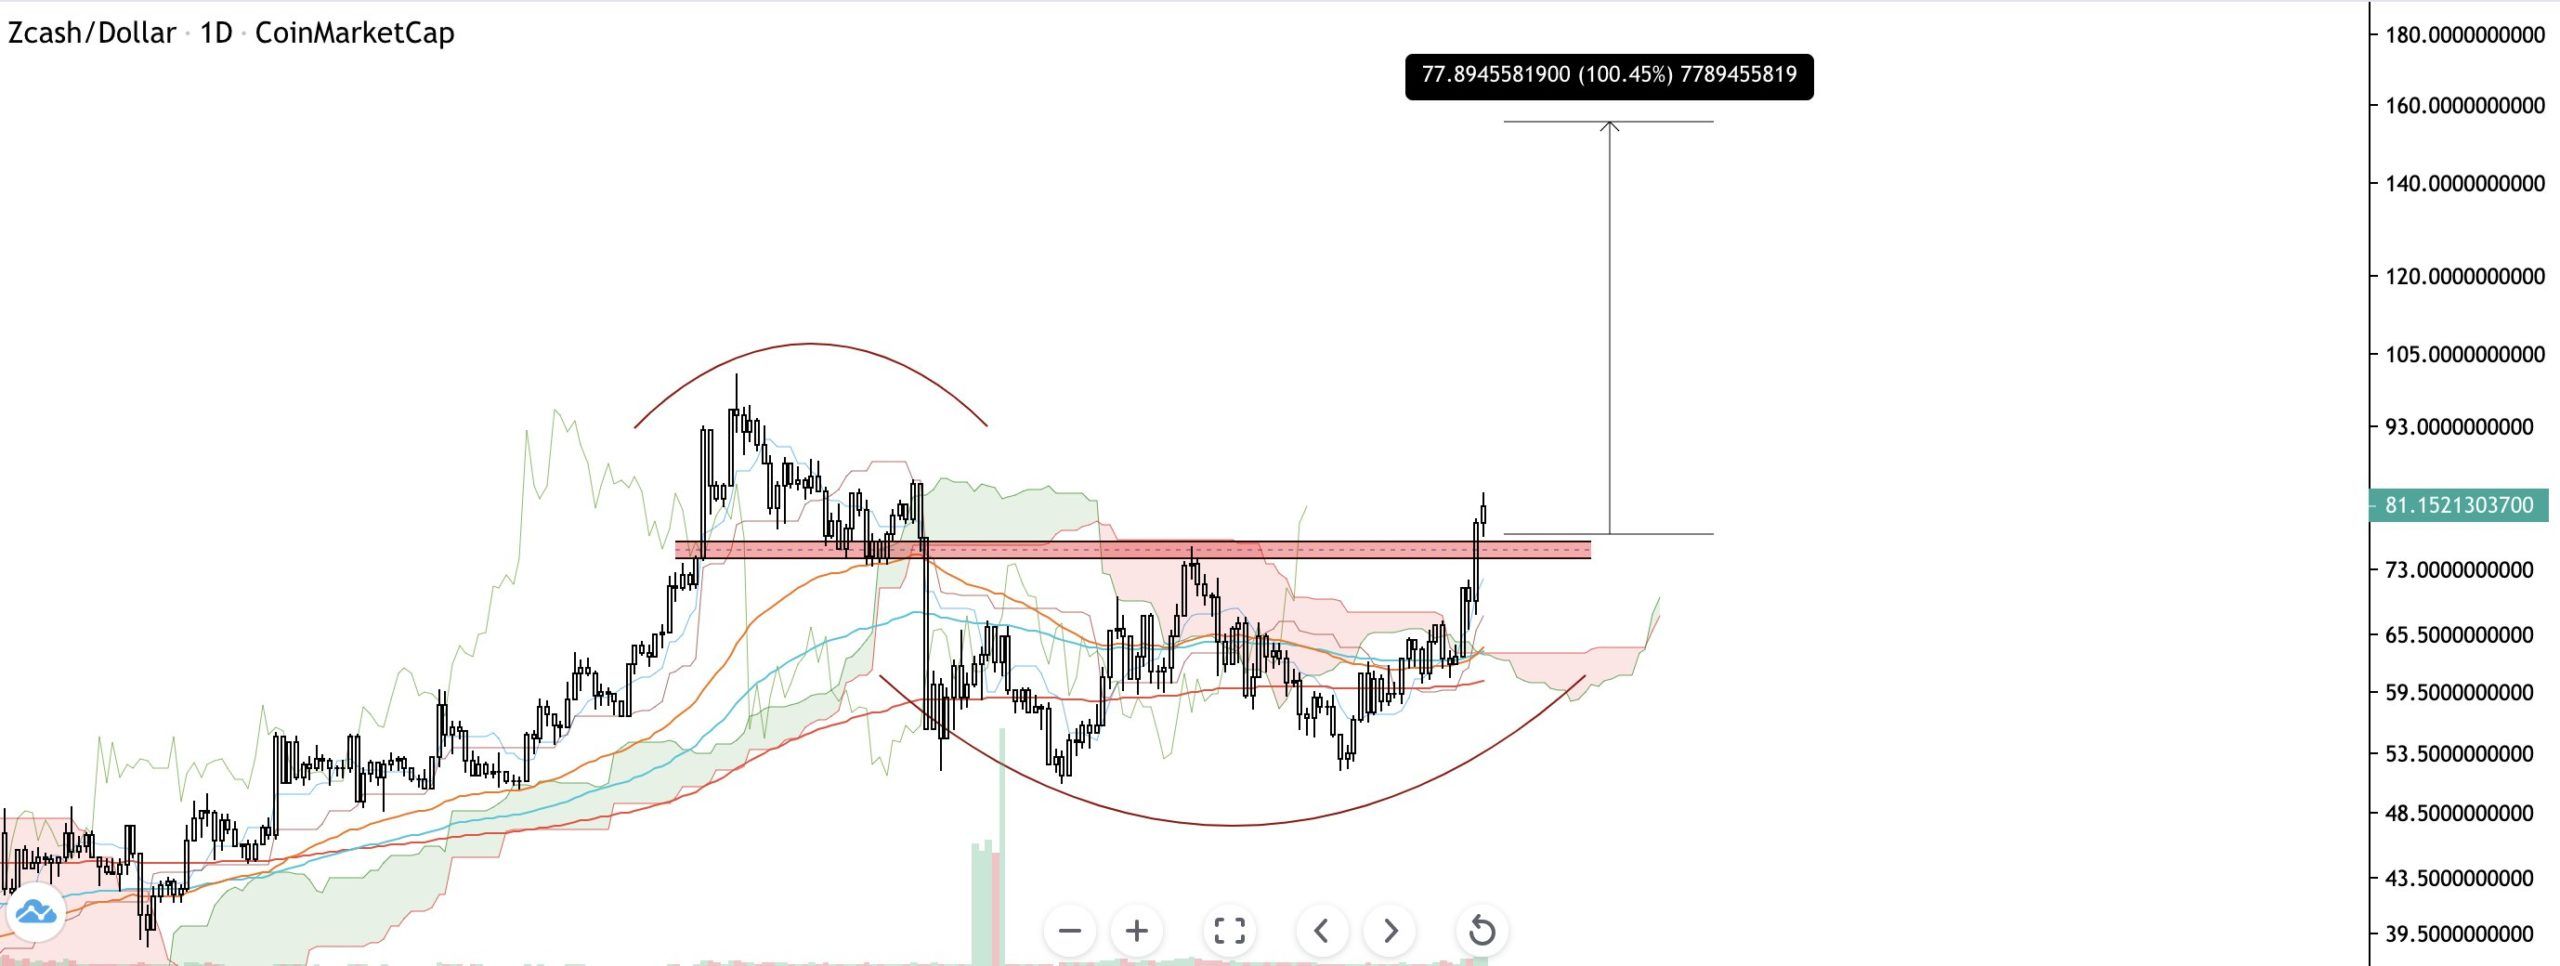
Cryptocurrency trader @CryptoNewton outlined a ZEC chart compared to XRP.
Newton predicted a 100% price increase that could take ZEC to $160.
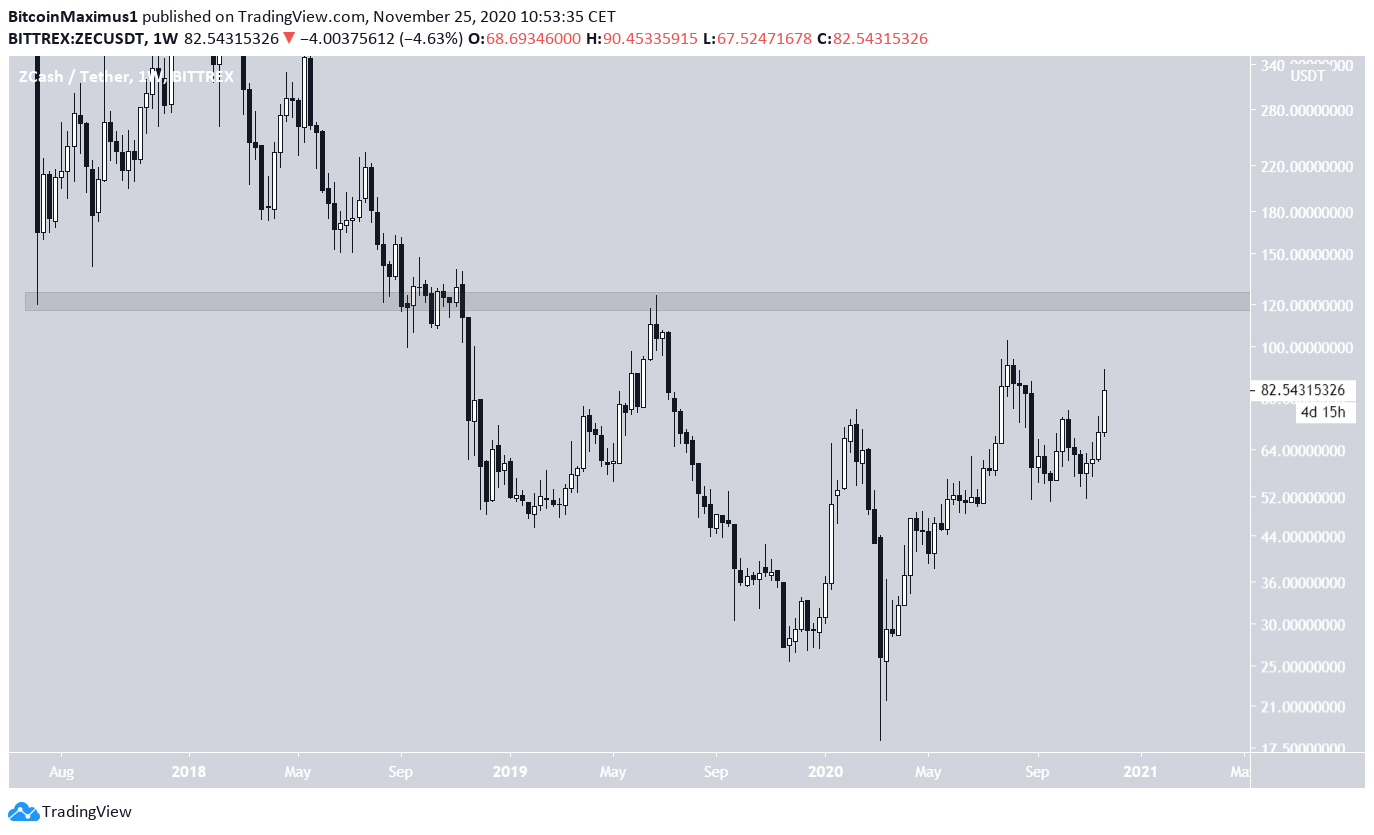
However, a look at the weekly chart shows a very strong resistance level at $120. At the current time, we cannot confidently predict a breakout above this level.
Future Movement
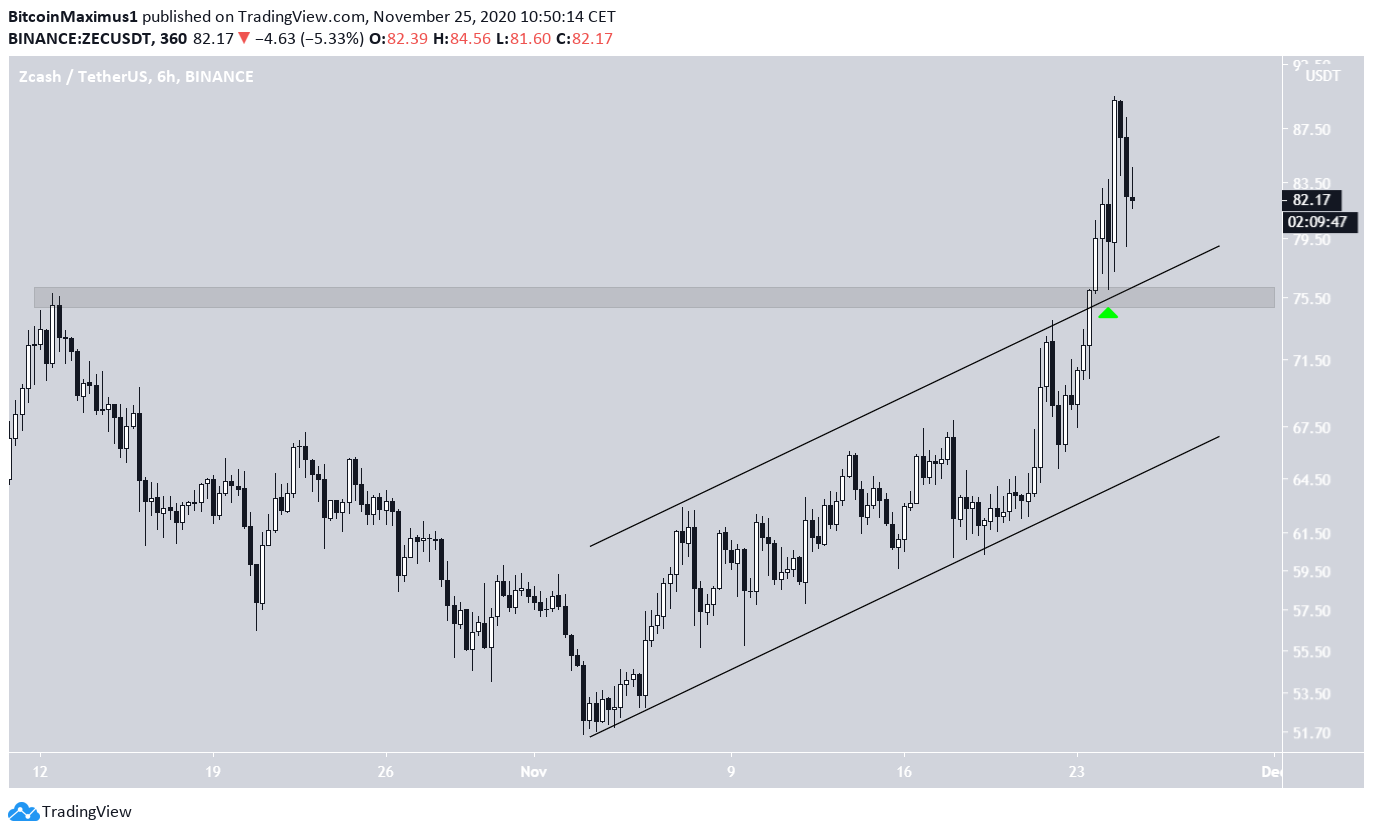
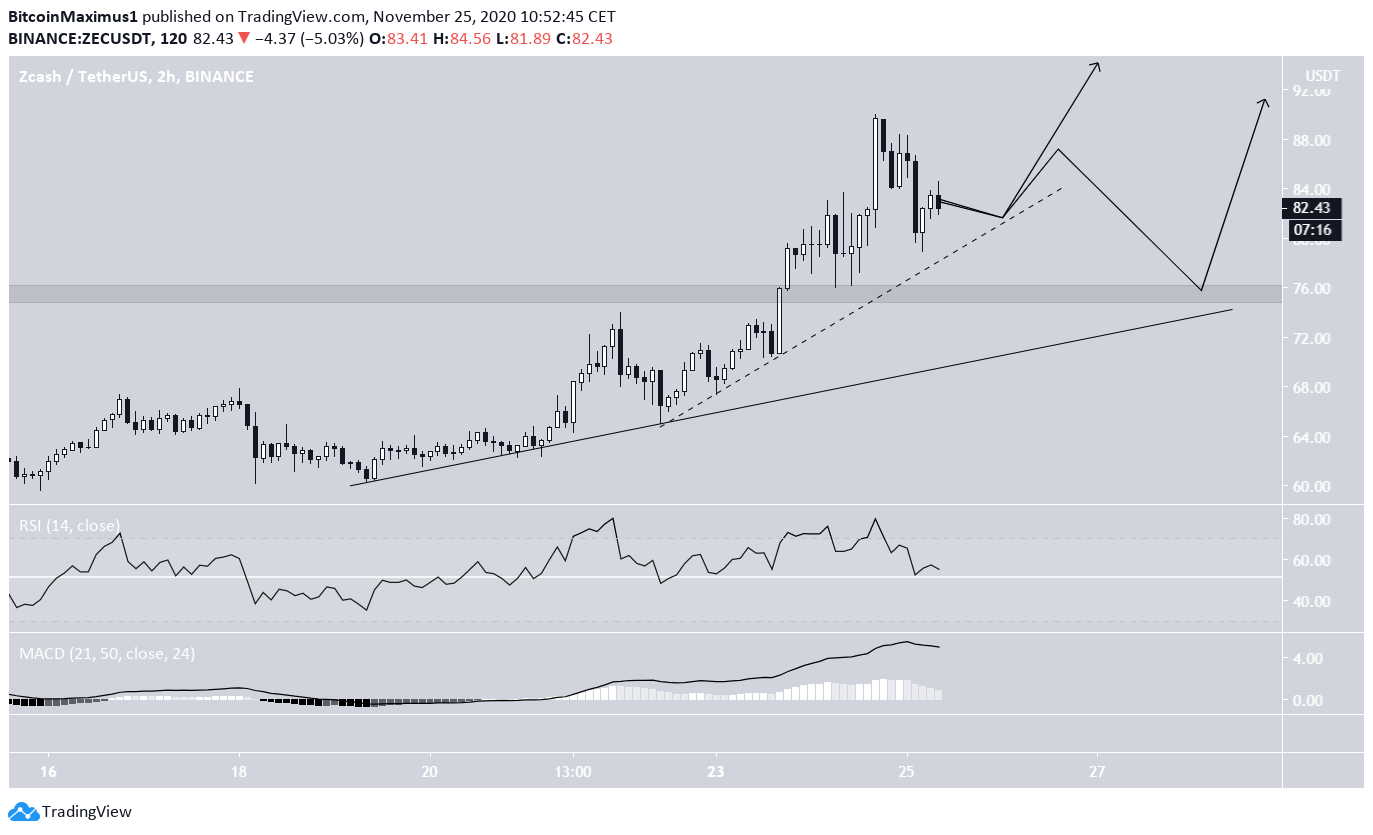
The shorter-term 6-hour chart shows that the price has broken out from a parallel ascending channel and validated its resistance line afterward (shown with the green arrow). This movement also served to validate the $76 area as support.
Breakouts from parallel channels often indicate that the price has begun a bullish impulse.
As long as ZEC is trading above the resistance line of the channel and the $76 area, it is expected to continue moving upwards.
The 2-hour chart shows the first signs of weakness since both the RSI and MACD are decreasing. However, the price is also following two ascending support lines (dashed and solid in the chart below).
The most likely move would be a re-test of at least one of these lines followed by a rally.
A decrease below the $76 area would mean that the trend is bearish, but that does not seem likely at this time.
Wave Count
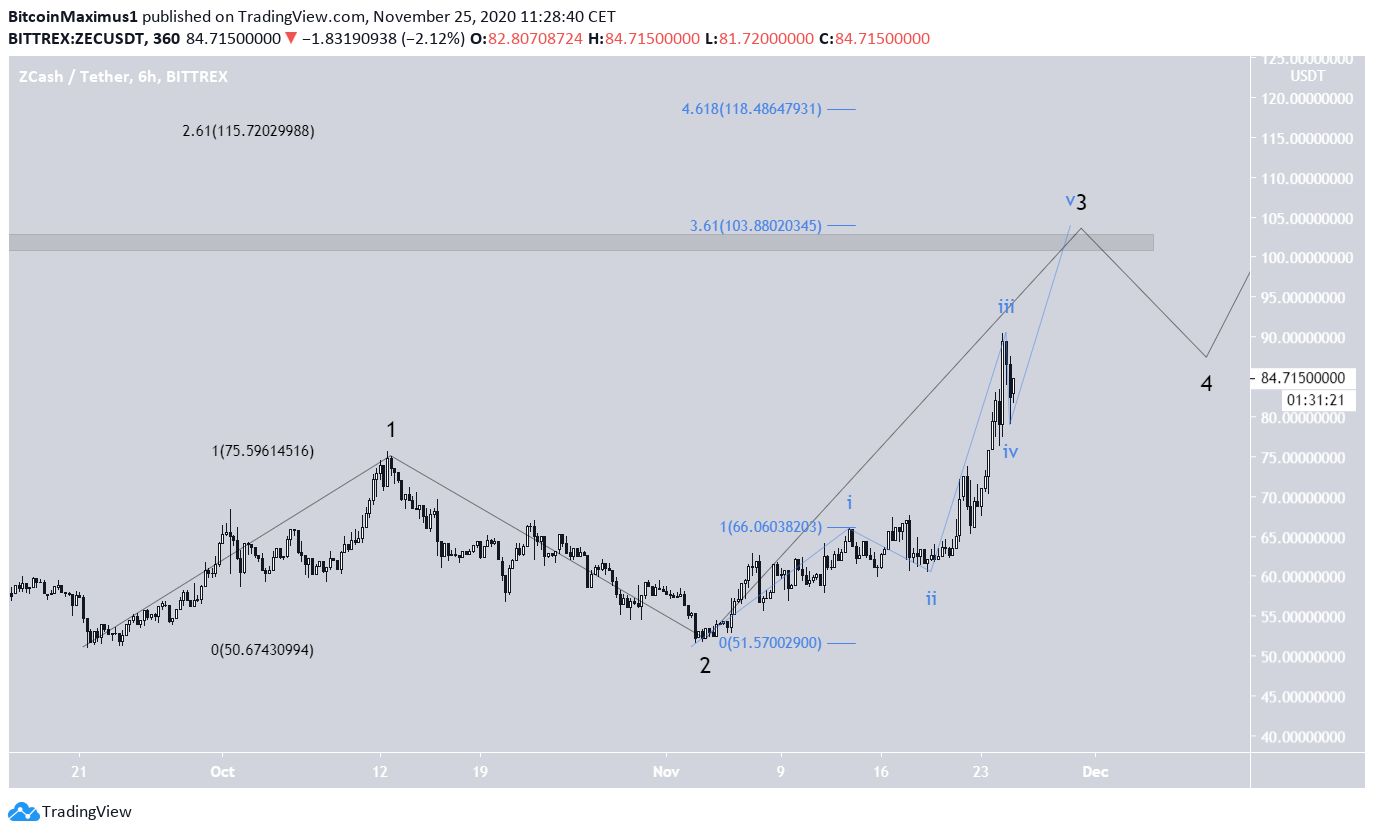
The ZEC wave count since the Sept. 21 low suggests that the price is in wave 3 of a five-wave bullish impulse (shown in black below).
Inside wave 3, the price is also likely in the third sub-wave (blue).
There are two possible targets for the top of wave 3:
- The $102-$104 area, created by the previously mentioned horizontal resistance level and the 3.61 Fib extension of sub-wave 3 (blue).
- The $115-118 area, created by the 2.61 Fib extension of wave 1 (black) and the 4.61 Fib extension of sub-wave 1 (blue).
After waves 3 and 4 are complete, ZEC is expected to complete another final upward move.
Conclusion
The ZEC price is expected to continue its upward move, reach the $104 resistance area, and possibly break out.
For BeInCrypto’s previous Bitcoin analysis, click here!
Disclaimer: Cryptocurrency trading carries a high level of risk and may not be suitable for all investors. The views expressed in this article do not reflect those of BeInCrypto
Trusted
Disclaimer
In line with the Trust Project guidelines, this price analysis article is for informational purposes only and should not be considered financial or investment advice. BeInCrypto is committed to accurate, unbiased reporting, but market conditions are subject to change without notice. Always conduct your own research and consult with a professional before making any financial decisions. Please note that our Terms and Conditions, Privacy Policy, and Disclaimers have been updated.
