

Yearn.Finance (YFI) is currently making an attempt at moving above the all-time high resistance area.
DFI.Money (YFII) is showing bullish reversal signs. However, it has to break out above $2540 to confirm the bullish trend reversal.
YFI
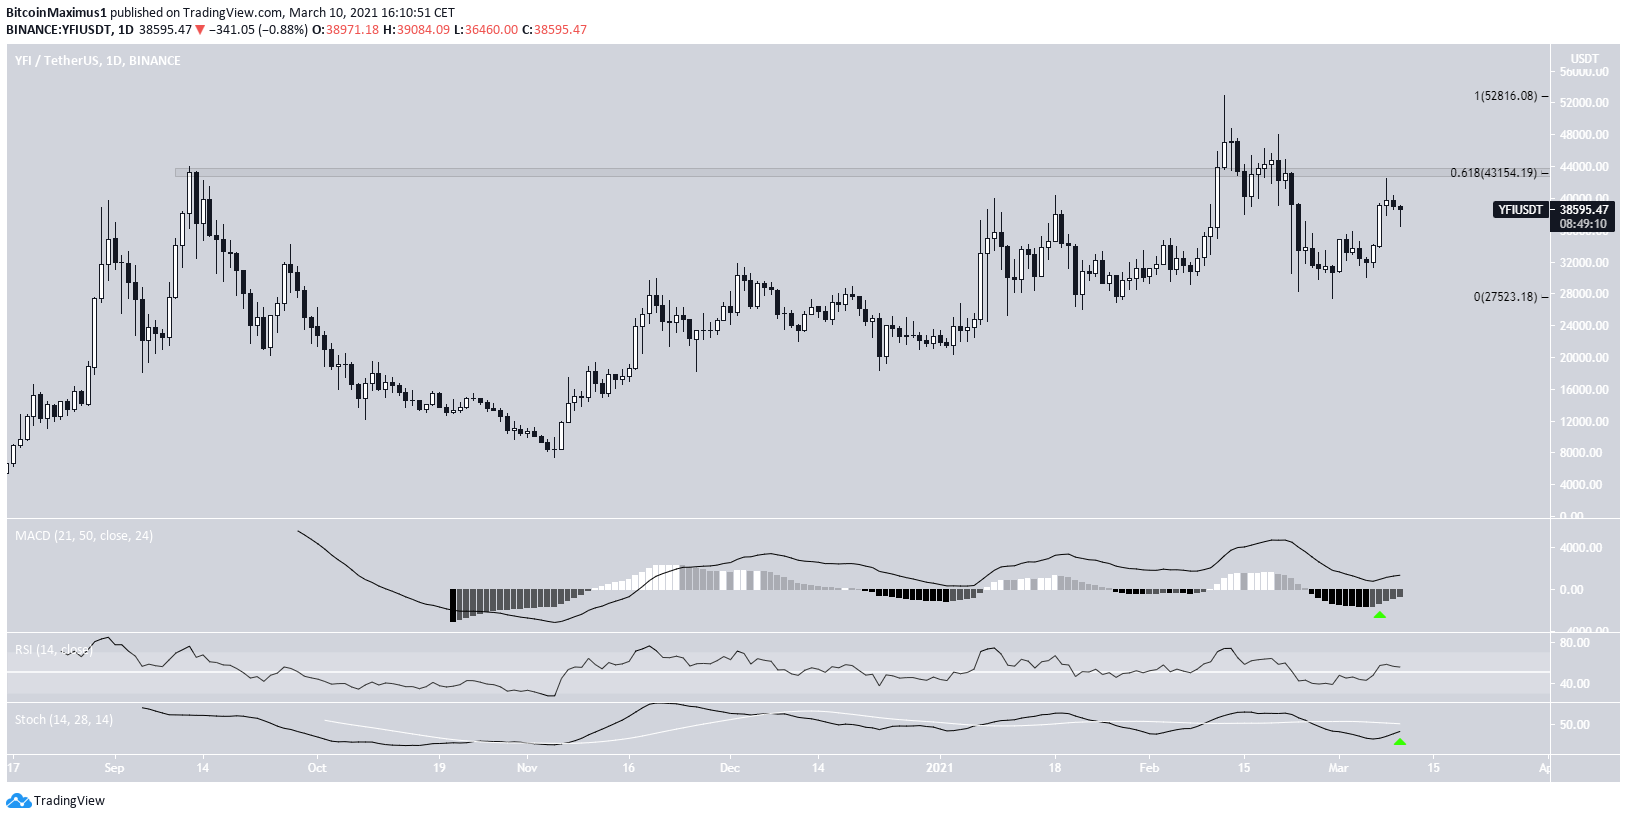
YFI has been moving downwards since attaining an all-time high price of $52,880.
However, it potentially reversed its trend after reaching a low of $27,437 on Feb. 28.
Technical indicators nearly confirm the trend reversal. Both the MACD & RSI have given bullish reversal signs, but the Stochastic oscillator has yet to make a bullish cross.
Nevertheless, there is strong resistance at $43,150. This level is both the previous all-time high price and the 0.618 Fib retracement of the most recent drop.
Therefore, until YFI reclaims it, we cannot consider the trend bullish.
Cryptocurrency trader @Altstreetbet outlined an YFI chart, stating that the price has begun a bullish impulse.

This does seem likely when looking at the six-hour chart, which shows that YFI has broken out from a descending resistance line. Furthermore, it has reclaimed the $36,600 area.
If YFI were to reach a new all-time high price, the next resistance would be found at $68,439.

YFII
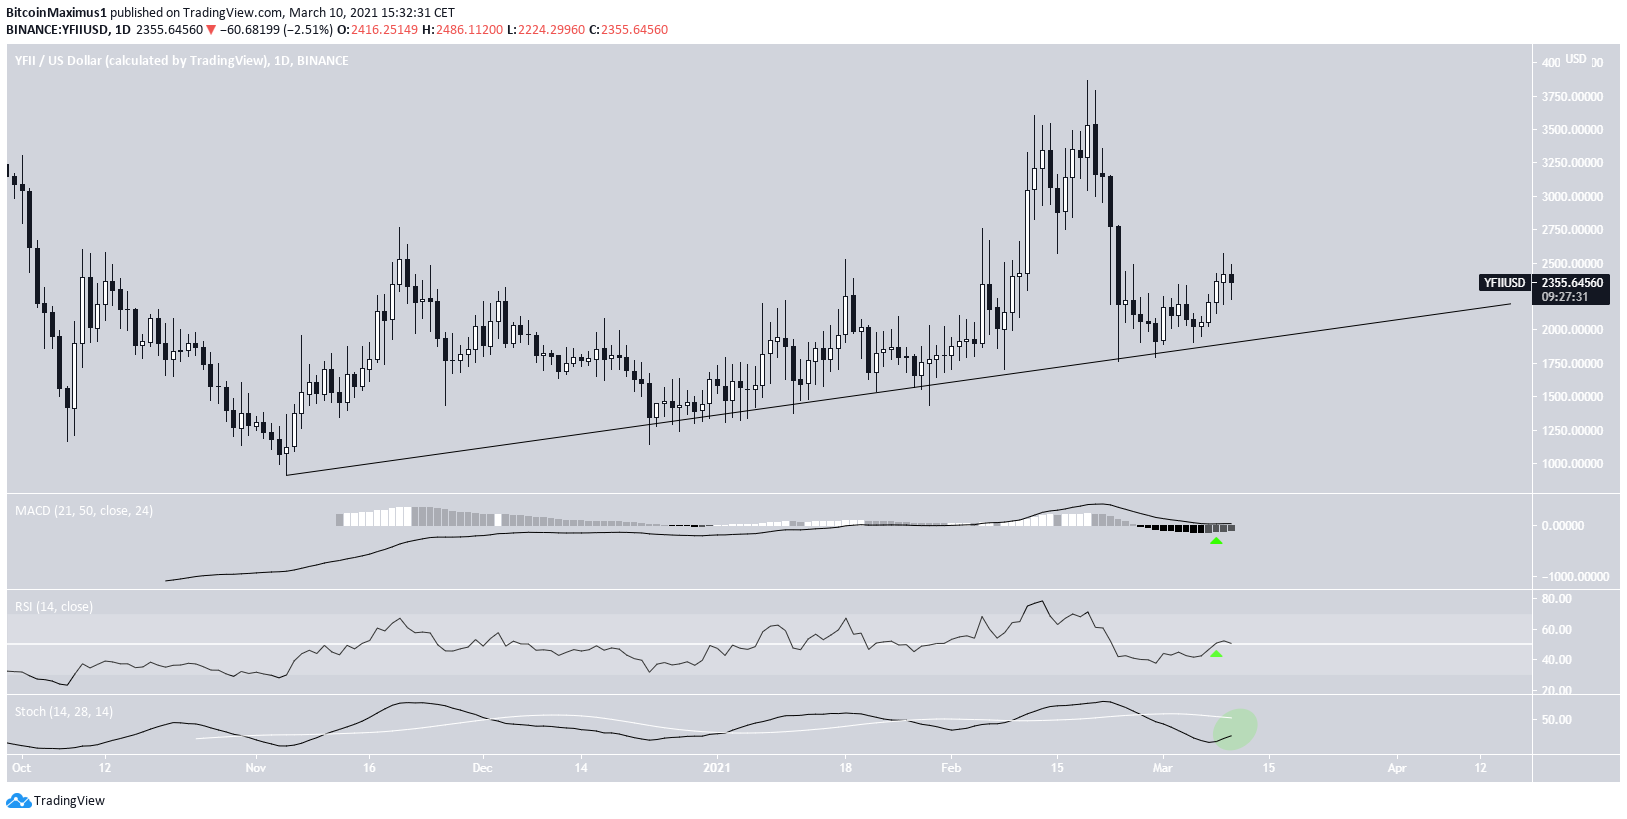
YFII has been following an ascending support line since Nov. 2020. Most recently, the line served to stop the decrease beginning on Feb. 19, 2021, creating a long lower wick in the process.
Nevertheless, the ongoing bounce has been very weak.
Despite this show of weakness, two out of three technical indicators are bullish. The MACD has given a bullish reversal signal and the RSI has crossed above 50.
If the Stochastic oscillator were to make a bullish cross, it would confirm the bullish trend reversal.
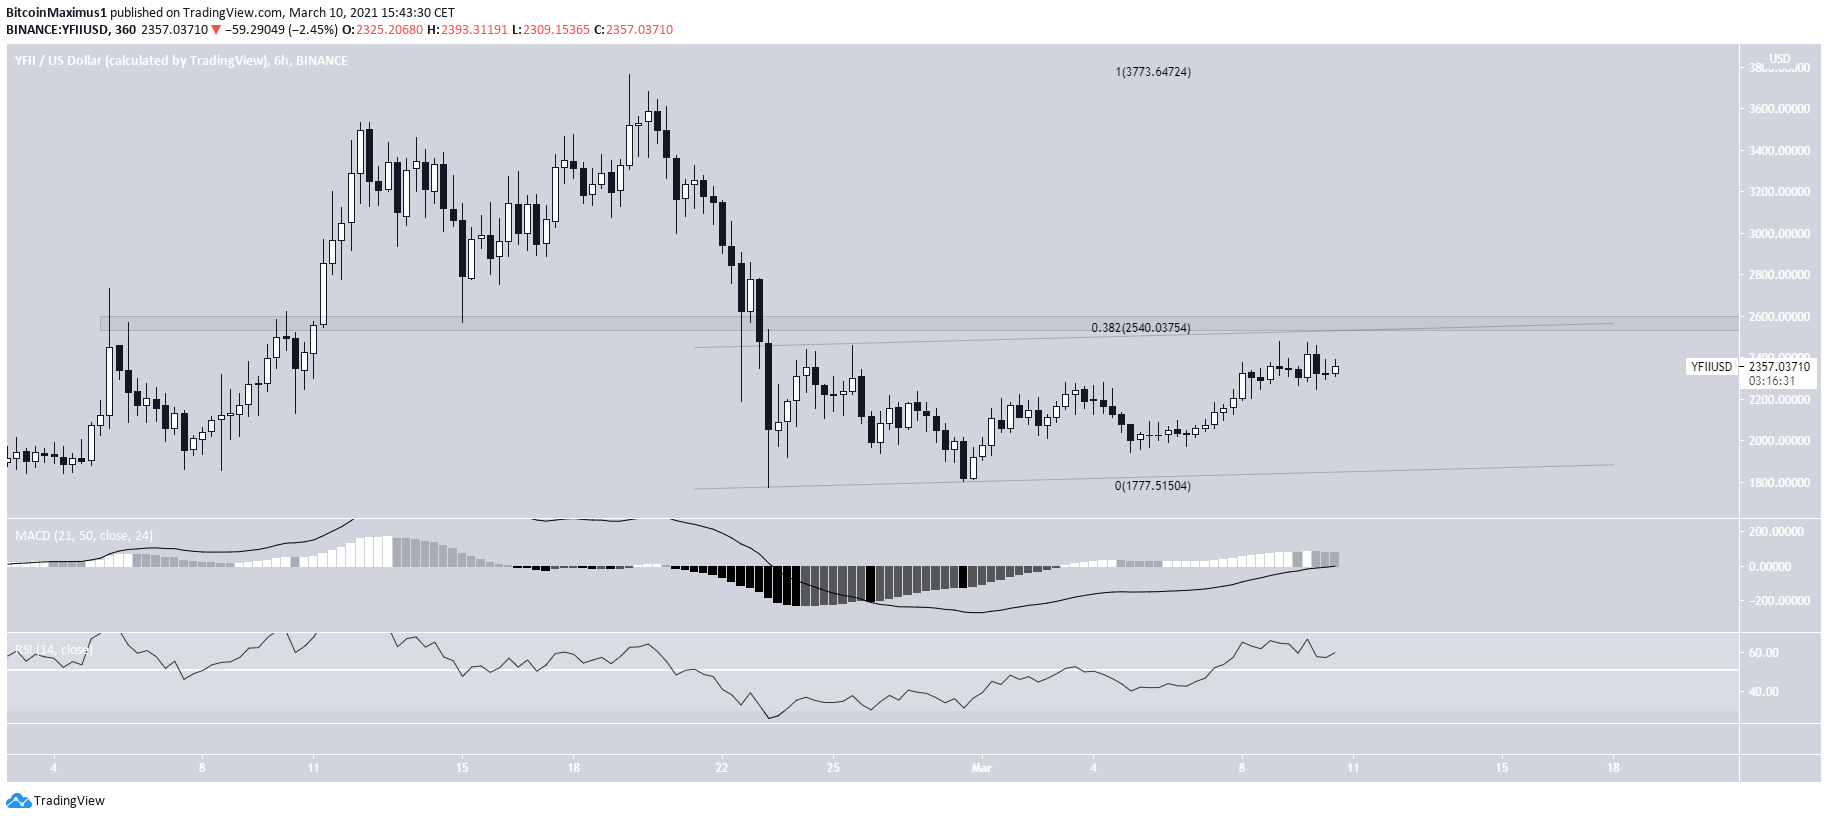
Despite the daily time-frame showing bullish reversal signs, short-term time-frames are still bearish.
Firstly, YFII is potentially trading inside a parallel ascending channel, a movement that is likely to be corrective.
The resistance line of the channel also coincides with the $2540 area. Besides intermittently acting as both resistance and support, the area is the 0.382 Fib retracement level of the most recent decrease.
Until YFII manages to break out above it, we cannot consider the trend bullish.
Nevertheless, similar to the daily time-frame, technical indicators in the six-hour time-frame are bullish.
Conclusion
To conclude, YFI is expected to gradually increase towards a new all-time high price.
While YFII is showing strong bullish reversal signs, it has to break out above $2540 in order for the trend to be considered bullish.
For BeInCrypto’s latest Bitcoin (BTC) analysis, click here.
Trusted
Disclaimer
In line with the Trust Project guidelines, this price analysis article is for informational purposes only and should not be considered financial or investment advice. BeInCrypto is committed to accurate, unbiased reporting, but market conditions are subject to change without notice. Always conduct your own research and consult with a professional before making any financial decisions. Please note that our Terms and Conditions, Privacy Policy, and Disclaimers have been updated.
