

Yearn.Finance (YFI) has been consolidating inside its current range since June. A movement outside of it is required in order to determine the direction of the trend.
YFI has been falling since reaching an all-time high price of $95,000 on May 12. The downward move led to a low of $17,700 on Dec 4 but it has been moving upwards since.
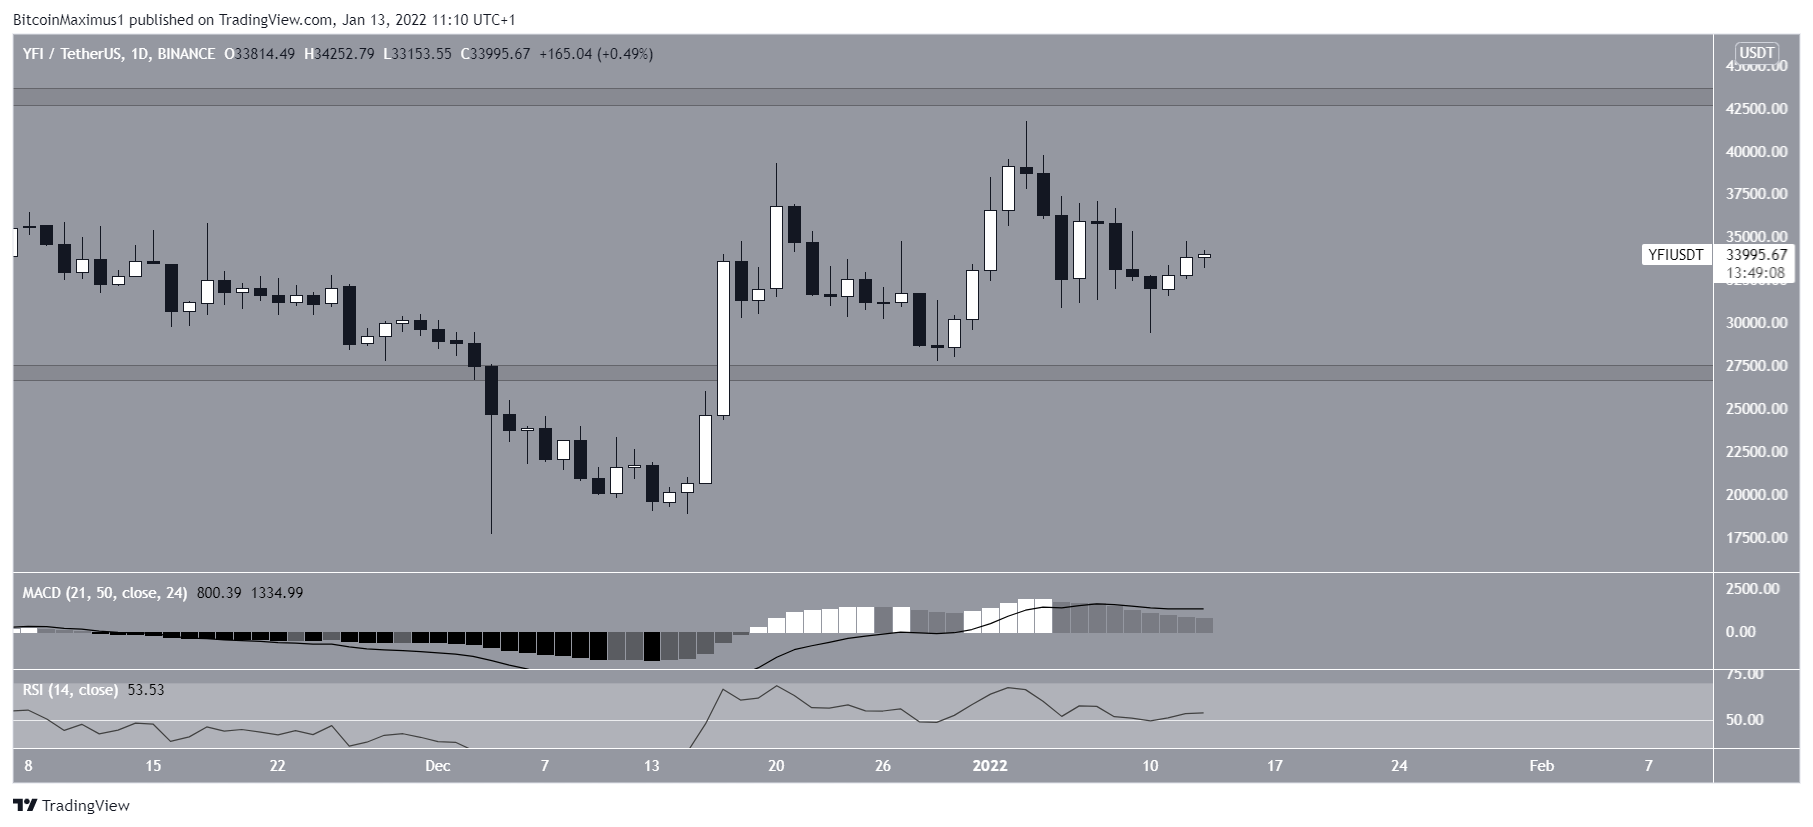
Currently, YFI is trading in the middle of its $27,500-$43,000 range. While the Dec 4 low caused a deviation below the support area of this range, it has reclaimed the level in what is a very bullish development.
However, despite the bounce, YFI is still 64% below its all-time high price.

Short-term YFI movement
Cryptocurrency trader @AltcoinSherpa tweeted a YFI chart, stating that it has potentially created a double top pattern.
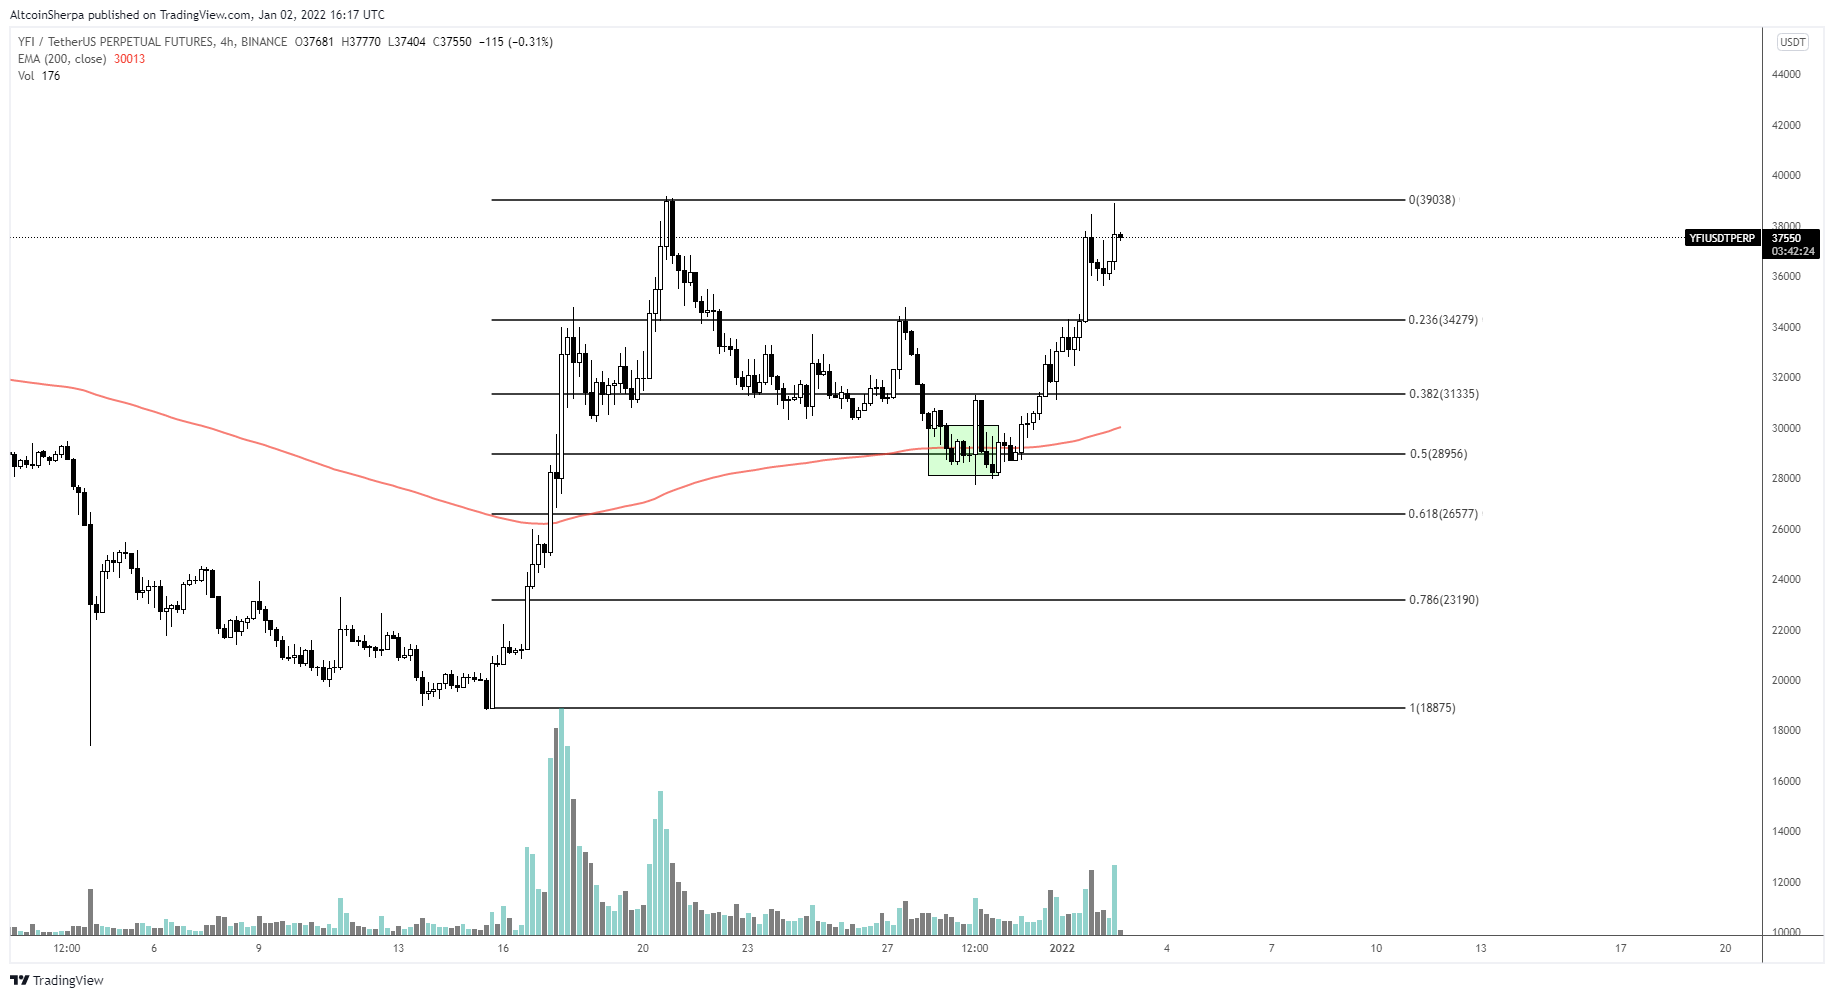
Since the tweet, YFI has completed a double top, which is normally considered a bearish pattern. In addition to this, both tops were made with long upper wicks, a sign of mounting selling pressure.
Technical indicators are still relatively bullish though. The MACD, which is created by short and long-term moving averages (MA), is positive. This means that the short-term MA is faster than the long-term average, a common trait of bullish trends.
Similarly, the RSI is just above 50. The RSI is a momentum indicator and readings above 50 are normally considered bullish.
While the lack of acceleration in these indicators suggests that the YFI trend has lost some of its strength, the readings indicate that the trend is still bullish.
Future movement
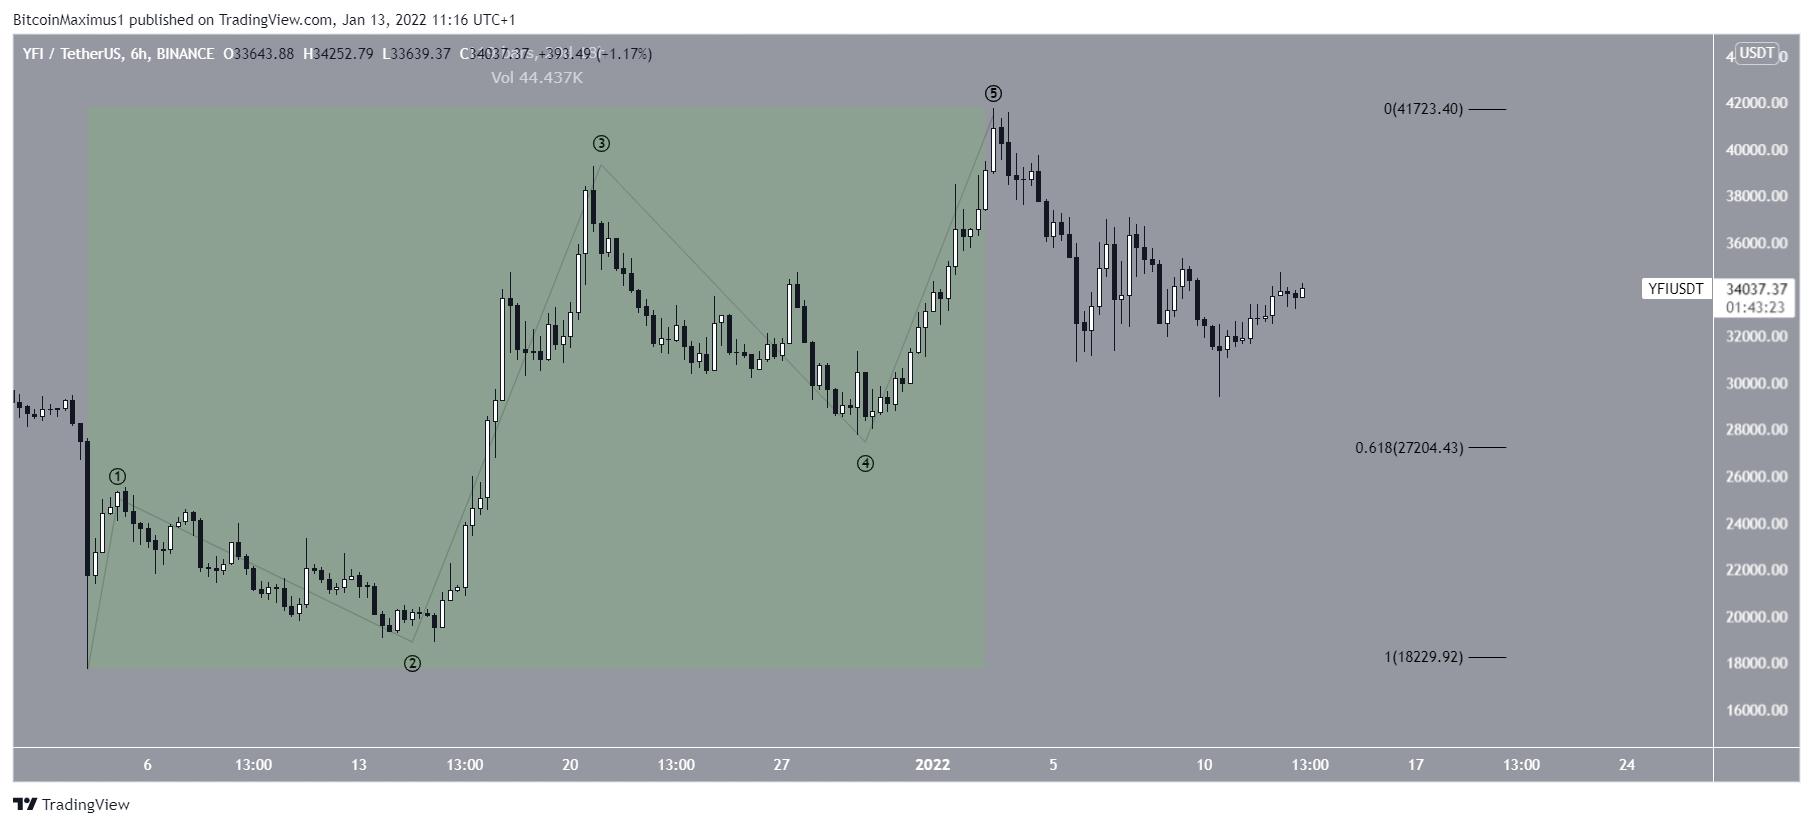
The increase since Dec 4 (highlighted) appears to have taken the shape of a five-wave upward move. If true, YFI is now correcting.
The main support area would be found at $27,200, created by the 0.618 Fib retracement support level. This also coincides with the bottom of the long-term trading range.
Therefore, the most likely scenario would have YFI bouncing at this level and making another attempt at moving towards the range high.
For BeInCrypto’s latest Bitcoin (BTC) analysis, click here.
Disclaimer
In line with the Trust Project guidelines, this price analysis article is for informational purposes only and should not be considered financial or investment advice. BeInCrypto is committed to accurate, unbiased reporting, but market conditions are subject to change without notice. Always conduct your own research and consult with a professional before making any financial decisions. Please note that our Terms and Conditions, Privacy Policy, and Disclaimers have been updated.
