

Yearn.Finance (YFI) is retracing after a sharp upward movement that caused a 125% increase in five days. The long-term trend seems to be bullish.
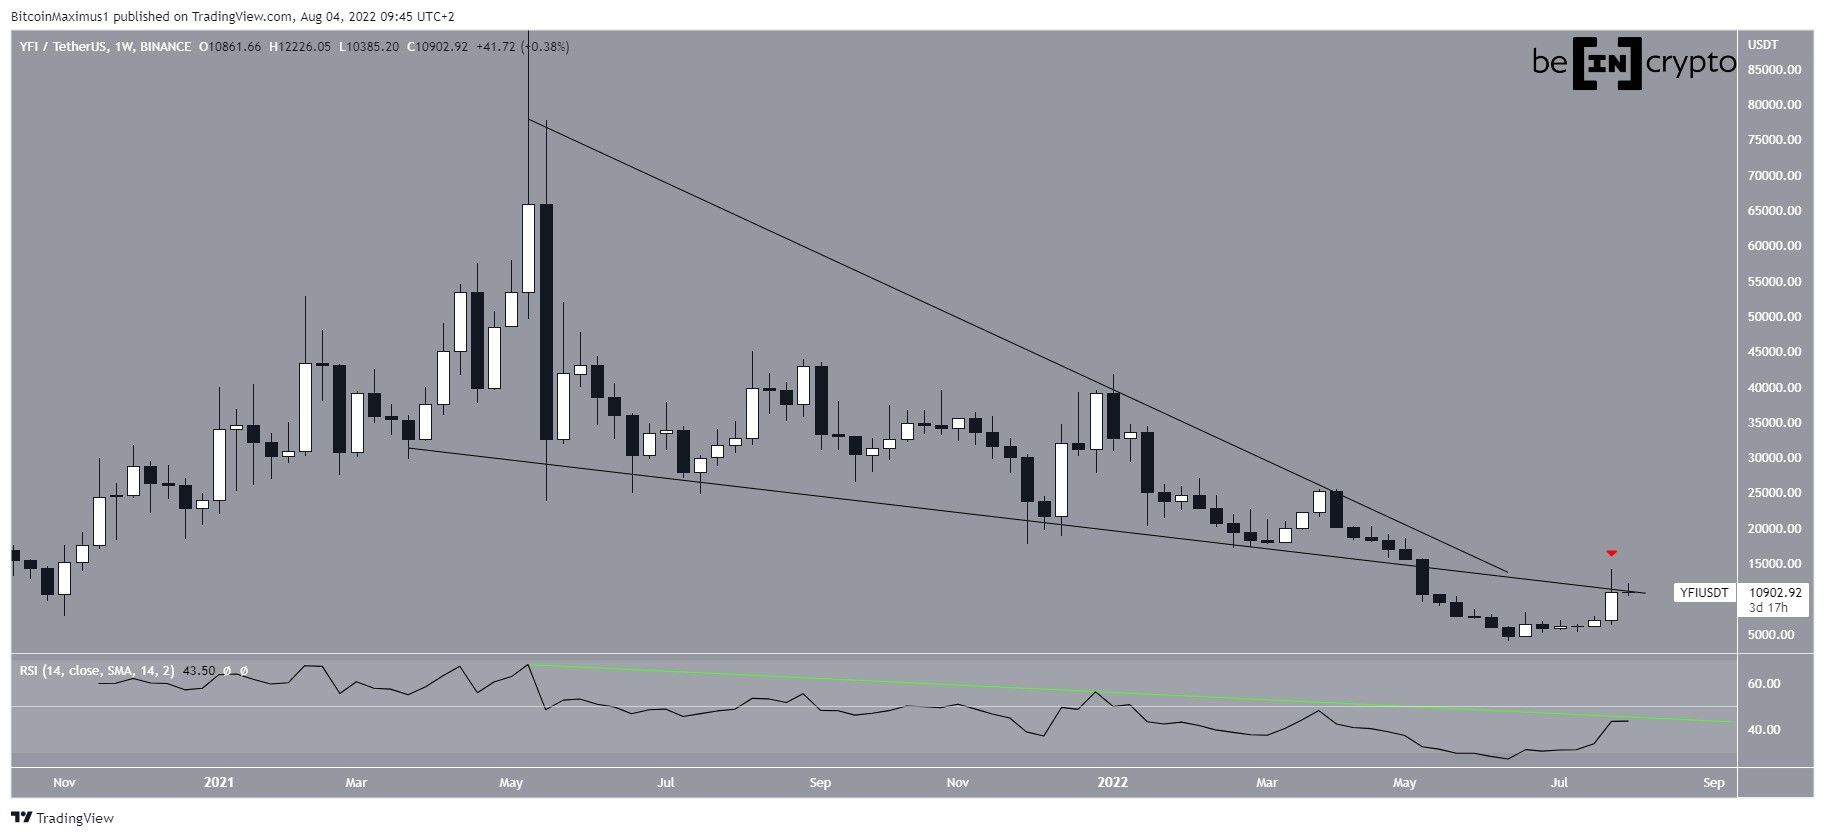
YFI has been decreasing since reaching an all-time high price of $95,000 in May 2021. The downward movement was initially contained inside a descending wedge, which is considered a bullish pattern. As a result, a breakout seemed to be the most likely scenario.
However, this was not the case, since the price broke down from the wedge in May. The breakdown led to a low of $4,018, which was only slightly above the $3,000 all-time low price.
During this period, the weekly RSI fell to a new all-time low inside oversold territory. The indicator has been increasing since, but has yet to break out from its descending trend line (green) and is still below 50.
Currently, YFI is facing resistance (red icon) from the support line of the wedge.
A reclaim of this support line along with a decisive RSI breakout above 50 would be required in order for the trend to be considered bullish.
YFI breaks out
Cryptocurrency trader @TehLamboX tweeted a chart of YFI, stating that the price could soon break out above $7,000.
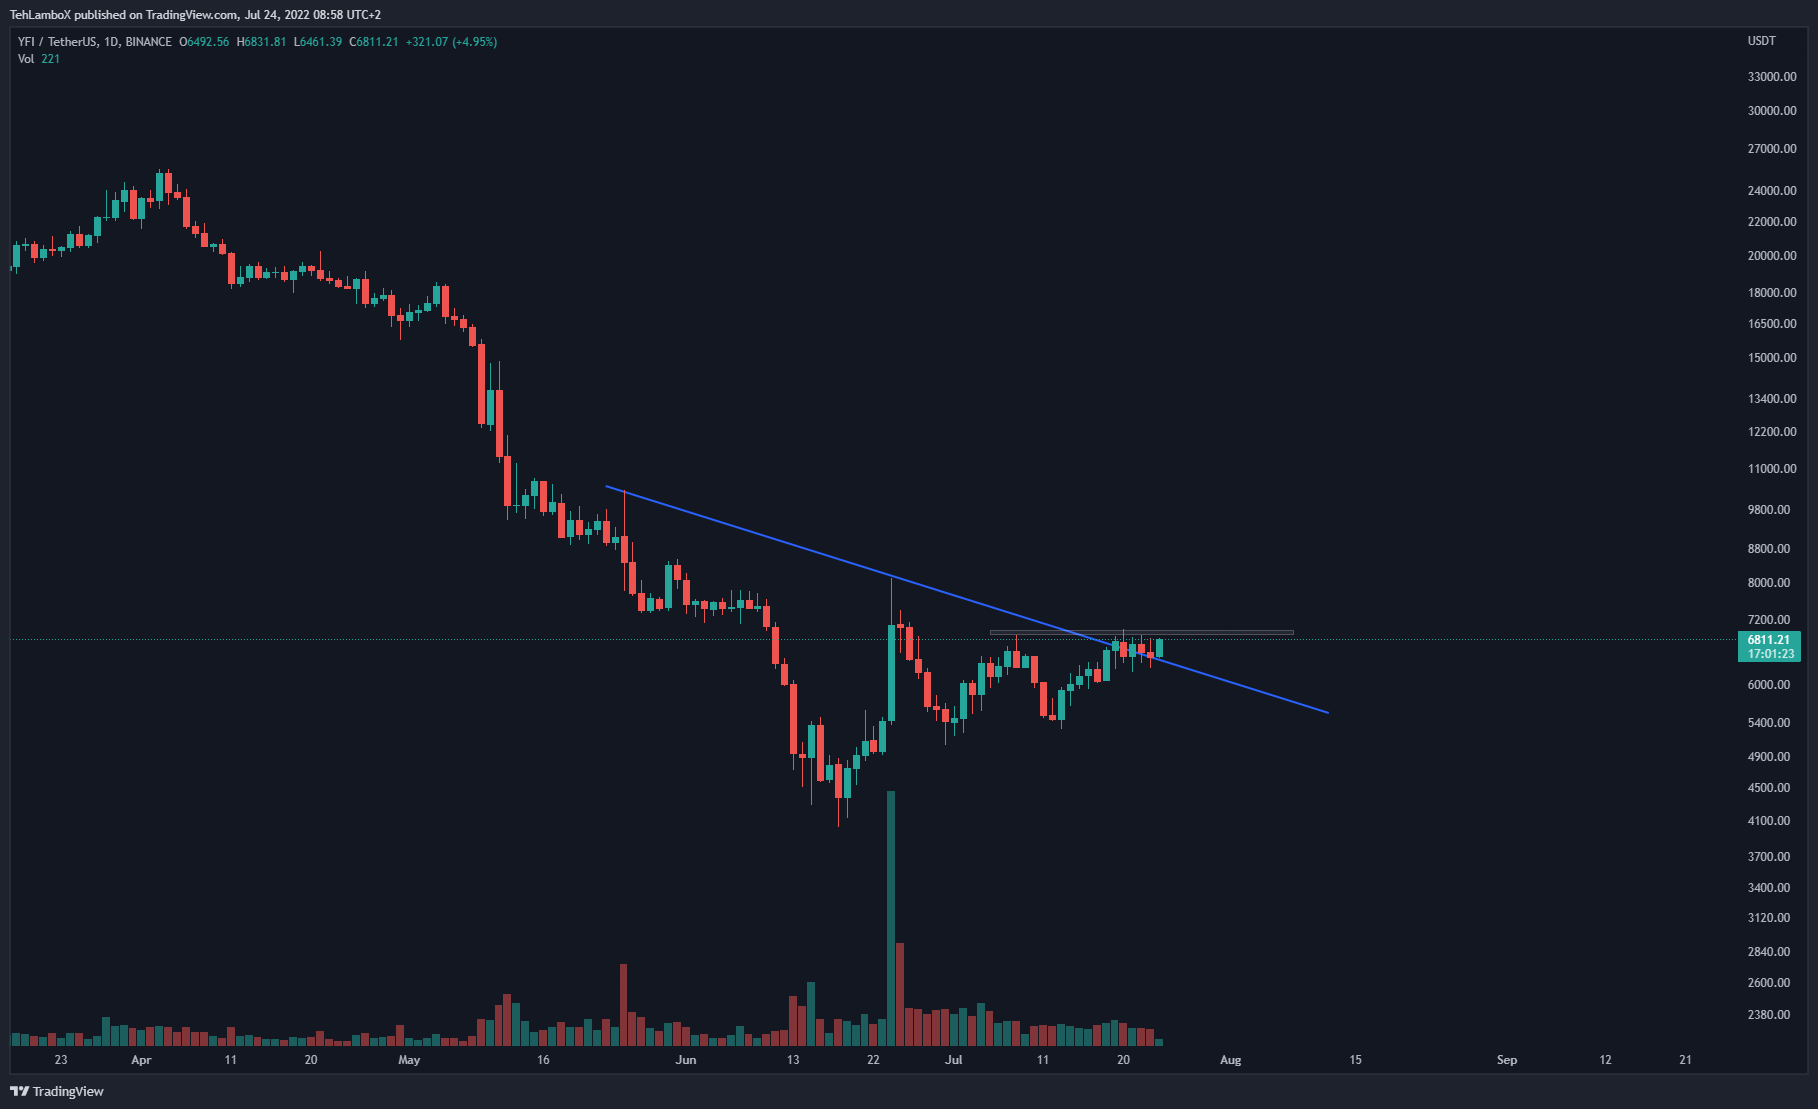
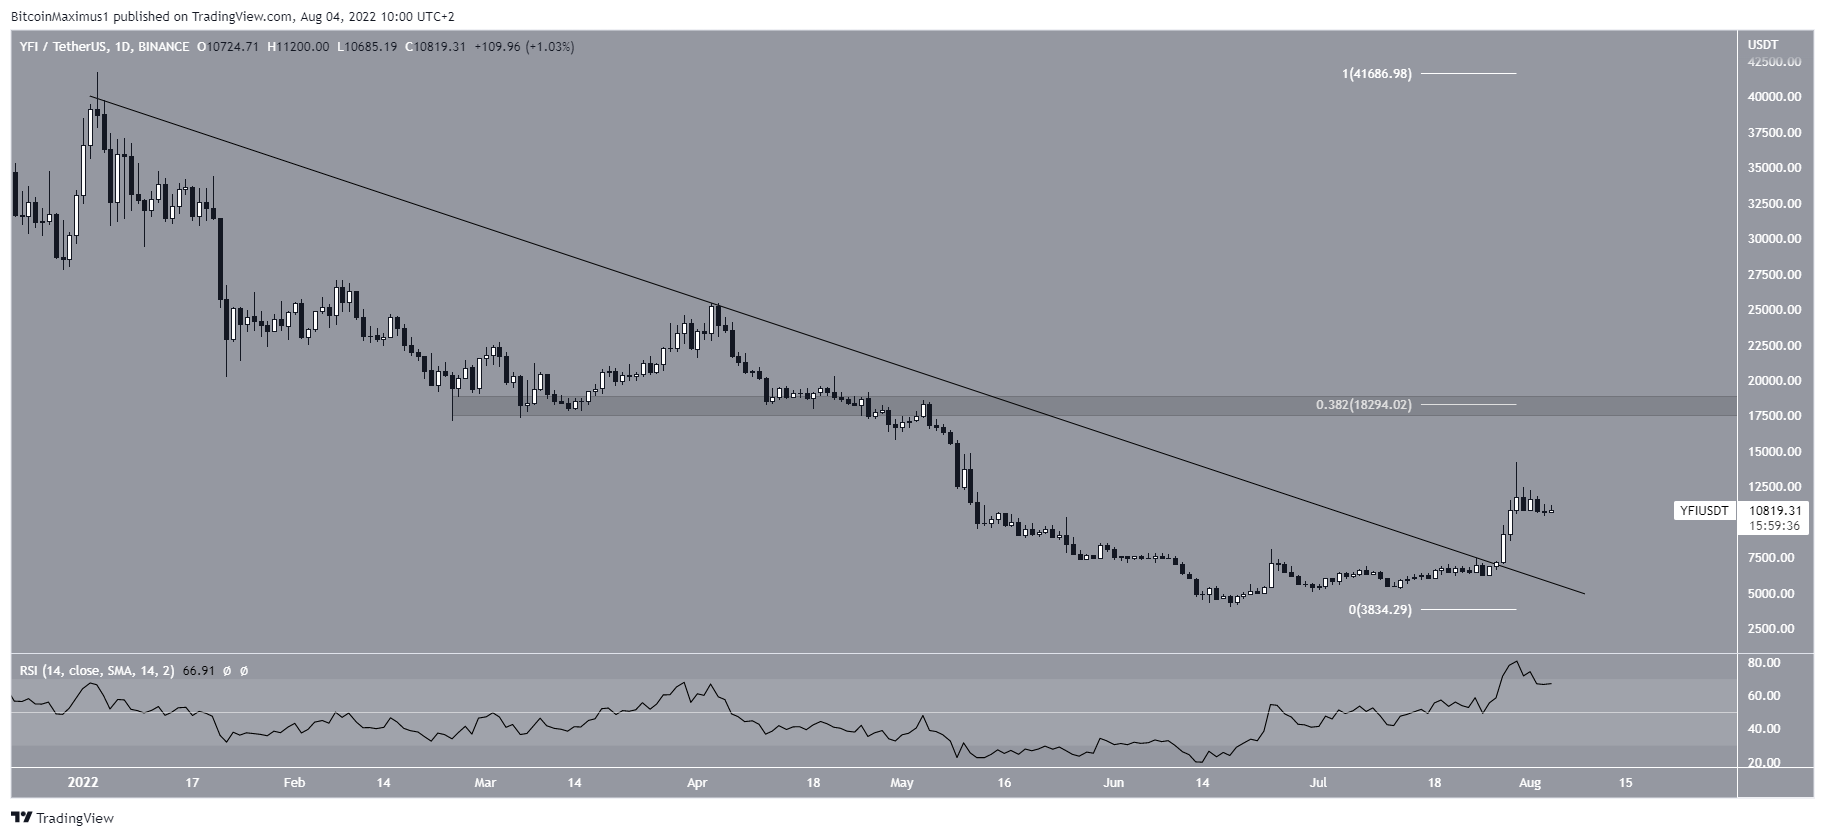
Since the tweet, the price has decisively broken out above this level. Additionally, it has broken out from a descending resistance line that had previously been in place since the beginning of the year. Breakouts from such long-term structures usually mean that the previous trend has come to an end.
If correct, this would mean that YFI has now begun a bullish trend. This was also combined with an RSI breakout above 50, further increasing its legitimacy.
If the upward movement continues, the main resistance area would be at $18,300, created by the 0.382 Fib retracement resistance level and a previous support area, which is now likely to provide resistance.
Wave count analysis
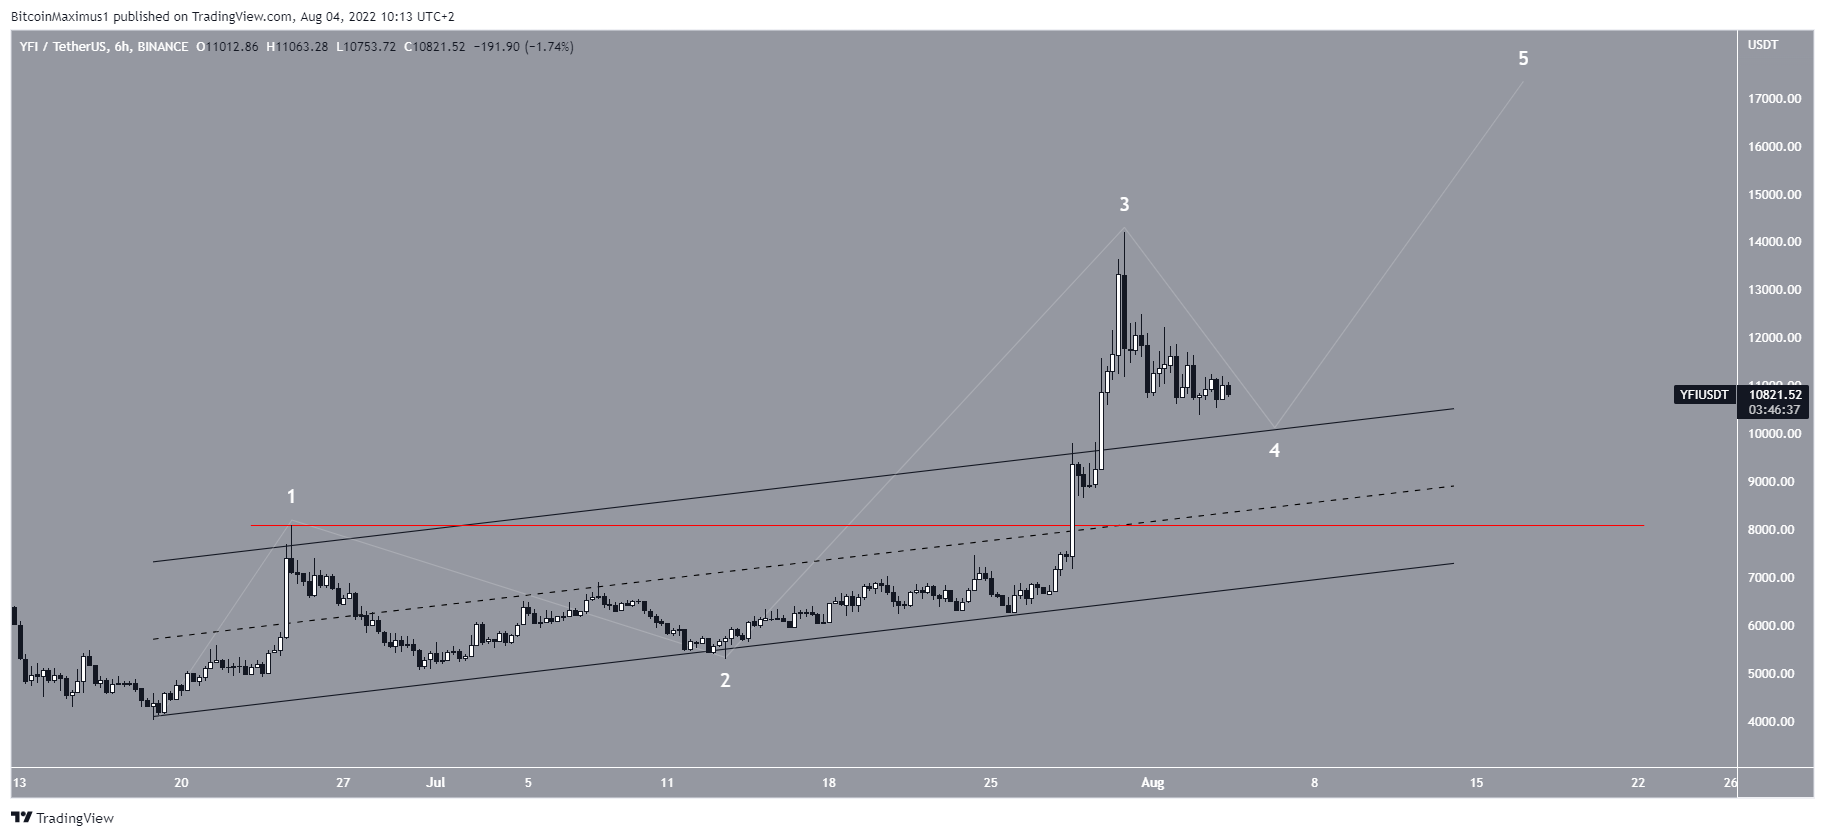
Since the June 18 bottom, YFI had been trading inside an ascending parallel channel. But, it managed to break out from it on July 29.
Due to this breakout, the most likely wave count indicates that the price has begun a five wave upward movement, and is currently in the process of a fourth-wave pullback.
If correct, it will bounce at the resistance line of the previous channel before resuming its upward movement towards the previously outlined $18,300 resistance area.
A decrease below the wave on the high (red line) at $8,087 would invalidate this particular wave count.
For Be[in]Crypto’s latest Bitcoin (BTC) analysis, click here
Trusted
Disclaimer
In line with the Trust Project guidelines, this price analysis article is for informational purposes only and should not be considered financial or investment advice. BeInCrypto is committed to accurate, unbiased reporting, but market conditions are subject to change without notice. Always conduct your own research and consult with a professional before making any financial decisions. Please note that our Terms and Conditions, Privacy Policy, and Disclaimers have been updated.
