

Reserve Rights (RSR) is showing long-term signs of a bullish reversal and has broken out from a short-term consolidation pattern.
RSR has been falling since April 16, when it reached an all-time high price of $0.119. Initially, the price bounced on July 2021, but the upward movement led to a lower high (red icon).
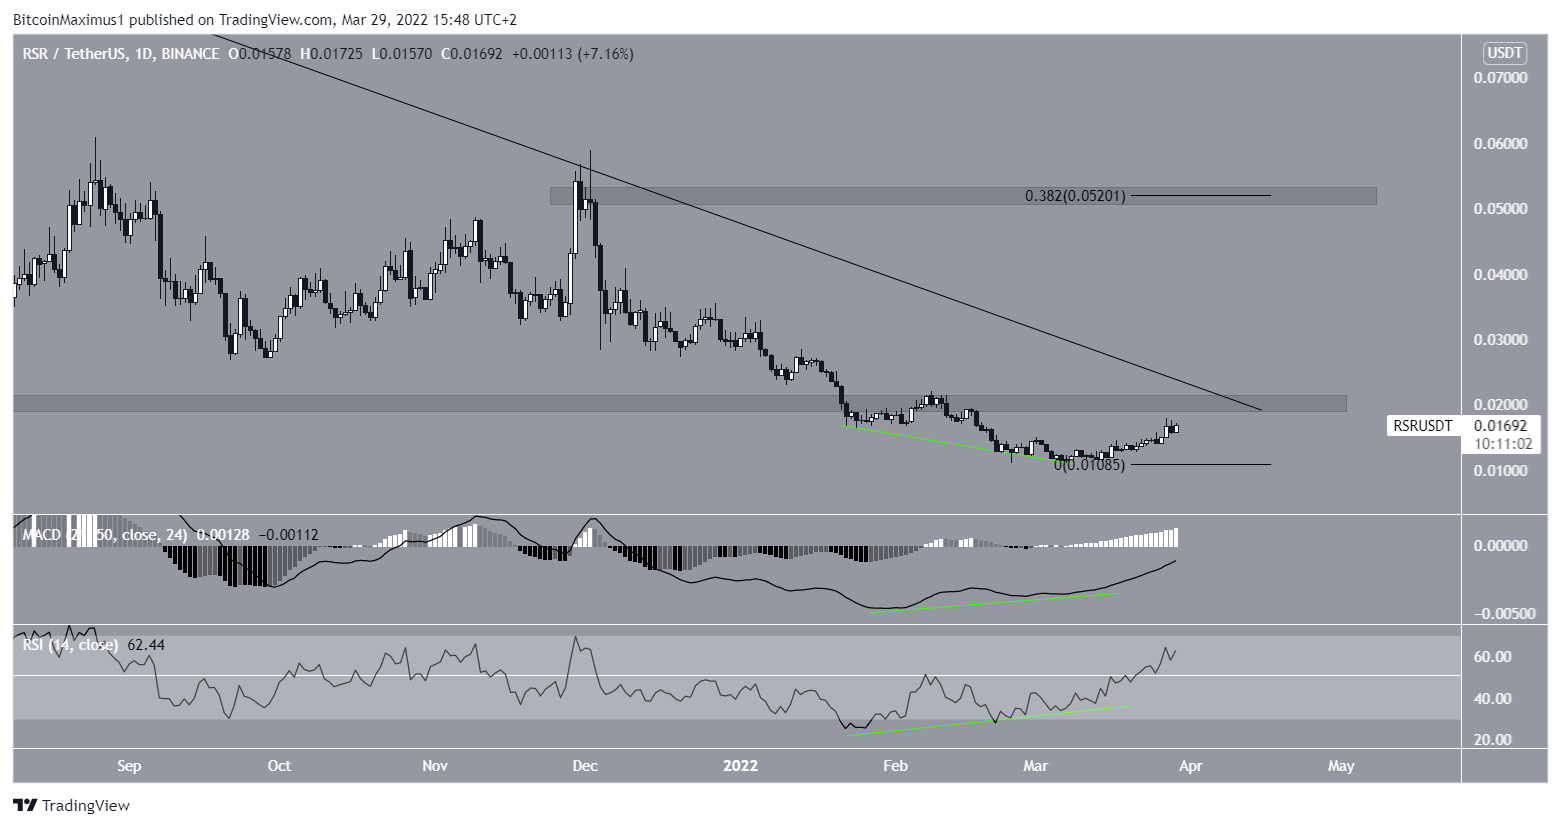
So far, RSR has reached a low of $0.011 on Feb 24. It has been moving upwards since.
It is possible that RSR is following a descending resistance line, though that has not been validated sufficient times yet. If so, the line would coincide with the $0.0205 resistance area, which had previously acted as support.

Future RSR movement
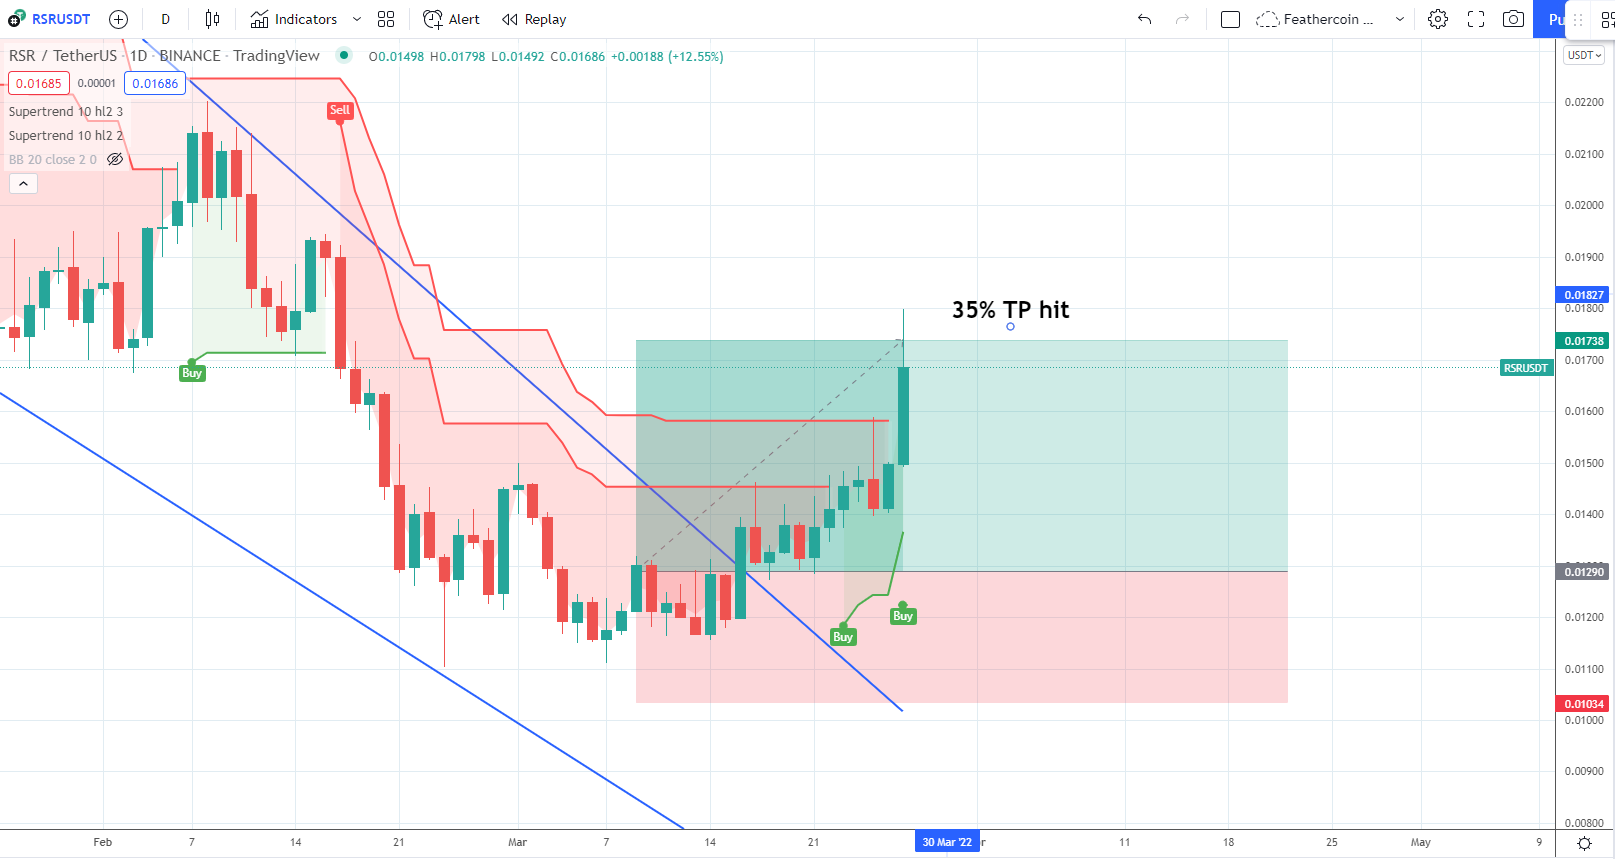
Cryptocurrency trader @Incomesharks tweeted a chart of RSR, stating that the price has increased by more than 30% since his entry.
Technical indicators in the daily time-frame support the continuation of the upward movement. The main reason for this are the pronounced bullish divergences (green lines) that have developed in both the RSI and MACD. Such divergences often precede significant bullish trend reversals.
In addition to this, the RSI has already moved above 50, which is considered a sign of bullish trends.
If RSR manages to break out from the resistance line, the next significant resistance would be at $0.052. This is the 0.382 Fib retracement resistance level and a horizontal resistance area.
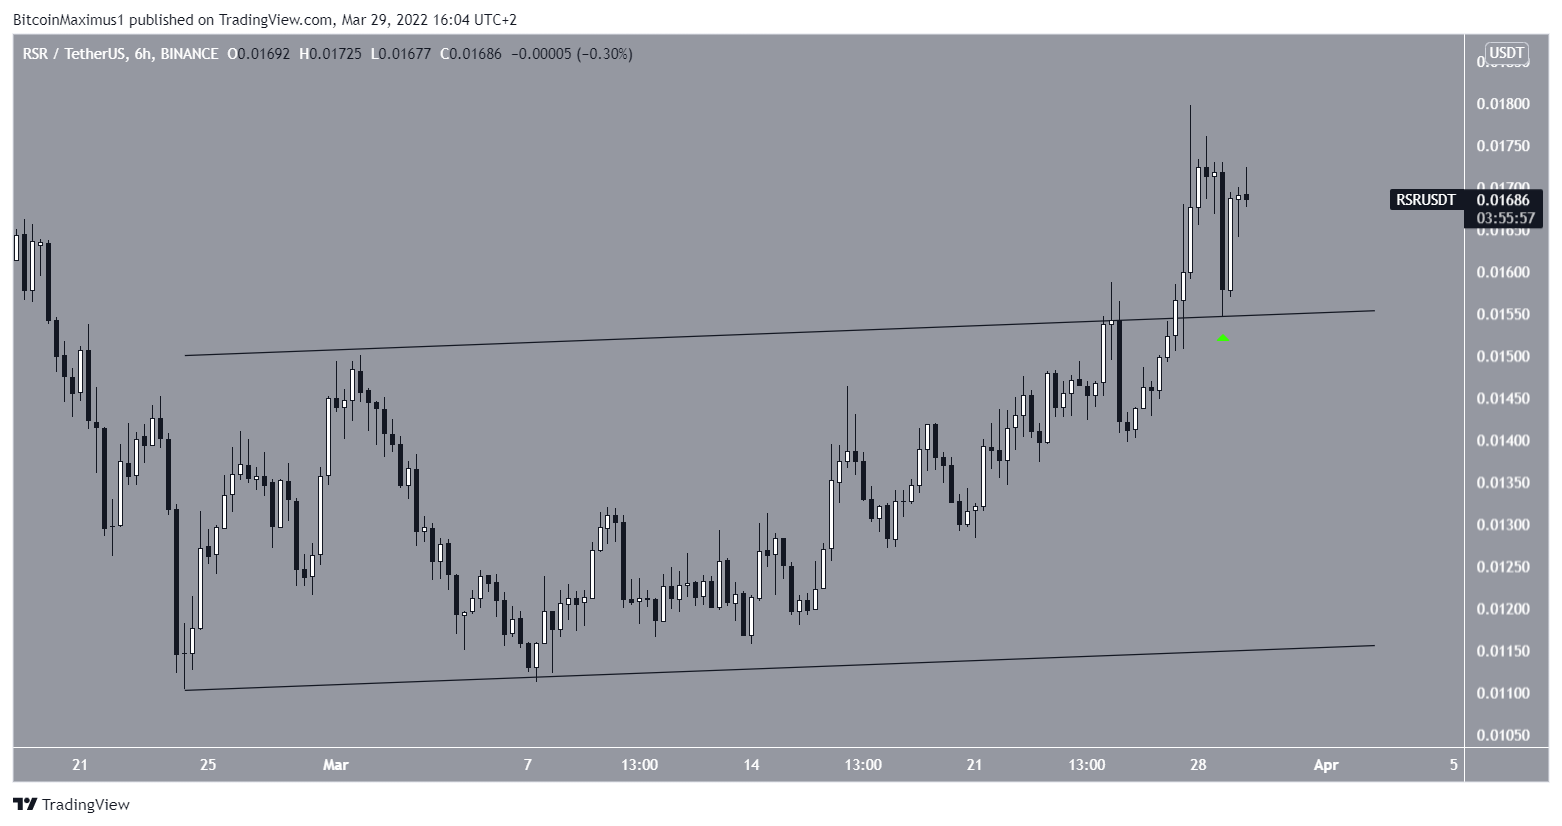
The six-hour chart supports this possibility, since it shows that RSR has broken out from an ascending parallel channel and validated it as support afterwards (green icon).
Ascending parallel channels are considered corrective movements. Therefore, the breakout from it suggests that the increase is impulsive.
Wave count analysis
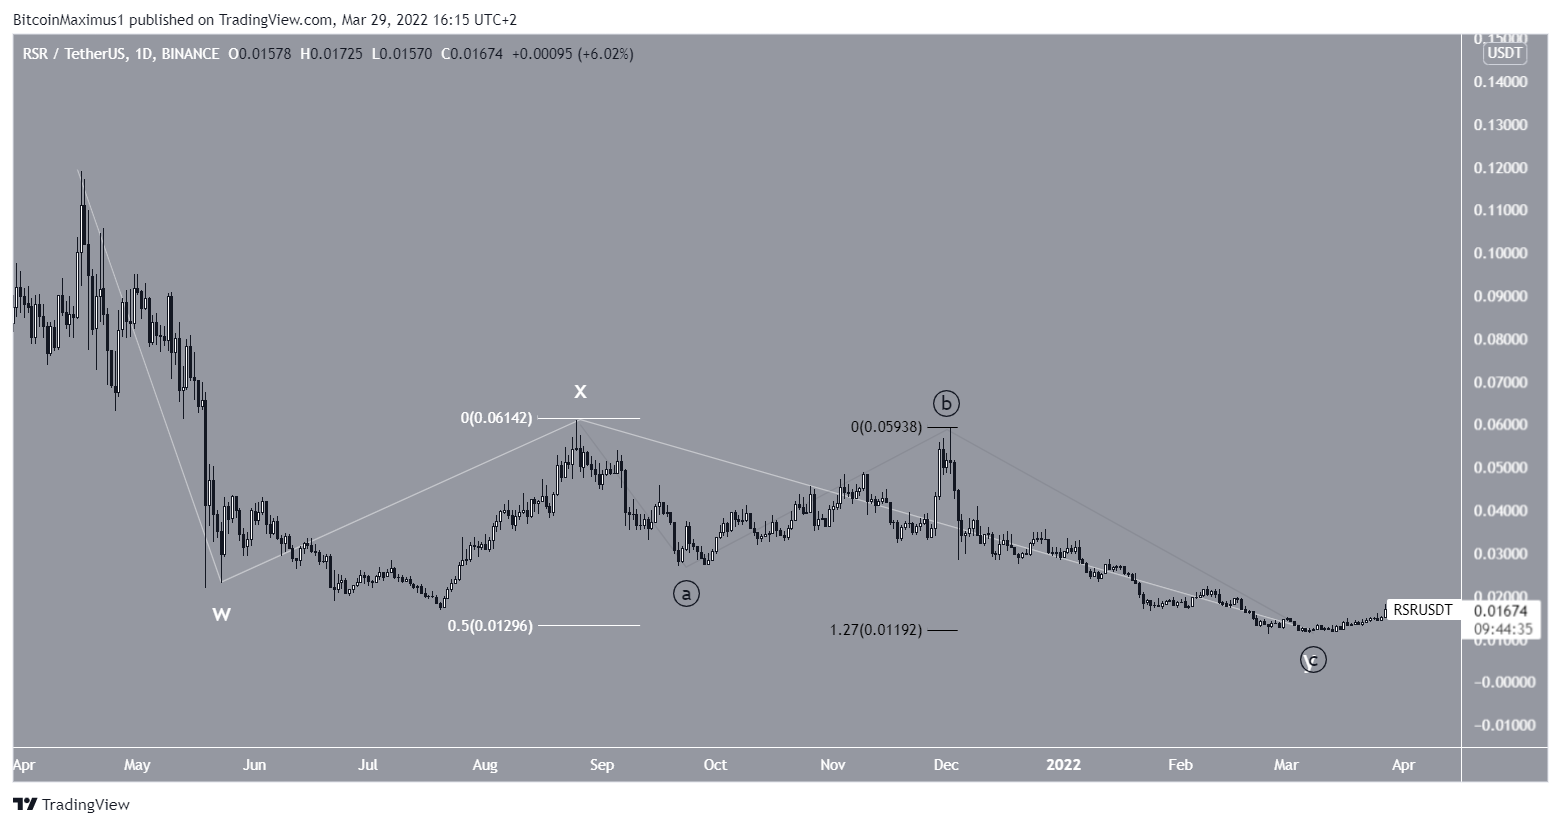
Measuring from the all-time high, it seems that RSR has completed a W-X-Y complex corrective structure (white).
There are two Fib ratios that support this movement.
First, waves W:Y have a 1:0.5 ratio. Second, waves A:C (black) have a 1:1.27 ratio.
Therefore, it is possible that RSR began a bullish trend reversal on March 6. Besides the wave count, this possibility also fits with technical indicator readings.
For BeInCrypto’s latest Bitcoin (BTC) analysis, click here
Trusted
Disclaimer
In line with the Trust Project guidelines, this price analysis article is for informational purposes only and should not be considered financial or investment advice. BeInCrypto is committed to accurate, unbiased reporting, but market conditions are subject to change without notice. Always conduct your own research and consult with a professional before making any financial decisions. Please note that our Terms and Conditions, Privacy Policy, and Disclaimers have been updated.
