

XRP shows bullish signs in the weekly time frame, suggesting that the long-term bullish structure is still intact. However, the short-term movement is unclear.
The ongoing Ripple vs. SEC lawsuit might be coming to an end. On Sept. 19, both parties will present their closing arguments. Afterward, the lawyers from both sides will start a negotiation process that will last until the end of the year.
With such an important milestone coming up, it is interesting to look at the price movement and determine if there is potential for a significant price increase or decrease.
Long-term XRP movement
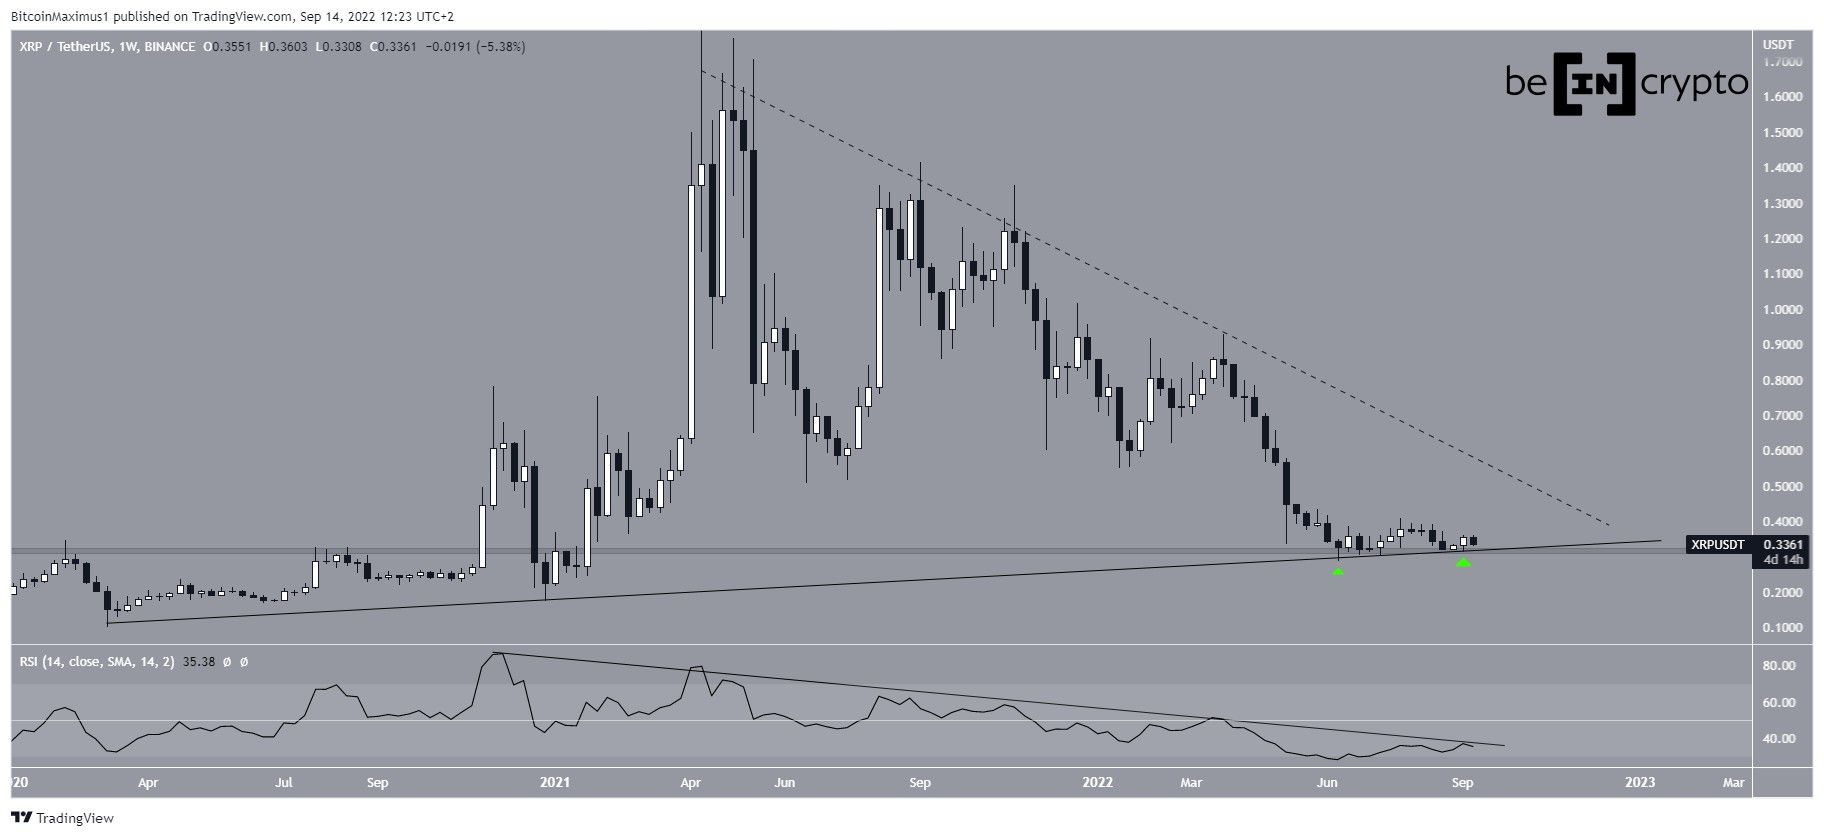
XRP has been falling underneath a descending resistance line (dashed) since reaching a high of $1.97 in April 2021. The downward movement has led to a low of $0.287 in June 2022. The ensuing bounce (green icon) validated a long-term ascending support line.
The support line has been in place since March 2020. Additionally, the line coincides with the $0.32 horizontal support area. So, it is imperative that the line must remain in place in order for the bullish structure to still remain valid. XRP validated it once more and created a higher low in the beginning of Sept.
If the upward movement continues, the aforementioned descending resistance line would be at $0.45. So far, the weekly RSI has yet to break out from its descending resistance line. So, it is not yet certain if the long-term trend is bullish or bearish.
Whether the RSI breaks out from its resistance line, or the price breaks down from its support line will likely determine the direction of the future trend.
Future movement
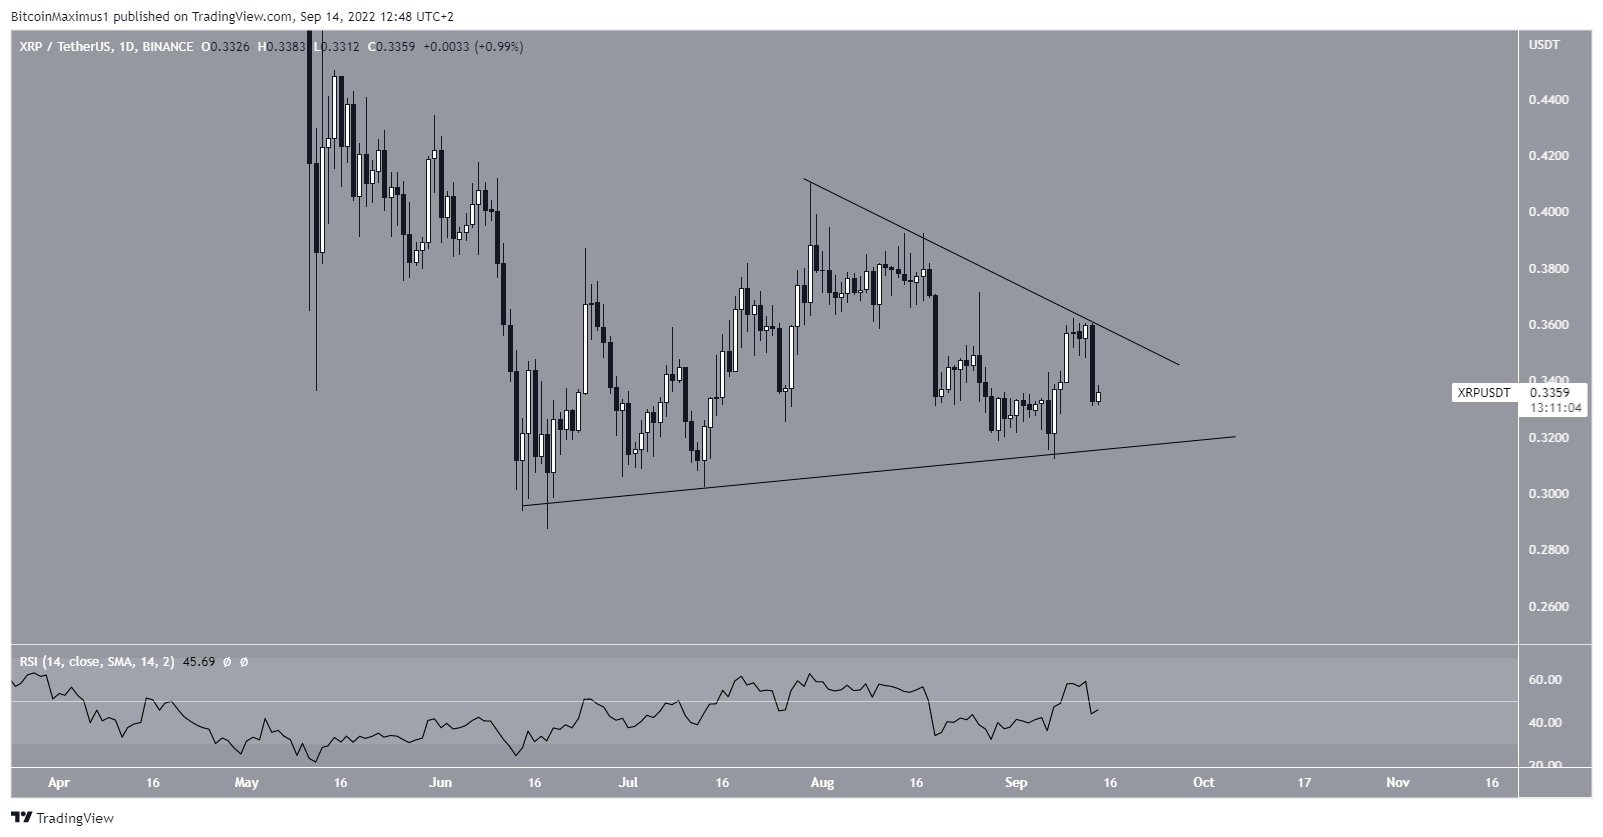
Despite the bullish signs from the weekly time frame, the price movement in the daily time frame is still unclear. The first reason is that the price is trading inside a symmetrical triangle. The symmetrical triangle is considered a neutral pattern, meaning that a breakout and breakdown both remain possible.
Additionally, the daily RSI is moving freely above and below 50, another sign of an undetermined trend.
So, adding to the suggestion from the weekly time frame, whether the price breaks out or down from the triangle will likely determine the direction of the future trend.
For Be[in]Crypto’s latest Bitcoin (BTC) analysis, click here
Trusted
Disclaimer
In line with the Trust Project guidelines, this price analysis article is for informational purposes only and should not be considered financial or investment advice. BeInCrypto is committed to accurate, unbiased reporting, but market conditions are subject to change without notice. Always conduct your own research and consult with a professional before making any financial decisions. Please note that our Terms and Conditions, Privacy Policy, and Disclaimers have been updated.
