

On February 11, the XRP price validated the previous breakout line and has been increasing considerably since.
XRP Price Highlights
- XRP broke out from a descending wedge.
- There is resistance at 3250 satoshis.
- There is support at 2950 satoshis.
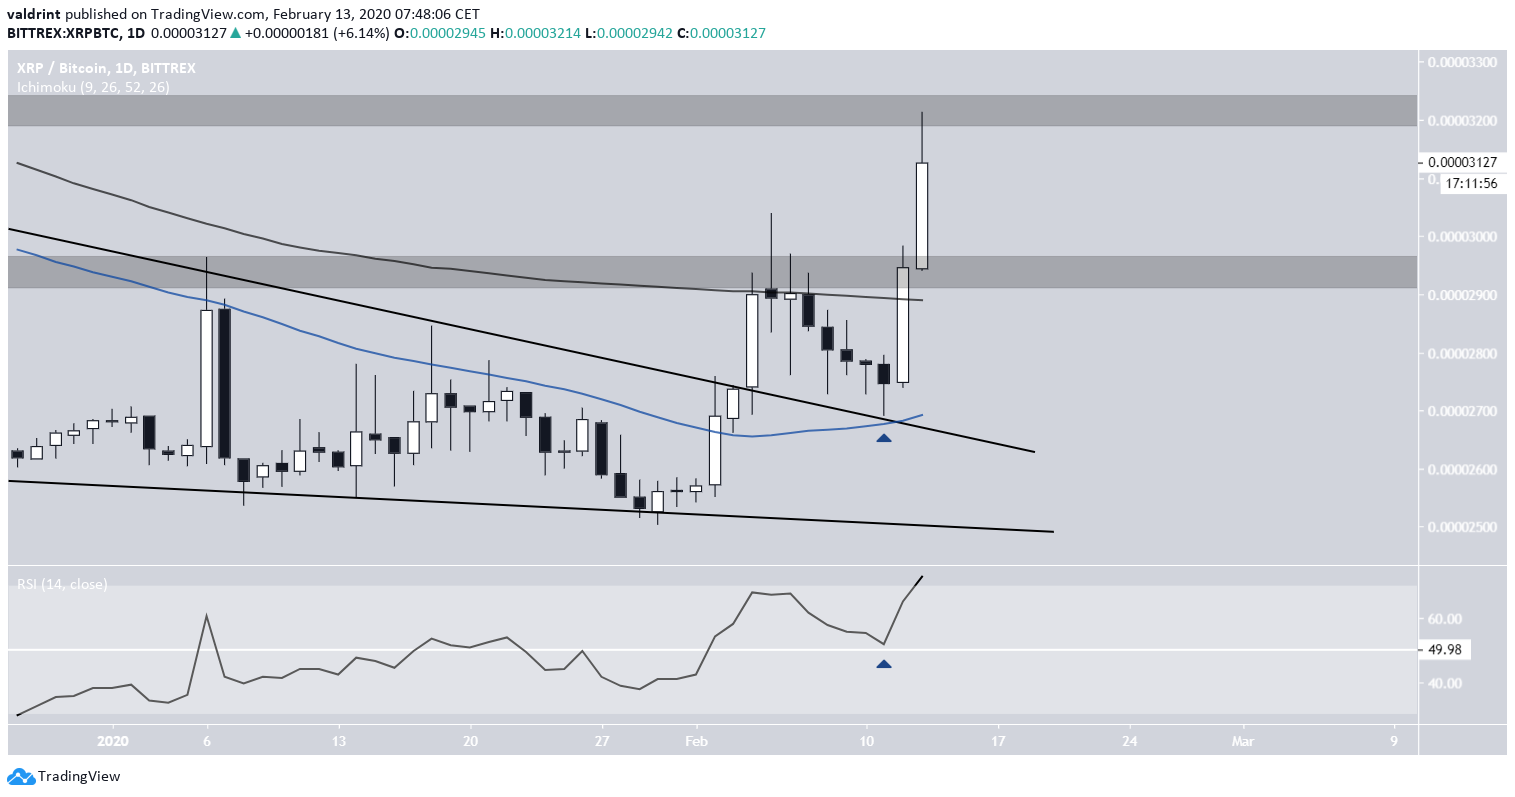
- Technical indicators are bullish.
Descending Wedge
On February 4, the XRP price broke out from a descending wedge. It reached a high of 3040 satoshis before decreasing and validating the breakout line on February 11. Since then, the price has created two daily bullish engulfing candlesticks in a row. The main resistance area is found at 3250 satoshis, an area that the price has reached and created a long upper wick after doing so, while the 2950 area is expected to act as support. Therefore, we could see the price trading in a range between these two areas before eventually breaking out.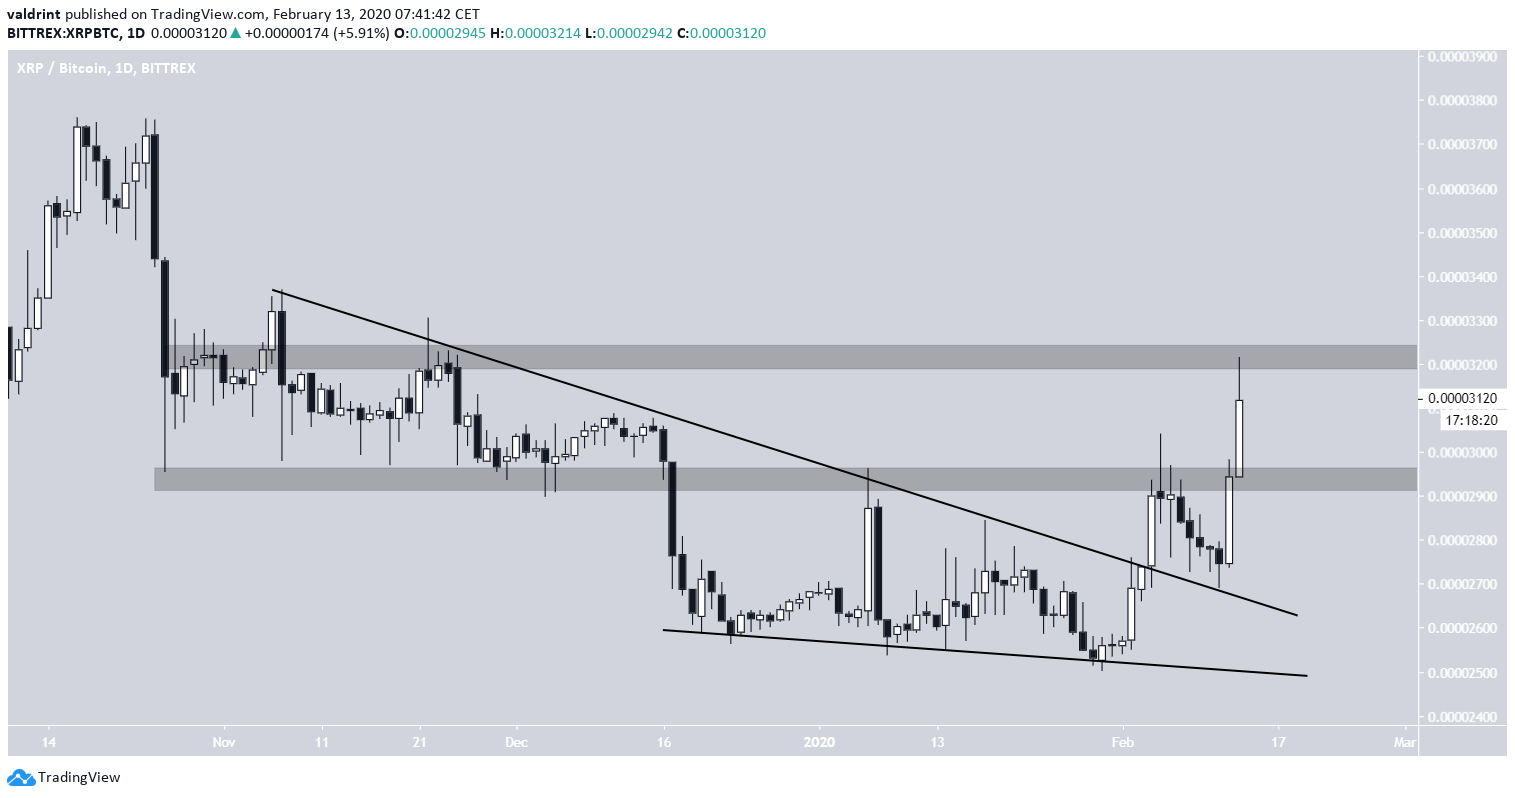 Technical indicators provide a bullish outlook.
Firstly, the XRP price has finally moved above its 200-day moving average (MA), which had been providing resistance for the entire duration of the wedge.
Secondly, the aforementioned bounce on the support line also validated the 50-day MA as support. This MA has turned upwards and if it continues with the current slope, it will soon make a bullish cross with the 200-day MA — confirming that XRP is in an upward trend.
Finally, the RSI acted almost in an identical manner, since it bounced on the 50-line on February 11 and has been increasing since.
Technical indicators provide a bullish outlook.
Firstly, the XRP price has finally moved above its 200-day moving average (MA), which had been providing resistance for the entire duration of the wedge.
Secondly, the aforementioned bounce on the support line also validated the 50-day MA as support. This MA has turned upwards and if it continues with the current slope, it will soon make a bullish cross with the 200-day MA — confirming that XRP is in an upward trend.
Finally, the RSI acted almost in an identical manner, since it bounced on the 50-line on February 11 and has been increasing since.
Wyckoff Distribution
In our previous analysis, we stated that the XRP price movement could be explained by using the Wyckoff distribution. While the increase occurred slightly faster than expected, the price movement still falls within our parameters. If XRP continues following the distribution, it should create the final higher low at the “last point of support” near the support area of 2950 satoshis sometime in March — before the rate of increase accelerates considerably. If so, that would present the optimal level to enter the trade before XRP moves towards the top of the range.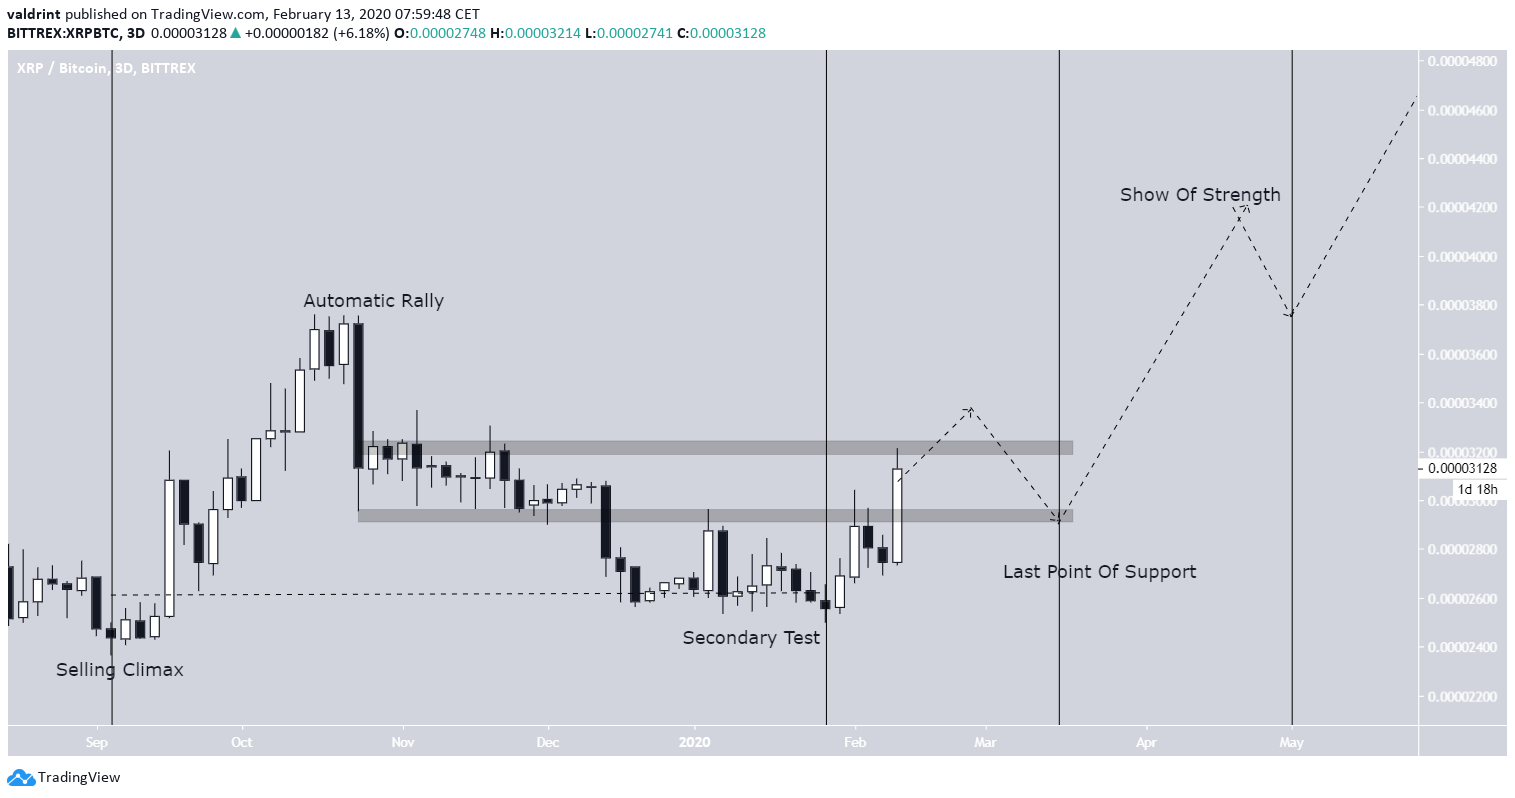 To conclude, the XRP price has been increasing since February 11. We believe this increase is a part of the Wyckoff distribution and the price will eventually move above the range high of 3600 satoshis.
Top crypto projects in the US | April 2024
Trusted
Disclaimer
In line with the Trust Project guidelines, this price analysis article is for informational purposes only and should not be considered financial or investment advice. BeInCrypto is committed to accurate, unbiased reporting, but market conditions are subject to change without notice. Always conduct your own research and consult with a professional before making any financial decisions. Please note that our Terms and Conditions, Privacy Policy, and Disclaimers have been updated.

Valdrin Tahiri
Valdrin discovered cryptocurrencies while he was getting his MSc in Financial Markets from the Barcelona School of Economics. Shortly after graduating, he began writing for several different cryptocurrency related websites as a freelancer before eventually taking on the role of BeInCrypto's Senior Analyst.
(I do not have a discord and will not contact you first there. Beware of scammers)
READ FULL BIO
Sponsored
Sponsored