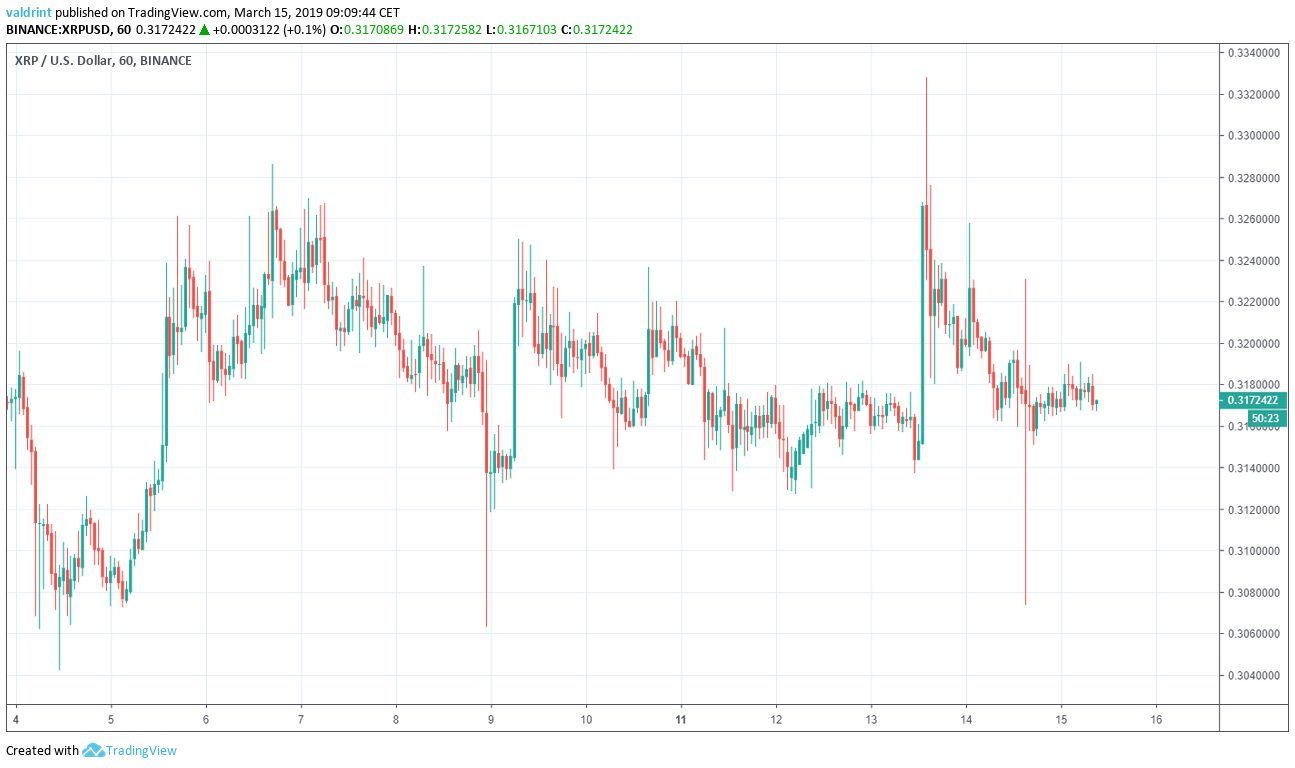
On Mar 14, 2019 the price of XRP (XRP) reached a high around $0.33. A gradual downtrend followed with prices currently decreasing at a steady rate.
Here’s a look at the prices between Mar 4 and Mar 14:
 In our Mar 14, XRP analysis, we predicted that an upward move is close to materializing. Higher prices are expected in the future. Later that day, a breakout did occur, but a rapid downward move brought prices back to pre-breakout levels.
Based on today’s analysis, we believe that XRP will eventually initiate another upward move. Price increases are to be expected in response to this recent losses.
In our Mar 14, XRP analysis, we predicted that an upward move is close to materializing. Higher prices are expected in the future. Later that day, a breakout did occur, but a rapid downward move brought prices back to pre-breakout levels.
Based on today’s analysis, we believe that XRP will eventually initiate another upward move. Price increases are to be expected in response to this recent losses.
Key Highlights For March 14
- The price of XRP has been on an uptrend since Mar 4.
- The price is trading inside a medium-term ascending triangle.
- The price recently broke out of a short-term descending wedge.
- There is bullish divergence developing in the MACD.
- There are resistance areas near $0.345 and $0.33.
- There is support near $0.304.
Ascending Support
The price of XRP on Binance is analyzed at one-hour intervals from Mar 4 to Mar 15. The price reached a low of $0.304 on Mar 4. The price has experienced fluctuations since and has completed several short market cycles. However, every low has been higher than the last. Tracing these lows gives us the ascending support line.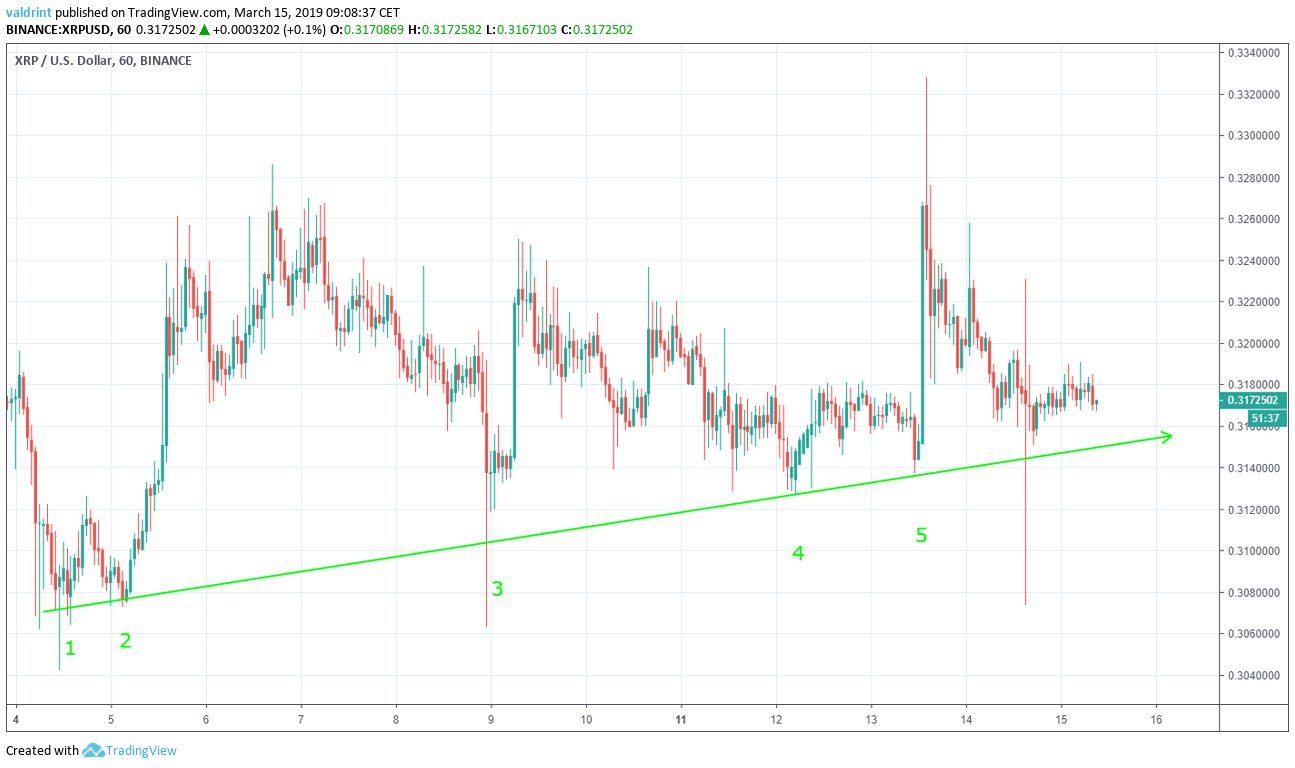 The support line acts as a floor to price, preventing further downward movement. It theoretically traces the lower limits of the price over time.
The price of XRP has been increasing at the same rate as predicted by the support line.
A breakdown below the support line such as the wick lows of $0.306 and $0.307 on Mar 8 and Mar 14 respectively are considered insignificant since they were not succeeded by continuous price decreases. The price rebounded immediately and closed above the support line.
It is likely that the price will continue to increase following this line. However, the support line alone is not sufficient in estimating when a breakout will occur.
The support line acts as a floor to price, preventing further downward movement. It theoretically traces the lower limits of the price over time.
The price of XRP has been increasing at the same rate as predicted by the support line.
A breakdown below the support line such as the wick lows of $0.306 and $0.307 on Mar 8 and Mar 14 respectively are considered insignificant since they were not succeeded by continuous price decreases. The price rebounded immediately and closed above the support line.
It is likely that the price will continue to increase following this line. However, the support line alone is not sufficient in estimating when a breakout will occur.
Ascending Triangle
The price reached a high of $0.326 on Mar 5. At the time of writing, this price has been reached four times. Tracing these highs gives us a horizontal resistance line. The resistance line effectively acts as a ceiling to price, theoretically preventing further upward movement. Highs above the resistance line such as the wick high of $0.3328 on Mar 13 can be considered insignificant unless they are succeeded by sustained movement above the line—which they were not.
The resistance and support lines create an ascending triangle, which is a bullish pattern, making future price increases more likely. The use of the triangle pattern better predicts price movements than support or resistance lines alone.
If this pattern proves to be a reliable predictor of price, the overall upward trend should continue as the price fluctuates between the resistance and support. Eventually, a breakout from this bullish pattern is likely to occur.
The resistance line effectively acts as a ceiling to price, theoretically preventing further upward movement. Highs above the resistance line such as the wick high of $0.3328 on Mar 13 can be considered insignificant unless they are succeeded by sustained movement above the line—which they were not.
The resistance and support lines create an ascending triangle, which is a bullish pattern, making future price increases more likely. The use of the triangle pattern better predicts price movements than support or resistance lines alone.
If this pattern proves to be a reliable predictor of price, the overall upward trend should continue as the price fluctuates between the resistance and support. Eventually, a breakout from this bullish pattern is likely to occur.
Short-Term Wedge
To better determine when the upward movement might begin, we analyzed the price of XRP on Binance at 15-minute intervals from Mar 13 to Mar 15.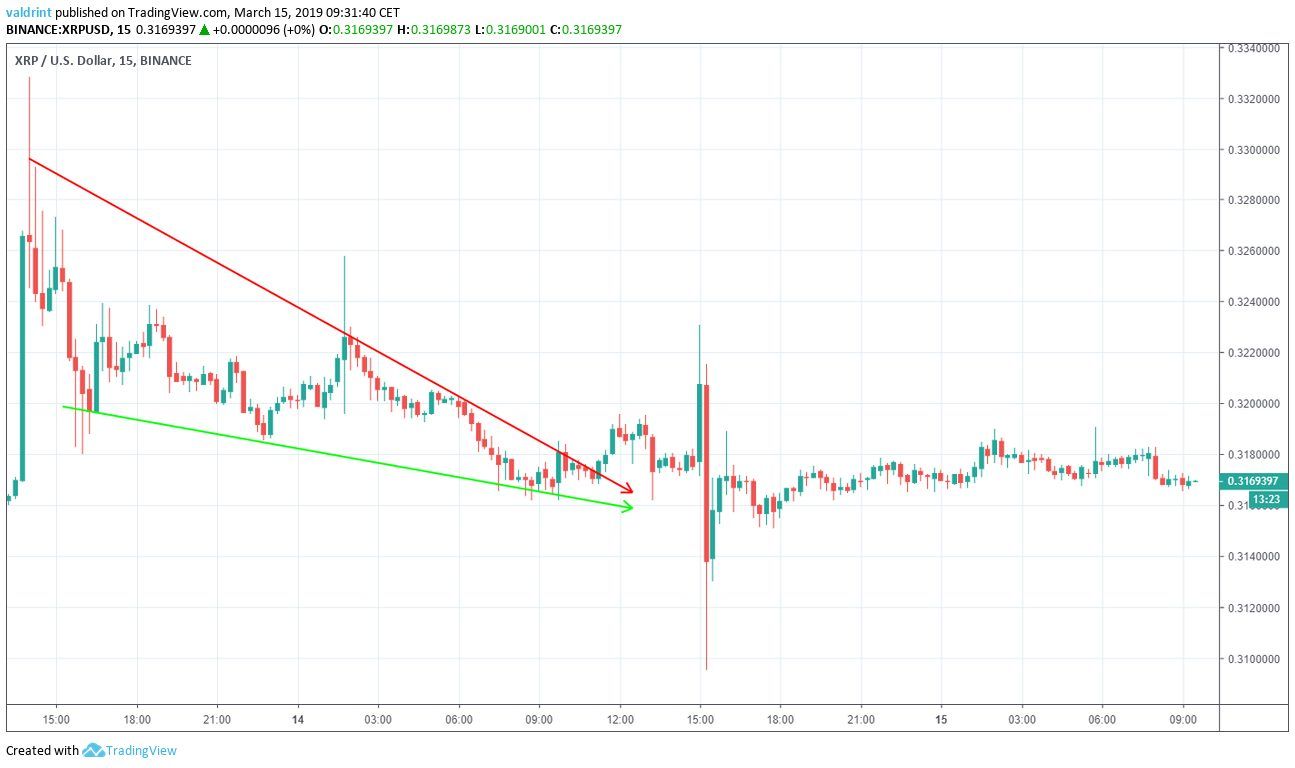 The price made a high of $0.332 on Mar 13. It has made lower highs since. Tracing these highs gives us the descending resistance line. The price made a low of $0.318 on Mar 13. It has made lower lows since. Tracing these lows gives us a descending support line.
The support and resistance lines combine to create a descending wedge, which is a bullish pattern, further confirming our projection of likely price increases in the near future.
While price broke out on Mar 14 as predicted, the rapid downward move took it back to pre-breakout levels.
The price made a high of $0.332 on Mar 13. It has made lower highs since. Tracing these highs gives us the descending resistance line. The price made a low of $0.318 on Mar 13. It has made lower lows since. Tracing these lows gives us a descending support line.
The support and resistance lines combine to create a descending wedge, which is a bullish pattern, further confirming our projection of likely price increases in the near future.
While price broke out on Mar 14 as predicted, the rapid downward move took it back to pre-breakout levels.
Future Movement
The relative strength index (RSI) is an indicator which calculates the size of the changes in price in order to determine oversold or overbought conditions in the market. Combining RSI bullish/bearish divergence with support/resistance essentially predicts price fluctuations.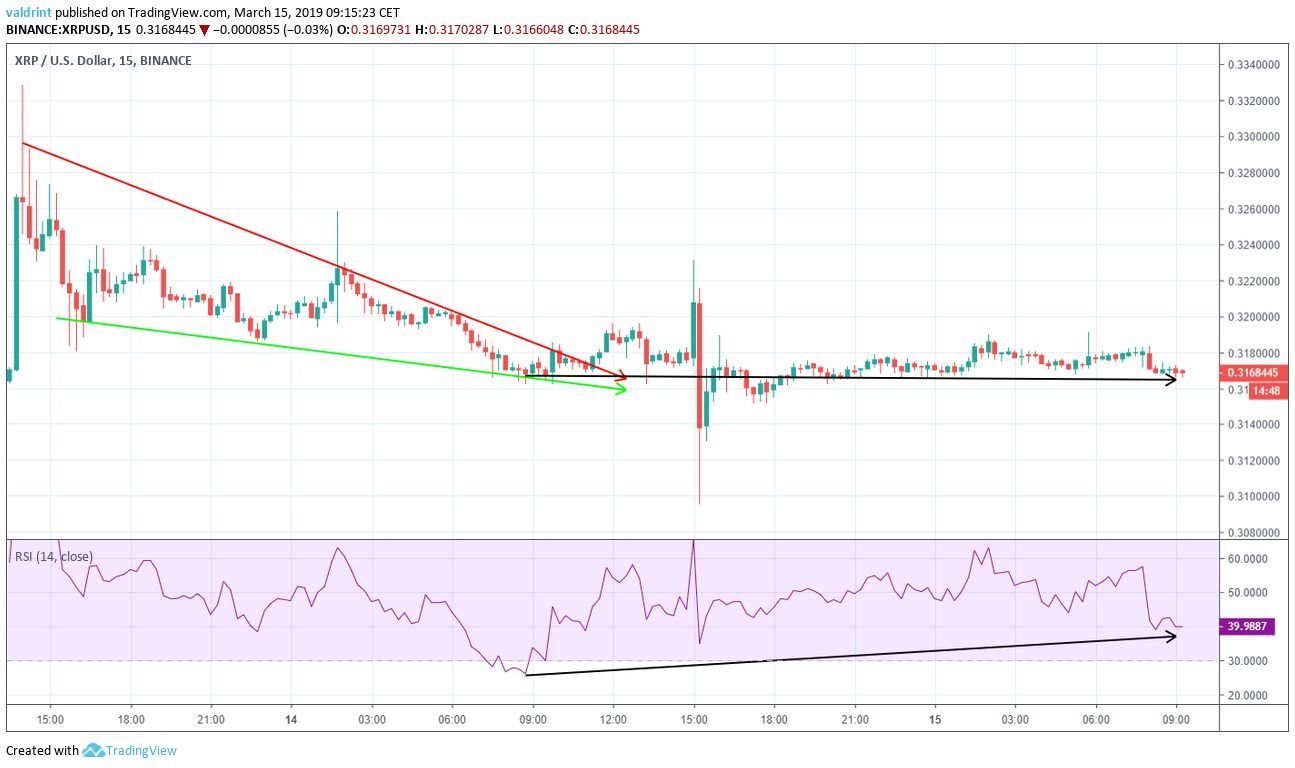 As mentioned above, the price returned to pre-breakout levels on Mar 15. However, the RSI did not. It was trading at 28 before the breakout and is currently at 39.9
This is known as bullish divergence and often precedes price increases.
It is especially effective if it occurs in a bullish pattern. While this is not entirely the case with XRP, the bullish divergence has occurred after a breakout from a bullish pattern. Furthermore, we are inside a longer-term bullish pattern in the ascending triangle.
Using this indicator, it is likely that the price will initiate another short-term upward move.
As mentioned above, the price returned to pre-breakout levels on Mar 15. However, the RSI did not. It was trading at 28 before the breakout and is currently at 39.9
This is known as bullish divergence and often precedes price increases.
It is especially effective if it occurs in a bullish pattern. While this is not entirely the case with XRP, the bullish divergence has occurred after a breakout from a bullish pattern. Furthermore, we are inside a longer-term bullish pattern in the ascending triangle.
Using this indicator, it is likely that the price will initiate another short-term upward move.
Resistance and Support
The price of XRP on Binance is analyzed at two-hour intervals from Feb 20 to Mar 15 to better visualize future possible resistance and support levels.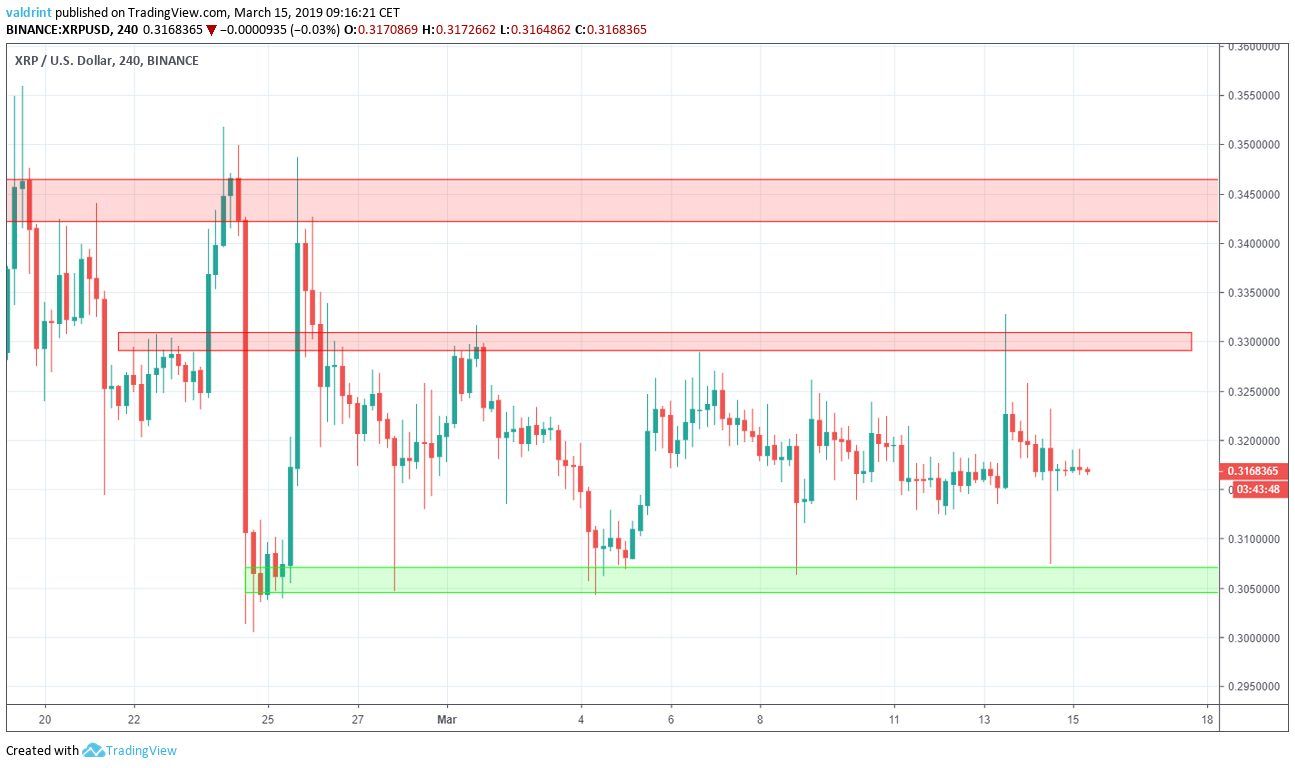 There are two visible resistance areas, near $0.33 and $0.345 respectively. This means that in the case of a breakout, they would provide likely reversal areas. This was visible in the breakout of Mar 13, since the price reached a high of $0.3328 before ultimately breaking down.
The closest support area is found near $0.304. If a breakdown occurs, this is a likely reversal area. According to our analysis, it is not likely that the price reaches this area.
There are two visible resistance areas, near $0.33 and $0.345 respectively. This means that in the case of a breakout, they would provide likely reversal areas. This was visible in the breakout of Mar 13, since the price reached a high of $0.3328 before ultimately breaking down.
The closest support area is found near $0.304. If a breakdown occurs, this is a likely reversal area. According to our analysis, it is not likely that the price reaches this area.
Summary of Analysis
Based on this analysis, the price of XRP is likely to initiate a short-term upward move that could take us to the horizontal resistance line. If the price reaches the horizontal line, the prediction will be partially validated. If it breaks out from the triangle, it will be fully validated. When do you think that the price of XRP will break out? Let us know in the comments below. Disclaimer: This article is not trading advice and should not be construed as such. Always consult a trained financial professional before investing in cryptocurrencies, as the market is particularly volatile.
Top crypto projects in the US | April 2024
Trusted
Disclaimer
In line with the Trust Project guidelines, this price analysis article is for informational purposes only and should not be considered financial or investment advice. BeInCrypto is committed to accurate, unbiased reporting, but market conditions are subject to change without notice. Always conduct your own research and consult with a professional before making any financial decisions. Please note that our Terms and Conditions, Privacy Policy, and Disclaimers have been updated.

Valdrin Tahiri
Valdrin discovered cryptocurrencies while he was getting his MSc in Financial Markets from the Barcelona School of Economics. Shortly after graduating, he began writing for several different cryptocurrency related websites as a freelancer before eventually taking on the role of BeInCrypto's Senior Analyst.
(I do not have a discord and will not contact you first there. Beware of scammers)
READ FULL BIO
Sponsored
Sponsored