

On August 14, the XRP price reached a high of $0.29. A rapid decrease ensued and the price reached a low of $0.24 the same day. This amounted to a decrease of more than 16 percent in two-hours. On August 19, it reached a similar high near $0.29 before beginning yet another decrease.
 At the time of writing, the XRP price was trading near $0.26.
For our previous analysis, click here.
Interested in trading cryptocurrencies with a multiplier of 100x? Check out our partner exchange, StormGain, to do so!
At the time of writing, the XRP price was trading near $0.26.
For our previous analysis, click here.
Interested in trading cryptocurrencies with a multiplier of 100x? Check out our partner exchange, StormGain, to do so!

XRP Price: Trends and Highlights for August 22
- XRP/USD broke down from a symmetrical triangle.
- It is following a descending resistance line.
- There is support at $0.255 and $0.20.
- The XRP price is trading below daily moving averages.
Previous XRP Price Movement
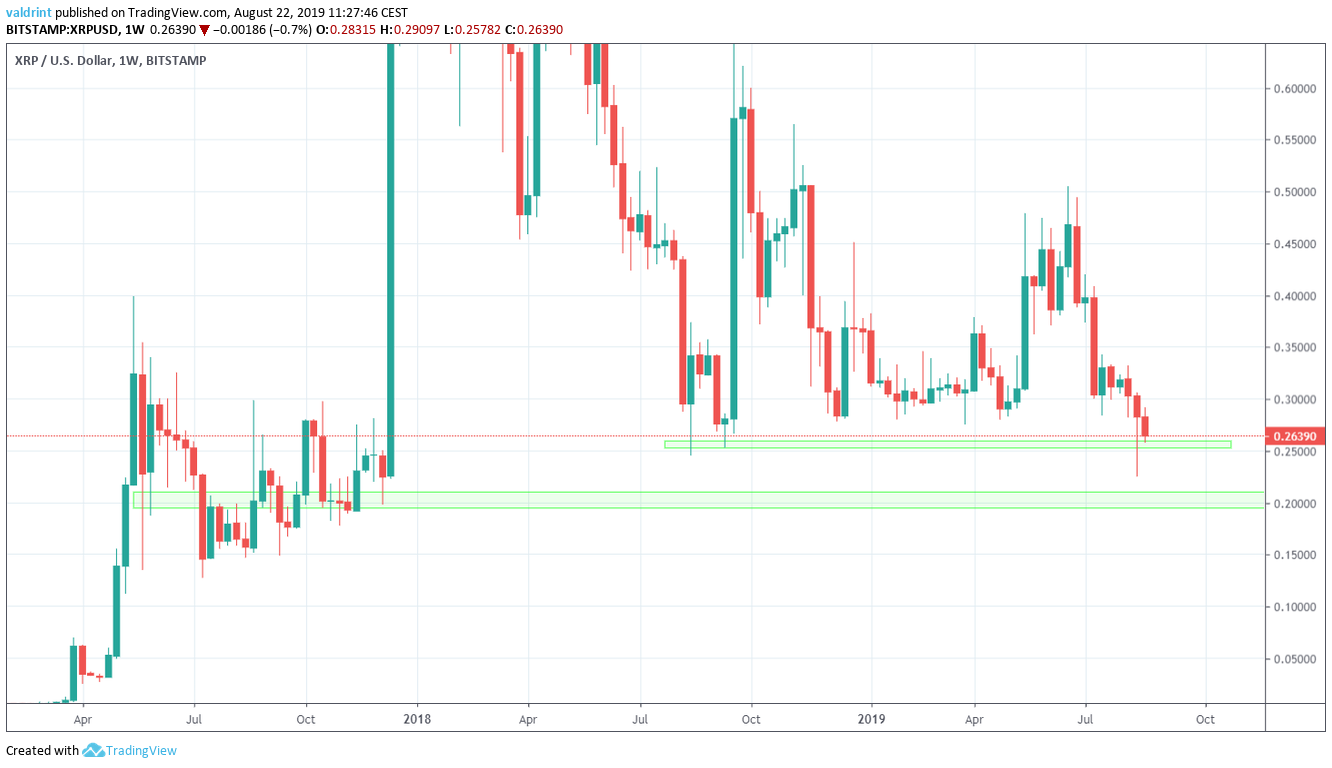
A closer look at price movement reveals that XRP broke down from a symmetrical triangle. After the breakout, the it almost reached the support area found between $0.25-$0.26.
 Additionally, we can see that the resistance line from the symmetrical triangle is still intact.
At the time of writing, the XRP price was making an attempt at breaking out.
Will it be successful?
Additionally, we can see that the resistance line from the symmetrical triangle is still intact.
At the time of writing, the XRP price was making an attempt at breaking out.
Will it be successful?
Long-Term Movement
A look at the daily time-frame shows that XRP has not traded below the current support area since December of 2017. Additionally, we can see a recent breakdown from a horizontal support line. The breakdown occurred with very significant volume.
Afterwards, the XRP price increased and touched the previous resistance line before beginning a downward move.
It failed to reach a close above the breakdown level.
This gives more credence to the bearish sentiment in the market, indicating that buyers did not have enough strength to initiate an uptrend.
The breakdown occurred with very significant volume.
Afterwards, the XRP price increased and touched the previous resistance line before beginning a downward move.
It failed to reach a close above the breakdown level.
This gives more credence to the bearish sentiment in the market, indicating that buyers did not have enough strength to initiate an uptrend.
Possible Downtrend
A look at the daily moving averages (MA) supports further price decreases. The XRP price recently made two unsuccessful attempts at moving above the 20-day MA.
Currently, it is trading below both the 10- and 20-day MAs.
If the price breaks down from the support area, the next one can be found at $0.20
The XRP price recently made two unsuccessful attempts at moving above the 20-day MA.
Currently, it is trading below both the 10- and 20-day MAs.
If the price breaks down from the support area, the next one can be found at $0.20
XRP Price Summary
The XRP price recently broke down from a symmetrical triangle. According to our analysis, it is likely to continue trading close to the support area where it currently is. A further breakdown is not ruled out. For trading purposes, we believe that the current market conditions do not offer a profitable trade — whether that is long or short. Where do you think the XRP price will go next? Let us know in the comments below.Disclaimer: This article is not trading advice and should not be construed as such. Always consult a trained financial professional before investing in cryptocurrencies, as the market is particularly volatile. Images are courtesy of Shutterstock, TradingView.
Disclaimer
In line with the Trust Project guidelines, this price analysis article is for informational purposes only and should not be considered financial or investment advice. BeInCrypto is committed to accurate, unbiased reporting, but market conditions are subject to change without notice. Always conduct your own research and consult with a professional before making any financial decisions. Please note that our Terms and Conditions, Privacy Policy, and Disclaimers have been updated.

Valdrin Tahiri
Valdrin discovered cryptocurrencies while he was getting his MSc in Financial Markets from the Barcelona School of Economics. Shortly after graduating, he began writing for several different cryptocurrency related websites as a freelancer before eventually taking on the role of BeInCrypto's Senior Analyst.
(I do not have a discord and will not contact you first there. Beware of scammers)
READ FULL BIO
Sponsored
Sponsored