
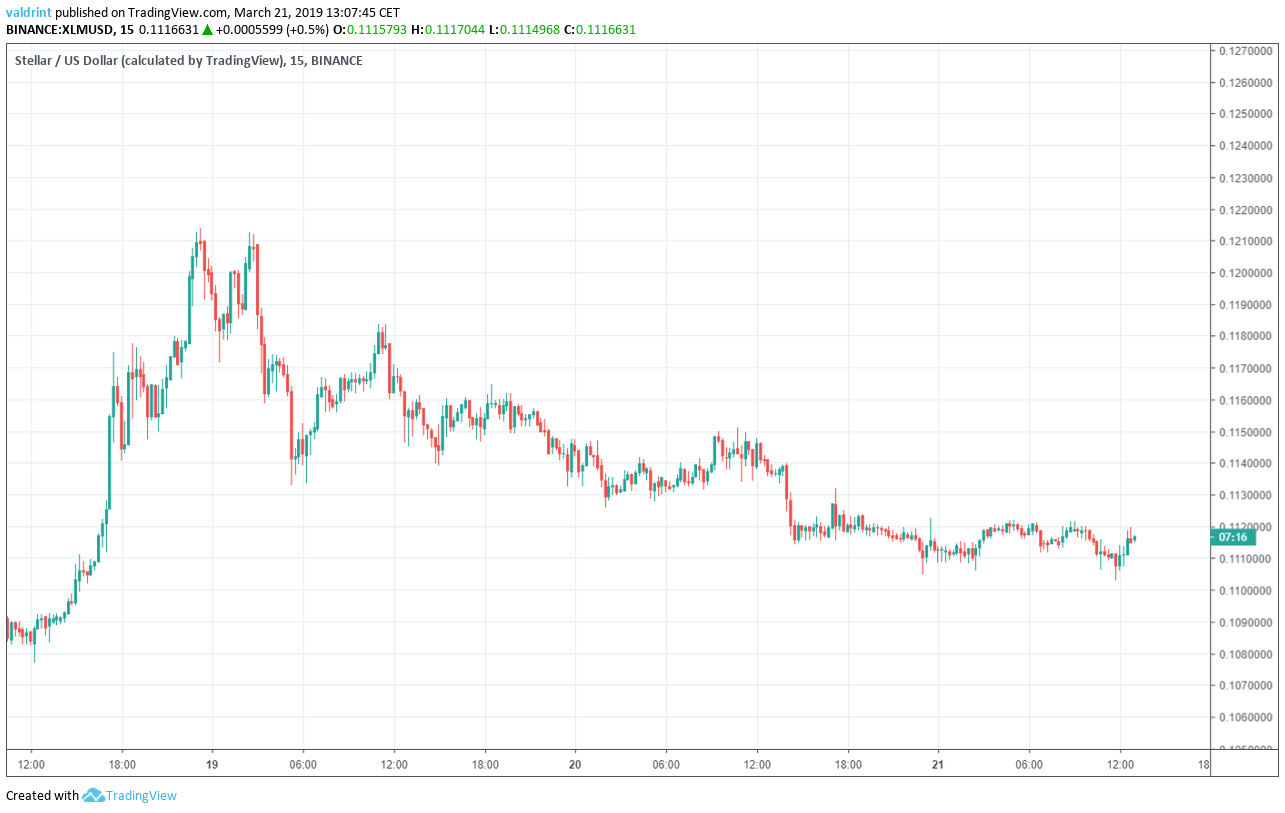
On March 18, 2019, the price of Stellar Lumens (XLM) made a low close to $0.1. A rapid upward move followed, and price made a high slightly above $0.12 during the same day. Since then, the price has been on a gradual downtrend.
When will the downtrend end?
Keep reading to find out.
XLM: Highlights and Trends For March 21
- The price has been on a downtrend since Mar 18.
- The price is trading inside a descending wedge.
- There has been bullish divergence developing in the MACD and the RSI.
- There are resistance areas near $0.12
- There are support areas near $0.105, $0.1 and $0.09.
Descending Support Line
The price of XLM on Binance is analyzed at fifteen-minute intervals from Mar 18 to Mar 21. On Mar 18, the price made a low of $0.114. A rapid increase ensued, followed by a sharp decrease. Several market cycles have been completed since, with each low being lower than the previous one. Tracing these lows gives us a descending support line.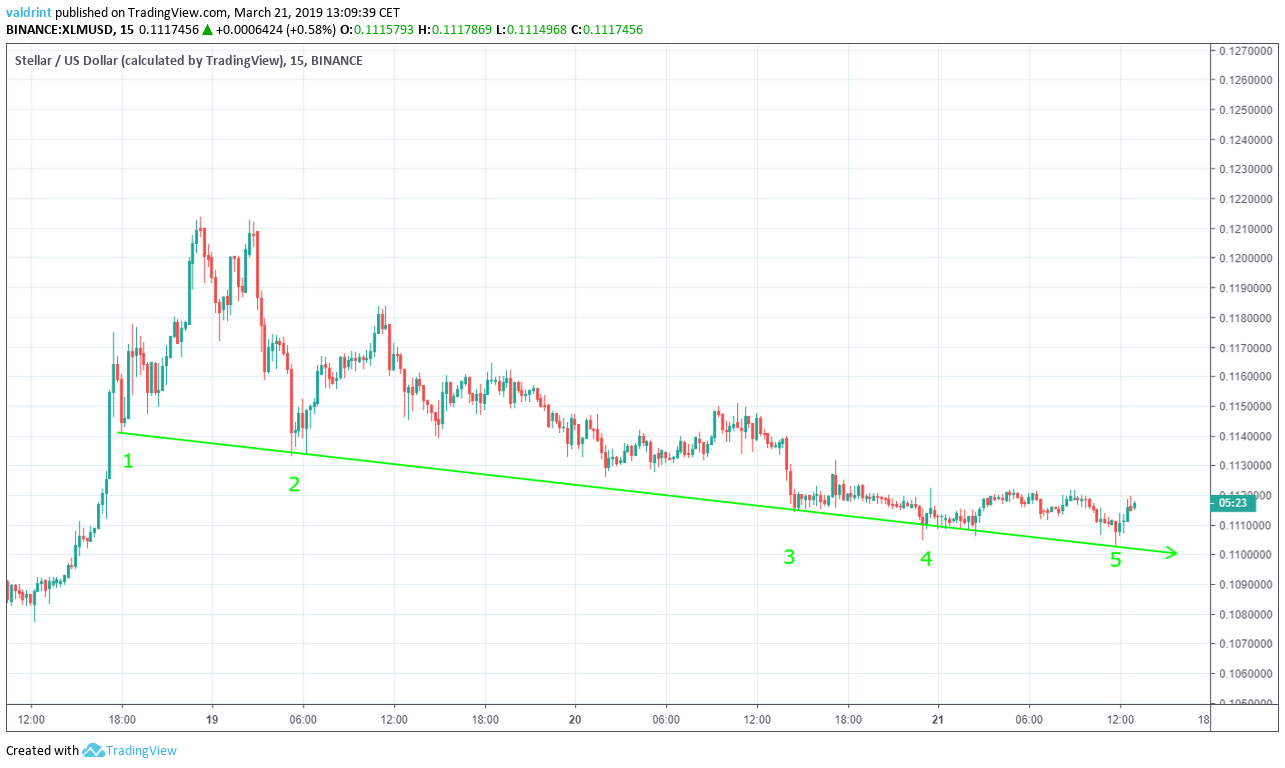 The support line can act as a floor to price, preventing further downward movement. It theoretically traces the lower limits of the price and measures the rate of decrease.
The price has been decreasing at the same rate as predicted by the line.
The price has decreased at the rate predicted by the ascending support line and is likely to continue to do so for the foreseeable future. The possibility of a breakdown below support remains; however, that cannot be conclusively determined by support alone.
The support line can act as a floor to price, preventing further downward movement. It theoretically traces the lower limits of the price and measures the rate of decrease.
The price has been decreasing at the same rate as predicted by the line.
The price has decreased at the rate predicted by the ascending support line and is likely to continue to do so for the foreseeable future. The possibility of a breakdown below support remains; however, that cannot be conclusively determined by support alone.
Descending Wedge
On Mar 19, the price made a high of $0.118. It has been gradually decreasing since, with each high being lower than the previous one. Tracing these highs gives us a descending resistance line.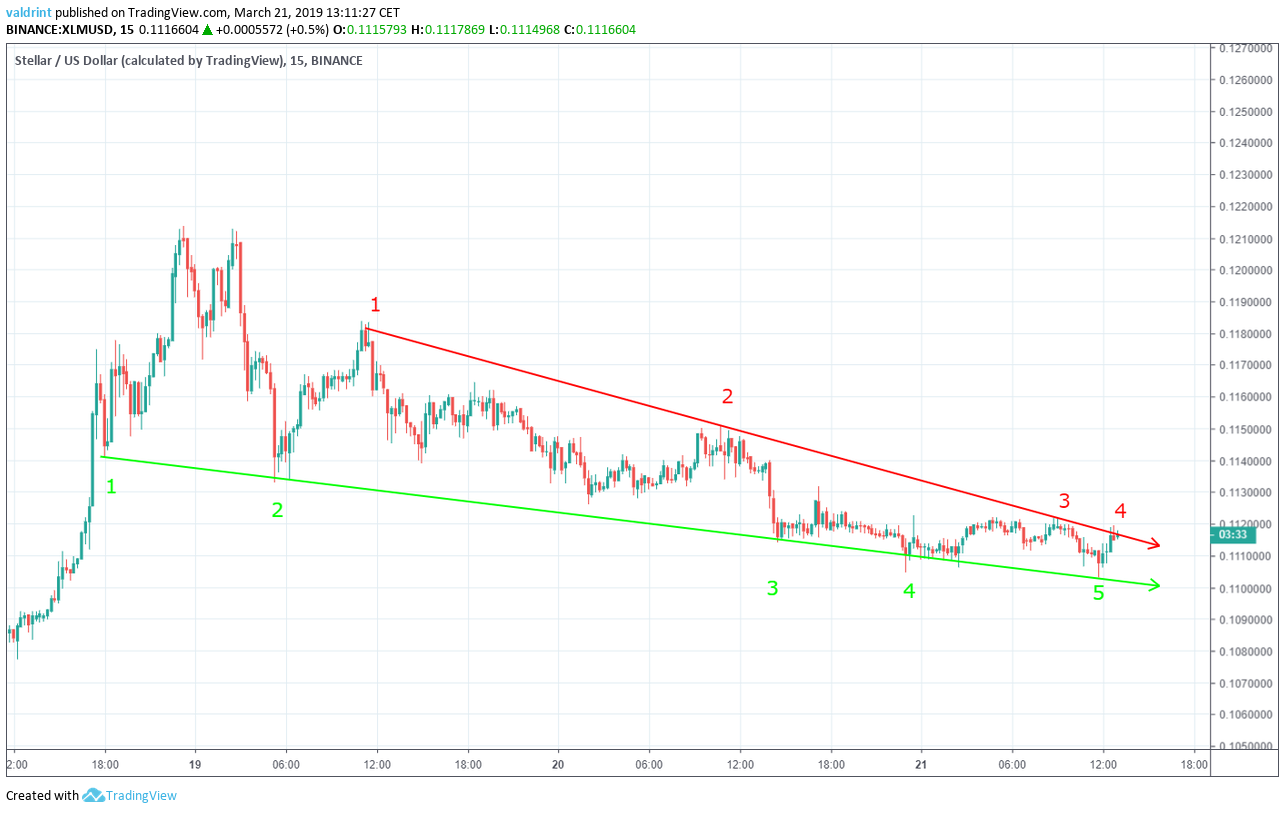 Similarly to the support line, the resistance line prevents further upward movement and predicts the rate of decrease. The price has decreased at the same rate as predicted by the line.
The support and resistance lines combine to create a descending wedge, which is a bullish pattern, suggesting that price increases are likely in the future. Highs just above the resistance were observed at the time of writing, suggesting that a breakout above resistance might be forthcoming.
In such a case, the short-term price increases predicted above would be validated. We expect that a reversal will happen shortly thereafter leading to continued price decreases. This could cause new resistance and support to emerge.
Similarly to the support line, the resistance line prevents further upward movement and predicts the rate of decrease. The price has decreased at the same rate as predicted by the line.
The support and resistance lines combine to create a descending wedge, which is a bullish pattern, suggesting that price increases are likely in the future. Highs just above the resistance were observed at the time of writing, suggesting that a breakout above resistance might be forthcoming.
In such a case, the short-term price increases predicted above would be validated. We expect that a reversal will happen shortly thereafter leading to continued price decreases. This could cause new resistance and support to emerge.
Bullish Divergence
Combining moving average convergence divergence (MACD) and relative strength index (RSI) bullish/bearish divergence with support/resistance essentially predicts price fluctuations. The MACD is a trend indicator that shows the relationship between two moving averages (long and short-term) and the price. It is used to measure the strength of a move. The RSI is an indicator which calculates the size of the changes in price in order to determine oversold or overbought conditions in the market.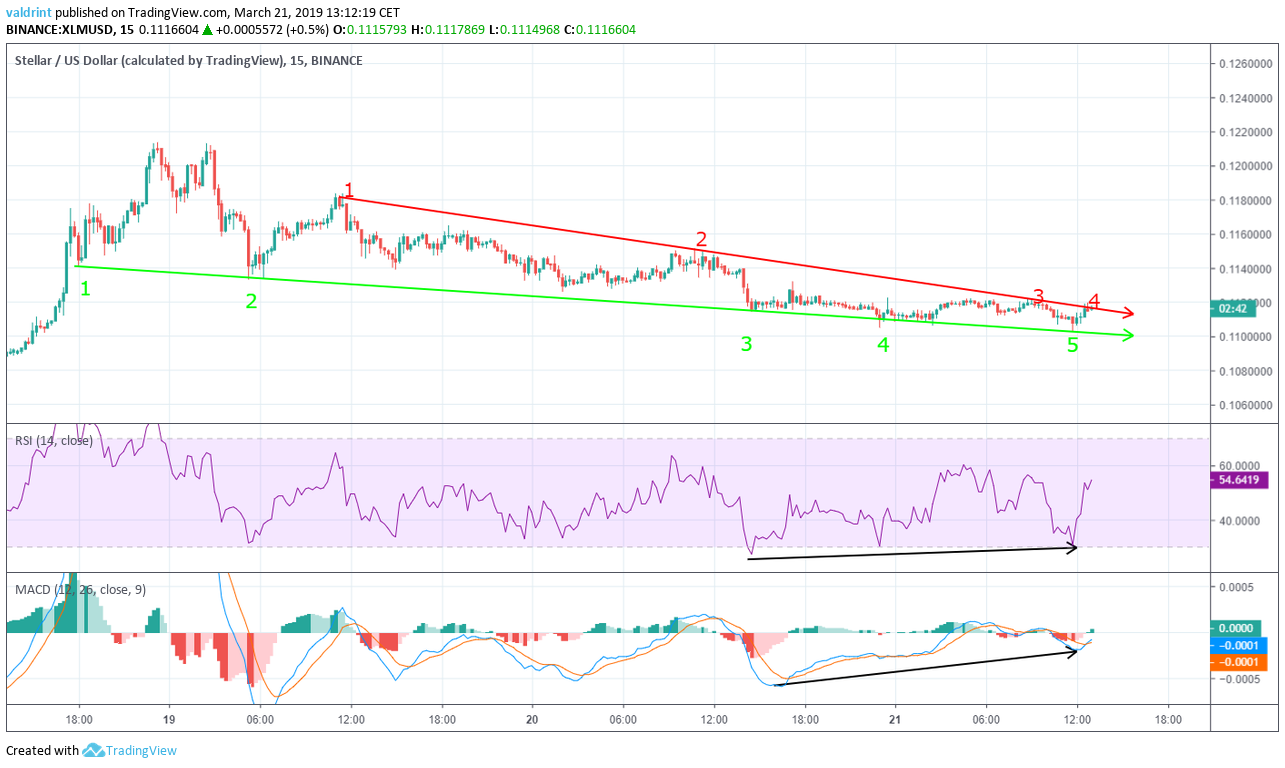 On Mar 2, the price made a low of $0.111. It has gradually decreased since, making lower lows.
Similarly, the RSI and MACD made a low on Mar 20. However, they have continued to generate higher values since.
This is known as bullish divergence and often precedes increases in price. It is especially effective if bullish divergence occurs in a bullish pattern and vice versa. This is the case with XLM, since the descending wedge is a bullish pattern.
These indicators further suggest that a breakout from the wedge is likely forthcoming in the near future and may have already begun. Immediate price increases are expected. They may not reach higher highs or last for a significant period.
On Mar 2, the price made a low of $0.111. It has gradually decreased since, making lower lows.
Similarly, the RSI and MACD made a low on Mar 20. However, they have continued to generate higher values since.
This is known as bullish divergence and often precedes increases in price. It is especially effective if bullish divergence occurs in a bullish pattern and vice versa. This is the case with XLM, since the descending wedge is a bullish pattern.
These indicators further suggest that a breakout from the wedge is likely forthcoming in the near future and may have already begun. Immediate price increases are expected. They may not reach higher highs or last for a significant period.
Future Movement
Resistance and support areas are formed when the price reaches a certain level several times. They can act as a ceiling/floor that prevents the price from moving further in that direction. The closest resistance area is found near $0.12. Based on our analysis, it is unlikely that the price will reach this area
The closest support area is found near $0.105, followed by support areas near $0.1 and $0.09 Based on our analysis, it is likely that the price will reach at least one of these areas.
The closest resistance area is found near $0.12. Based on our analysis, it is unlikely that the price will reach this area
The closest support area is found near $0.105, followed by support areas near $0.1 and $0.09 Based on our analysis, it is likely that the price will reach at least one of these areas.
Summary of Analysis
Based on this analysis, the price of XLM is likely to increase in the near future. However, the increase should be followed by a rapid downward move. If the price falls to one of the support areas, the prediction will be partially validated. If it first breaks out of the wedge and then falls to the support areas, the prediction will be fully validated. A breakout above $0.12 would invalidate the prediction. Do you think the price of XLM will eventually break out from the wedge? Let us know in the comments. Disclaimer: This article is not trading advice and should not be construed as such. Always consult a trained financial professional before investing in cryptocurrencies, as the market is particularly volatile.
Top crypto projects in the US | April 2024
Trusted
Disclaimer
In line with the Trust Project guidelines, this price analysis article is for informational purposes only and should not be considered financial or investment advice. BeInCrypto is committed to accurate, unbiased reporting, but market conditions are subject to change without notice. Always conduct your own research and consult with a professional before making any financial decisions. Please note that our Terms and Conditions, Privacy Policy, and Disclaimers have been updated.

Valdrin Tahiri
Valdrin discovered cryptocurrencies while he was getting his MSc in Financial Markets from the Barcelona School of Economics. Shortly after graduating, he began writing for several different cryptocurrency related websites as a freelancer before eventually taking on the role of BeInCrypto's Senior Analyst.
(I do not have a discord and will not contact you first there. Beware of scammers)
READ FULL BIO
Sponsored
Sponsored